Market Wrap: Stocks, Bonds, Commodities
Stock futures were roughly flat Monday night. Futures tied to the Dow Jones Industrial Average ticked higher by 6 points, or 0.02%. S&P 500 futures and Nasdaq 100 futures oscillated near the flat line.
The Dow Jones Industrial Average rose 407.51 points to 35,473.13, the S&P 500 gain 0.90% to 4,518.44 and the Nasdaq Composite add 85.41 points to 13,994.40.
MSCI’s index of Asia-Pacific stocks outside Japan is decline 1.19% to 640.55 levels. The Australian index was lower by 0.22% to 7,309.20. Japanese Nikkei Index ascend 0.27% today.
European stocks were negative on Tuesday, with the Stoxx Europe 50 Index fell 0.68% to 4,307.35, Germany’s DAX drop 0.49% to 15,873.35, and France’s CAC decline 0.41% to 7,289.56 and U.K.’s FTSE 100 subtract 0.26% to 7,534.05.
Benchmark 10-year U.S. Treasury fell as demand for safe assets ascend again, today 10-year bond yields negative 1.50% to 4.0160.
Oil prices eased from four-month highs as crude’s summer rally takes a breather. Global benchmark Brent futures traded lower by 0.9% at $85.44 a barrel after reaching their highest level since April.
Spot Brent crude oil drop 1.31% to $84.22 per barrel. US West Texas Intermediate crude is down 1.27% to $80.89 a barrel.
The yellow metal gold is decline 0.14% to 1,967.25 dollars per ounce.
Market Wrap: Forex
The dollar turned decisively higher on Tuesday as traders struggled to get a grip on the diverging growth outlooks between the world’s two largest economies, though they largely shrugged off another disappointing set of Chinese trade figures.
Today, the U.S. dollar index measures the Greenback against a trade-weighted basket of six major currencies, which surged 0.30% to 102.162.
The Euro US Dollar (EUR/USD) is a widely traded pair that is down 0.19% today. This left the pair trading around $1.09810.
The Japanese yen was negative against the U.S. dollar on Tuesday. Today USD/JPY is surged 0.40% to the 143.060 level.
Another commodity-related currency negative against the U.S dollar, AUD/USD fell 0.77% to 0.65220, and NZD/USD slipped 0.73% to 0.60590 level.
EUR/USD Intraday: Trend on the upside
Our pivot point is at 1.09890
Preferable Price Action: Take buy positions above pivot level with targets at 1.10240 & 1.10450 in extension.
Alternative Price Action: Below pivot looks for a further downside to 1.09600 & 1.09410.
Comment: RSI is above 50 levels and Pairs above its 20MA & 55MA.
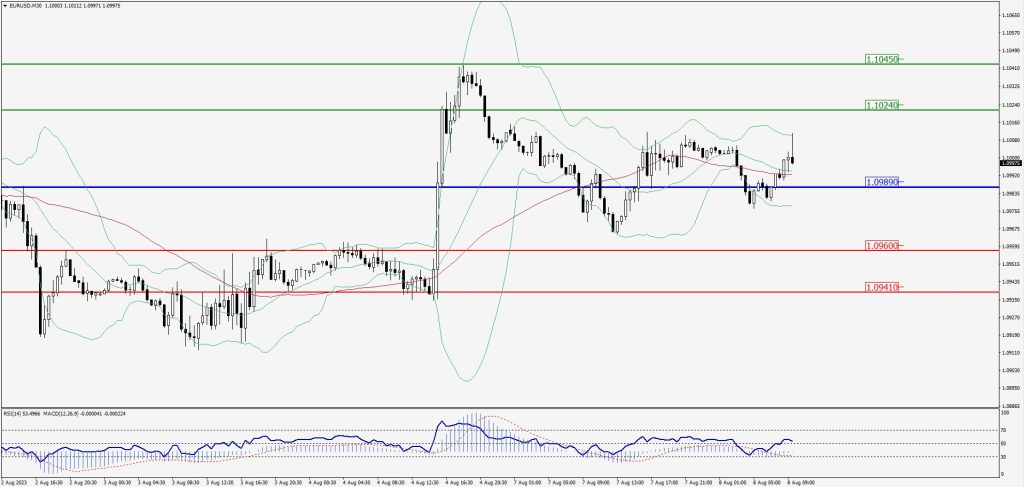
Green Lines Indicate Resistance Levels – Red Lines Indicate Support Levels
Light Blue is a Pivot Point – Black represents the price when the report was produced
GBP/USD Intraday: Resistance level at 1.27890
Our pivot point is at 1.27890
Preferable Price Action: Sell positions below pivot with targets at 1.27250 & 1.26880 in extension.
Alternative Price Action: The price above pivot would call for further upside to 1.28380 & 1.28770.
Comment: RSI is below 50 levels and Pairs below 20MA.
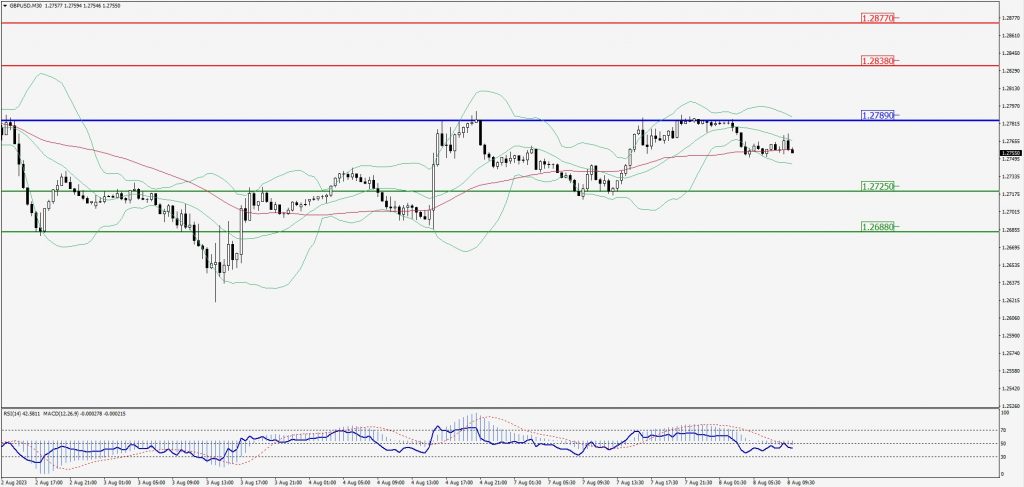
Green Lines Indicate Resistance Levels – Red Lines Indicate Support Levels
Light Blue is a Pivot Point – Black represents the price when the report was produced
USD/JPY Intraday: Trend on the upside
Our pivot point is at 142.810
Preferable Price Action: Buy position above pivot with the target at 143.400 and 143.820 in extension.
Alternative Price Action: The downside breakout of the pivot would call for 142.280 and 141.910.
Comment: MACD is above 50 level and Pairs above 55MA.
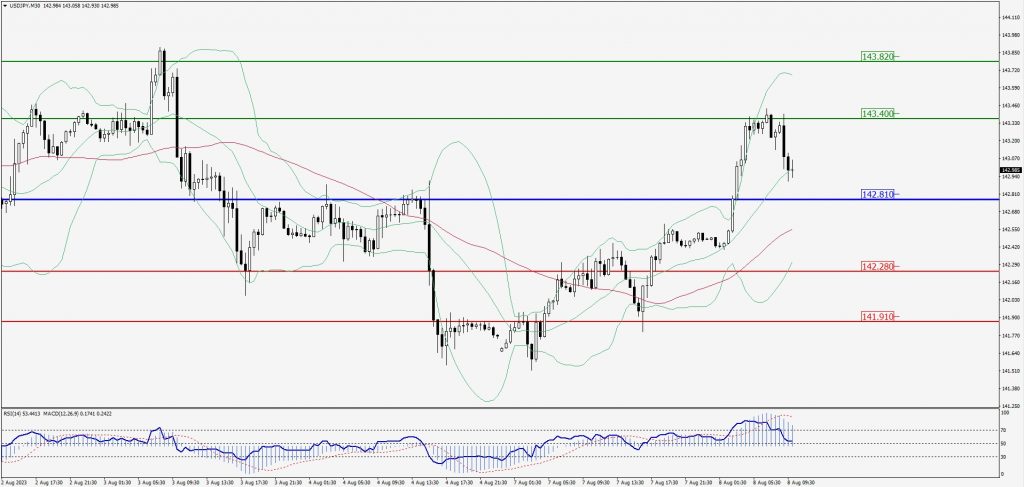
Green Lines Indicate Resistance Levels – Red Lines Indicate Support Levels
Light Blue is a Pivot Point – Black represents the price when the report was produced
AUD/USD Intraday: Major trend on the downside
Our pivot point is at 0.65390
Preferable Price Action: Sell positions below pivot with targets at 0.65060 & 0.64830 in extension.
Alternative Price Action: Above pivot looks for a further upside with 0.65680 & 0.65900 as targets.
Comment: RSI is below 50 levels and Pairs below its 20MA & 55MA.
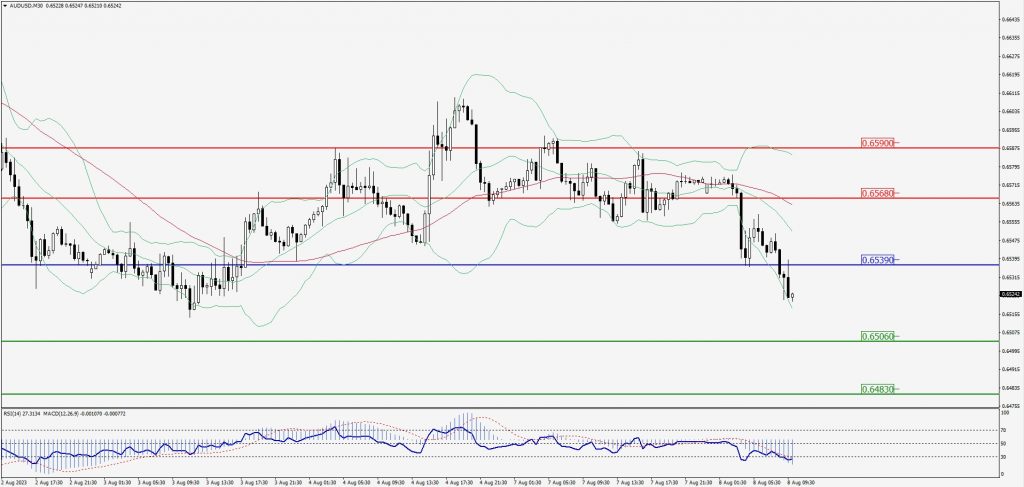
Green Lines Indicate Resistance Levels – Red Lines Indicate Support Levels
Light Blue is a Pivot Point – Black represents the price when the report was produced
CRUDEOIL Intraday: Trend on the downside
Our pivot point is at 81.38
Preferable Price Action: Below pivot sell oil with 80.39 & 79.63 as targets.
Alternative Price Action: Buy crude above pivot with targets at 82.32 and 83.11 in extension.
Comment: MACD is negative territory and Pairs below its 20MA & 55MA.
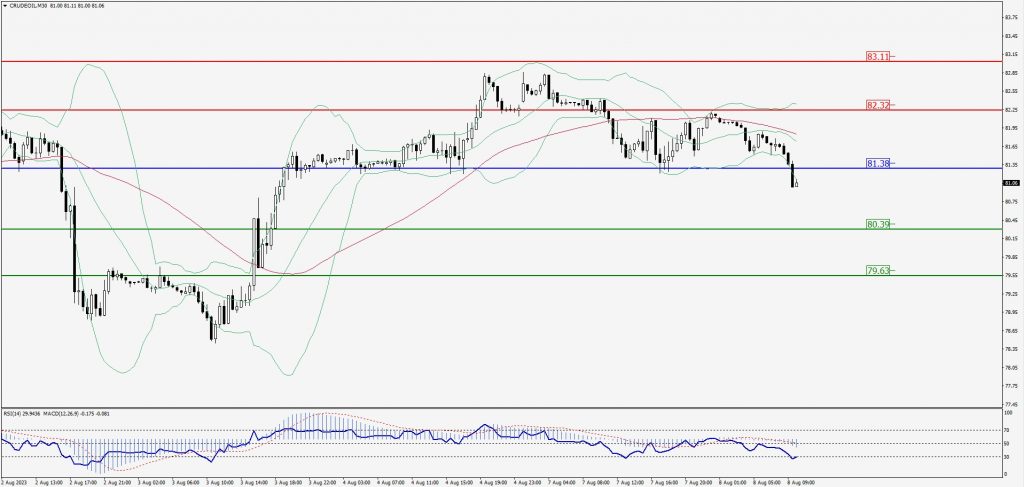
Green Lines Indicate Resistance Levels – Red Lines Indicate Support Levels
Light Blue is a Pivot Point – Black represents the price when the report was produced
XAU/USD Intraday: Resistance level at 1936.20
Our pivot point is 1936.20
Preferable Price Action: Further downside to 1928.10 and 1922.90.
Alternative Price Action: If the price gives an upside breakout of a pivot, then the price extends to 1936.30 and 1950.20.
Comment: MACD is below 50 level and Pairs below its 20MA & 55MA.
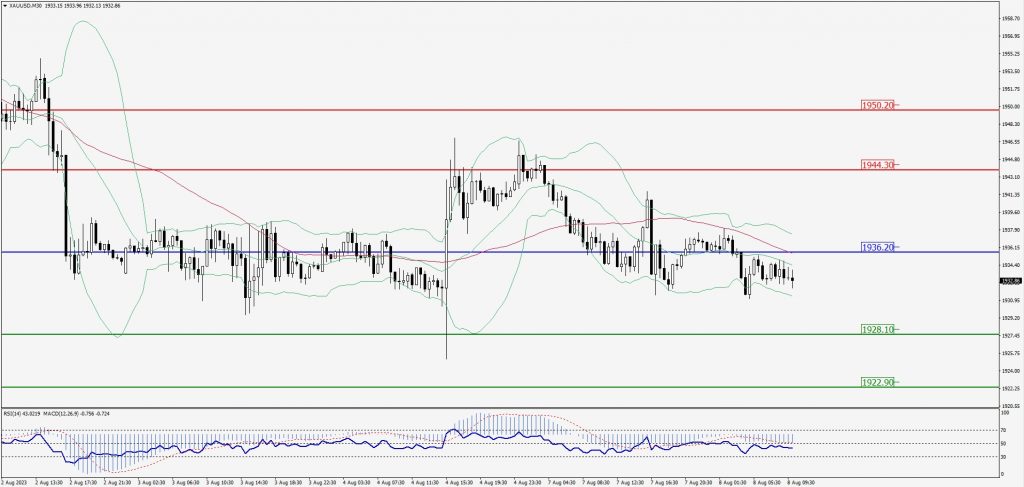
Green Lines Indicate Resistance Levels – Red Lines Indicate Support Levels
Light Blue is a Pivot Point – Black represents the price when the report was produced
Dow Jones Intraday: Trend on the downside
Our pivot point is 35,450.00
Preferable Price Action: Take sell positions below the pivot with targets at 35,331.00 & 35,247.00.
Alternative Price Action: Above 35,450.00 looks for further upside to 35,577.00 & 35,675.00.
Comment: RSI is below 50 levels and Pairs below 20MA.
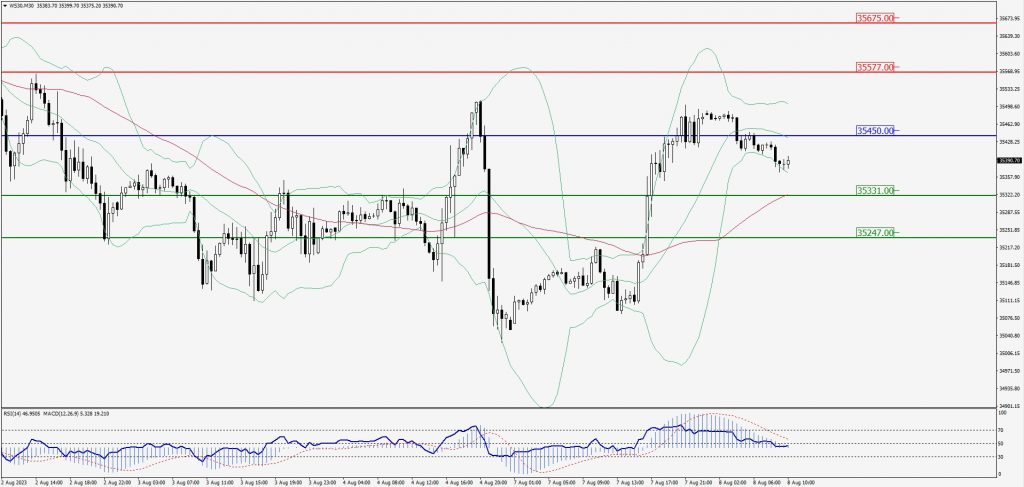
Green Lines Indicate Resistance Levels – Red Lines Indicate Support Levels
Light Blue is a Pivot Point – Black represents the price when the report was produced