Market Wrap: Stocks, Bonds, Commodities
Futures tied to the S&P 500 traded near flat on Tuesday night as investors parsed a batch of corporate earnings from major technology names and geared up for Wednesday’s interest rate policy decision.
The Dow Jones Industrial Average rose 26.83 points to 35,438.07, the S&P 500 gain 0.28% to 4,567.46 and the Nasdaq Composite add 85.69 points to 14,144.55.
MSCI’s index of Asia-Pacific stocks outside Japan is drop 0.16% to 653.41 levels. The Australian index was higher by 0.85% to 7,402.00. Japanese Nikkei Index ascend 0.01% today.
European stocks were negative on Wednesday, with the Stoxx Europe 50 Index fell 0.90% to 4,352.25, Germany’s DAX decline 0.51% to 16,134.15, and France’s CAC drop 1.24% to 7,323.50 and U.K.’s FTSE 100 subtract 0.30% to 7,669.10.
Benchmark 10-year U.S. Treasury fell as demand for safe assets ascend again, today 10-year bond yields negative 0.77% to 3.8850.
Oil prices rose to fresh three-month highs on Tuesday, as signs of tighter supplies and pledges by Chinese authorities to shore up the world’s second-biggest economy lifted sentiment.
Spot Brent crude oil drop 0.50% to $82.84 per barrel. US West Texas Intermediate crude is down 0.51% to $79.21 a barrel.
The yellow metal gold is advance 0.46% to 1,972.60 dollars per ounce.
Market Wrap: Forex
The U.S. dollar edged lower Tuesday, but remained near a two-week high as traders awaited a widely expected interest rate hike from the Federal Reserve later in the session.
Today, the U.S. dollar index measures the Greenback against a trade-weighted basket of six major currencies, which slipped 0.23% to 100.870.
The Euro US Dollar (EUR/USD) is a widely traded pair that is up 0.20% today. This left the pair trading around $1.10750.
The Japanese yen was negative against the U.S. dollar on Wednesday. Today USD/JPY is slipped 0.35% to the 140.410 level.
Another commodity-related currency negative against the U.S dollar, AUD/USD fell 0.35% to 0.67650, and NZD/USD slipped 0.02% to 0.62200 level.
EUR/USD Intraday: Trend on the upside
Our pivot point is at 1.10500
Preferable Price Action: Take buy positions above pivot level with targets at 1.10960 & 1.11270 in extension.
Alternative Price Action: Below pivot looks for a further downside to 1.10100 & 1.09810.
Comment: RSI is above 50 levels and Pairs above its 20MA & 55MA.
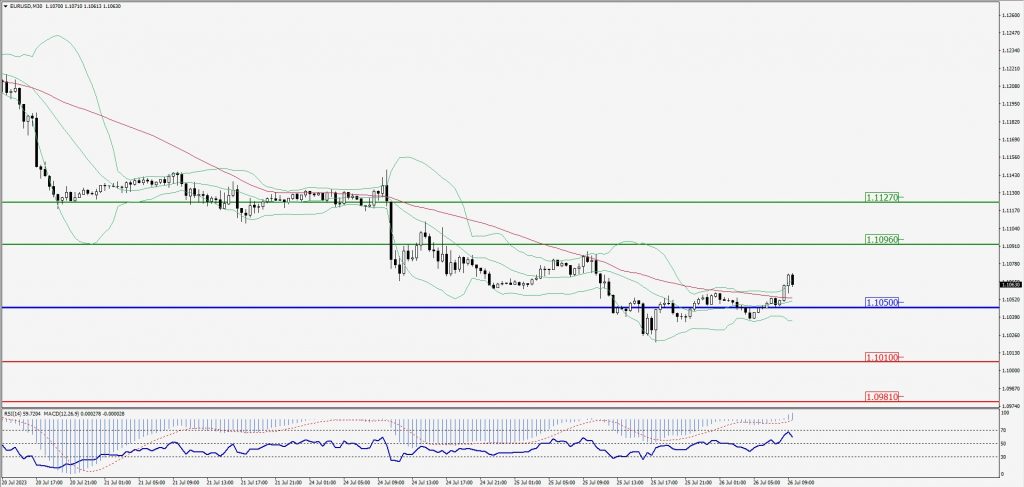
Green Lines Indicate Resistance Levels – Red Lines Indicate Support Levels
Light Blue is a Pivot Point – Black represents the price when the report was produced
GBP/USD Intraday: Trend on the upside
Our pivot point is at 1.28820
Preferable Price Action: Buy positions above pivot with targets at 1.29110 & 1.29300 in extension.
Alternative Price Action: The price below pivot would call for further downside to 1.28570 & 1.28380.
Comment: RSI is above 50 levels and Pairs above 55MA.
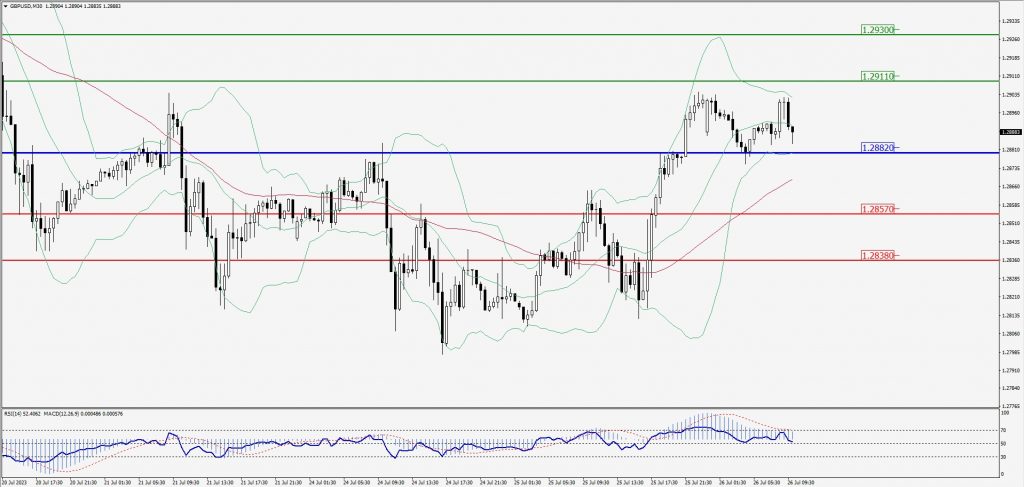
Green Lines Indicate Resistance Levels – Red Lines Indicate Support Levels
Light Blue is a Pivot Point – Black represents the price when the report was produced
USD/JPY Intraday: Major trend on the downside
Our pivot point is at 140.870
Preferable Price Action: Sell position below pivot with the target at 140.410 and 140.100 in extension.
Alternative Price Action: The upside breakout of the pivot would call for 141.420 and 141.780.
Comment: MACD is below 50 level and Pairs below its 20MA & 55MA.
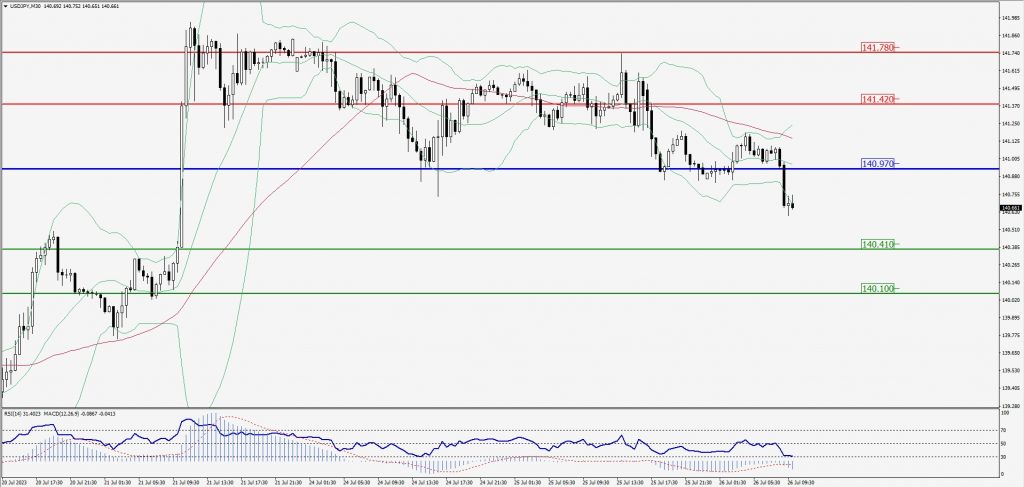
Green Lines Indicate Resistance Levels – Red Lines Indicate Support Levels
Light Blue is a Pivot Point – Black represents the price when the report was produced
AUD/USD Intraday: In a consolidation zone
Our pivot point is at 0.67670
Preferable Price Action: Buy positions above pivot with targets at 0.67950 & 0.68120 in extension.
Alternative Price Action: Below pivot looks for a further downside with 0.67410 & 0.67240 as targets.
Comment: RSI is at 50 levels.
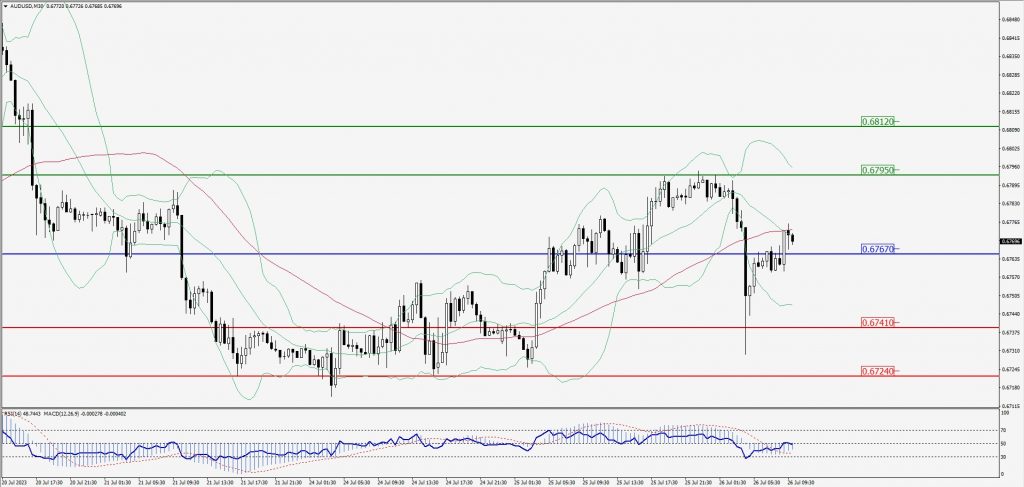
Green Lines Indicate Resistance Levels – Red Lines Indicate Support Levels
Light Blue is a Pivot Point – Black represents the price when the report was produced
CRUDEOIL Intraday: Support level at 79.19
Our pivot point is at 79.19
Preferable Price Action: Above pivot buy oil with 80.07 & 80.69 as targets.
Alternative Price Action:Sell crude below pivot with targets at 78.49 and 77.92 in extension.
Comment: MACD is positive territory and Pairs above 55MA.
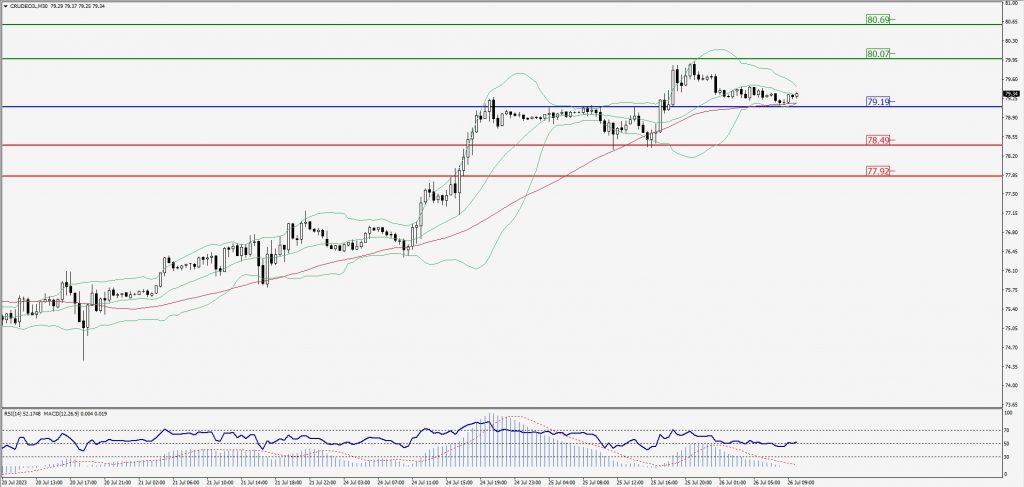
Green Lines Indicate Resistance Levels – Red Lines Indicate Support Levels
Light Blue is a Pivot Point – Black represents the price when the report was produced
XAU/USD Intraday: Major trend on the upside
Our pivot point is 1967.80
Preferable Price Action: Further upside to 1974.90 and 1979.70.
Alternative Price Action: If the price gives a downside breakout of a pivot, then the price extends to 1961.90 and 1958.00.
Comment: MACD is above 50 level and Pairs above its 20MA & 55MA.
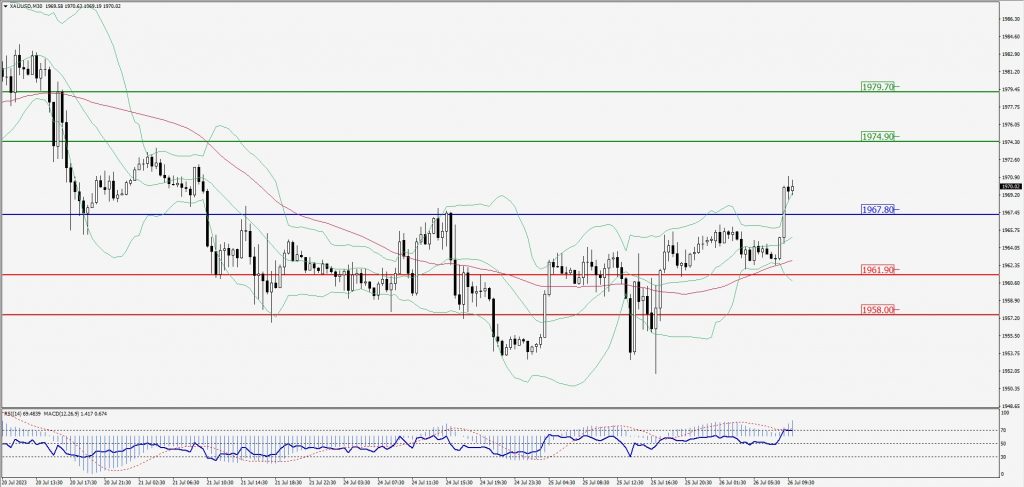
Green Lines Indicate Resistance Levels – Red Lines Indicate Support Levels
Light Blue is a Pivot Point – Black represents the price when the report was produced
Dow Jones Intraday: Support level at 35,398.00
Our pivot point is 35,398.00
Preferable Price Action: Take buy positions above the pivot with targets at 35,498.00 & 35,574.00.
Alternative Price Action: Below 35,398.00 looks for further downside to 35,305.00 & 35,232.00.
Comment: RSI is above 50 levels and Pairs above 20MA.
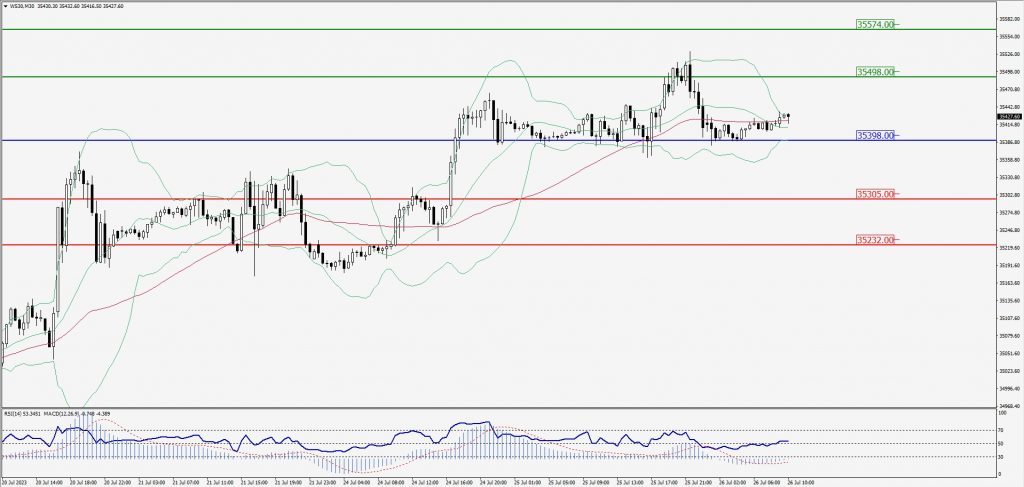
Green Lines Indicate Resistance Levels – Red Lines Indicate Support Levels
Light Blue is a Pivot Point – Black represents the price when the report was produced