Market Wrap: Stocks, Bonds, Commodities
US stock futures were flat on Monday night after the Dow Jones Industrial Average registered its longest winning streak since February 2017.
The Dow Jones Industrial Average rose 183.55 points to 35,411.24, the S&P 500 gain 0.40% to 4,554.64 and the Nasdaq Composite add 26.06 points to 14,058.87.
MSCI’s index of Asia-Pacific stocks outside Japan is advance 2.11% to 654.30 levels. The Australian index was lower by 0.46% to 7,339.70. Japanese Nikkei Index drop 0.13% today.
European stocks were positive on Tuesday, with the Stoxx Europe 50 Index rose 0.10% to 4,387.35, Germany’s DAX advance 0.01% to 16,192.55, and France’s CAC ascend 0.04% to 7,430.59 and U.K.’s FTSE 100 add 0.15% to 7,689.83.
Benchmark 10-year U.S. Treasury fell as demand for safe assets ascend again, today 10-year bond yields positive 0.83% to 3.8890.
Oil prices rose on Monday as tightening supply and hopes for Chinese stimulus underpinned Brent at well above $80 a barrel, even as traders expected more rate hikes from US and European central banks.
Spot Brent crude oil drop 0.21% to $82.32 per barrel. US West Texas Intermediate crude is down 0.09% to $78.67 a barrel.
The yellow metal gold is advance 0.11% to 1,964.45 dollars per ounce.
Market Wrap: Forex
The U.S. dollar edged lower Tuesday, amid caution ahead of the start of the two-day Federal Reserve policy meeting, while the Chinese yuan strengthened after Beijing pledged to step up policy support.
Today, the U.S. dollar index measures the Greenback against a trade-weighted basket of six major currencies, which surged 0.05% to 101.130.
The Euro US Dollar (EUR/USD) is a widely traded pair that is down 0.05% today. This left the pair trading around $1.10550.
The Japanese yen was negative against the U.S. dollar on Tuesday. Today USD/JPY is slipped 0.04% to the 141.380 level.
Another commodity-related currency positive against the U.S dollar, AUD/USD rose 0.50% to 0.67740, and NZD/USD surged 0.16% to 0.62120 level.
EUR/USD Intraday: In a consolidation zone
Our pivot point is at 1.10670
Preferable Price Action: Take buy positions above pivot level with targets at 1.11100 & 1.11380 in extension.
Alternative Price Action: Below pivot looks for a further downside to 1.10320 & 1.10080.
Comment: RSI is at 50 levels and Pairs above 20MA.
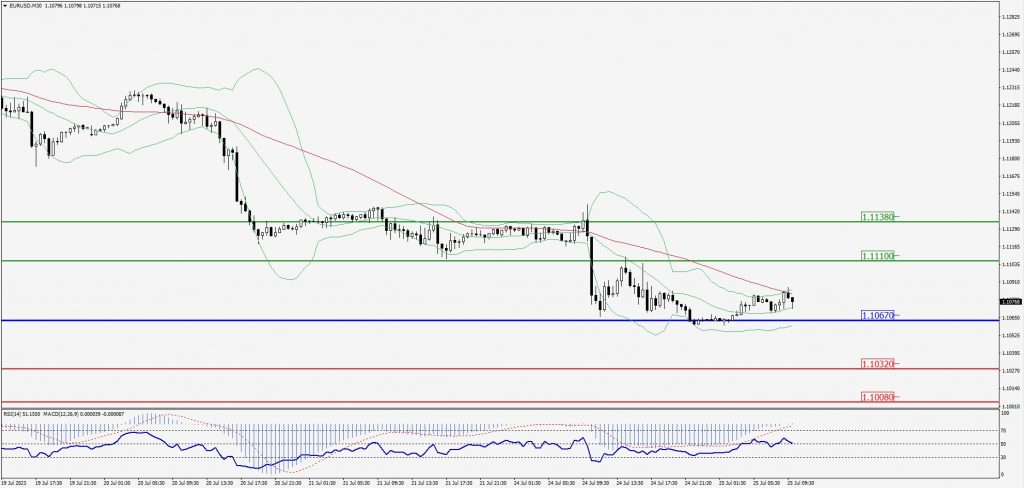
Green Lines Indicate Resistance Levels – Red Lines Indicate Support Levels
Light Blue is a Pivot Point – Black represents the price when the report was produced
GBP/USD Intraday: Trend on the upside
Our pivot point is at 1.28430
Preferable Price Action: Buy positions above pivot with targets at 1.28780 & 1.29010 in extension.
Alternative Price Action: The price below pivot would call for further downside to 1.28120 & 1.27900.
Comment: RSI is above 50 levels and Pairs above its 20MA & 55MA.
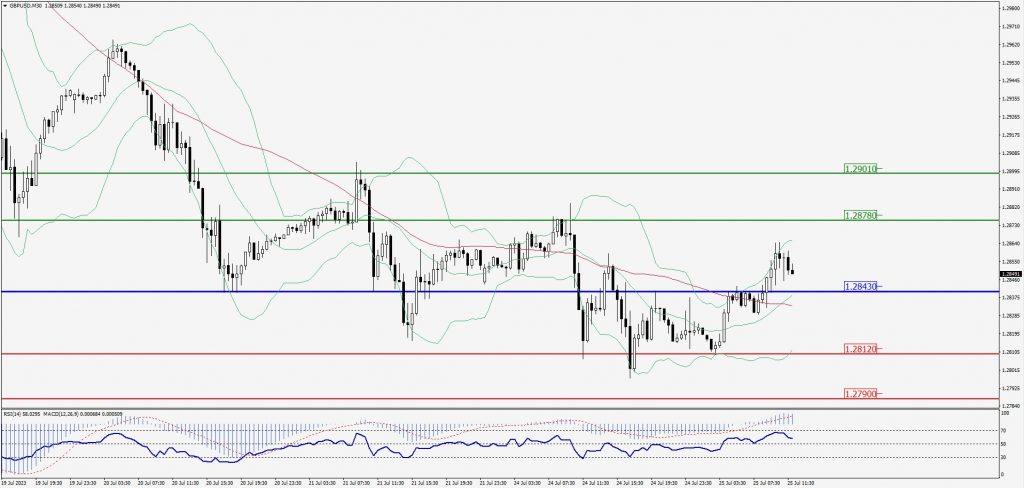
Green Lines Indicate Resistance Levels – Red Lines Indicate Support Levels
Light Blue is a Pivot Point – Black represents the price when the report was produced
USD/JPY Intraday: Major resistance level at 141.570
Our pivot point is at 141.570
Preferable Price Action: Sell position below pivot with the target at 140.910 and 140.520 in extension.
Alternative Price Action: The upside breakout of the pivot would call for 142.140 and 142.590.
Comment: MACD is below 50 level.
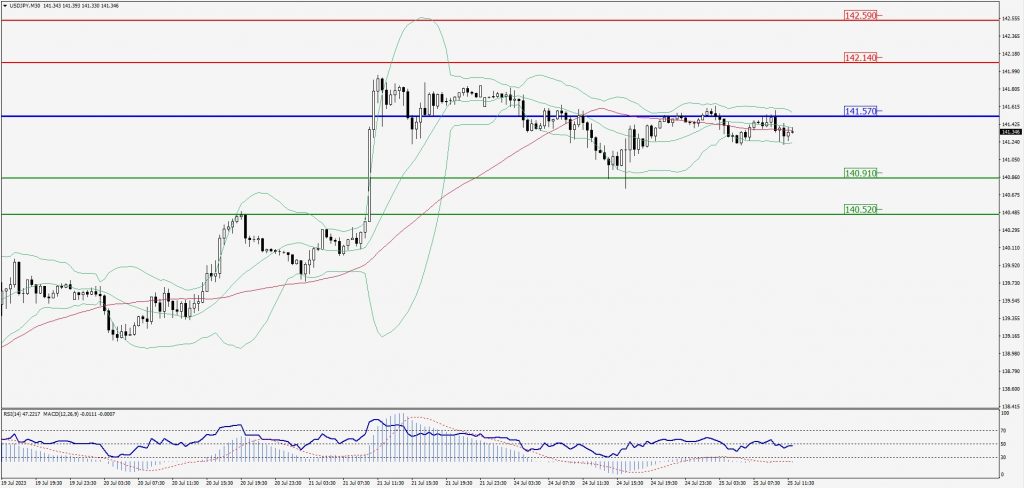
Green Lines Indicate Resistance Levels – Red Lines Indicate Support Levels
Light Blue is a Pivot Point – Black represents the price when the report was produced
AUD/USD Intraday: Trend on the upside
Our pivot point is at 0.67670
Preferable Price Action: Buy positions above pivot with targets at 0.67950 & 0.68120 in extension.
Alternative Price Action: Below pivot looks for a further downside with 0.67410 & 0.67240 as targets.
Comment: RSI is above 50 levels and Pairs above its 20MA & 55MA.
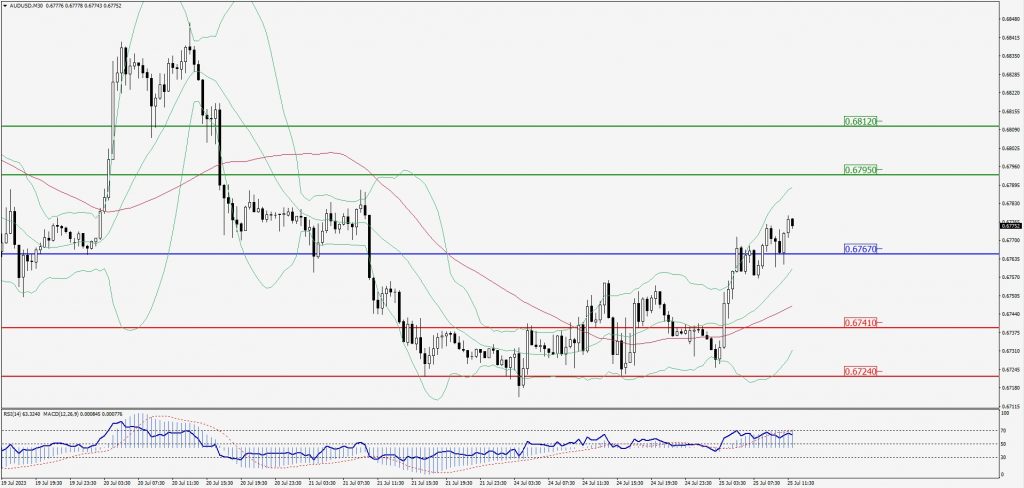
Green Lines Indicate Resistance Levels – Red Lines Indicate Support Levels
Light Blue is a Pivot Point – Black represents the price when the report was produced
CRUDEOIL Intraday: Trend on the downside
Our pivot point is at 78.96
Preferable Price Action: Below pivot sell oil with 78.05 & 77.43 as targets.
Alternative Price Action:Buy crude above pivot with targets at 79.77 and 80.45 in extension.
Comment: MACD is negative territory and Pairs below 20MA.
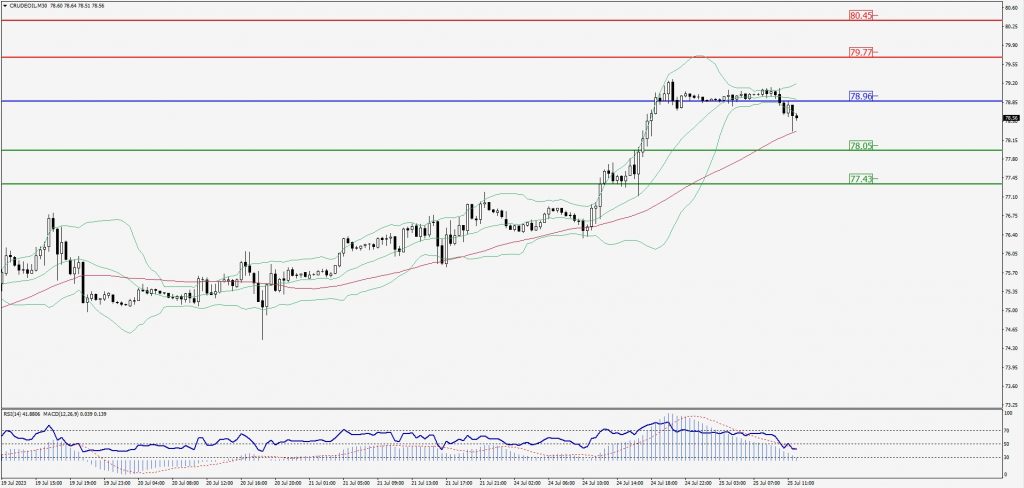
Green Lines Indicate Resistance Levels – Red Lines Indicate Support Levels
Light Blue is a Pivot Point – Black represents the price when the report was produced
XAU/USD Intraday: Trend on the upside
Our pivot point is 1961.00
Preferable Price Action: Further upside to 1968.80 and 1974.10.
Alternative Price Action: If the price gives a downside breakout of a pivot, then the price extends to 1954.20 and 1949.50.
Comment: MACD is above 50 level and Pairs above its 20MA & 55MA.
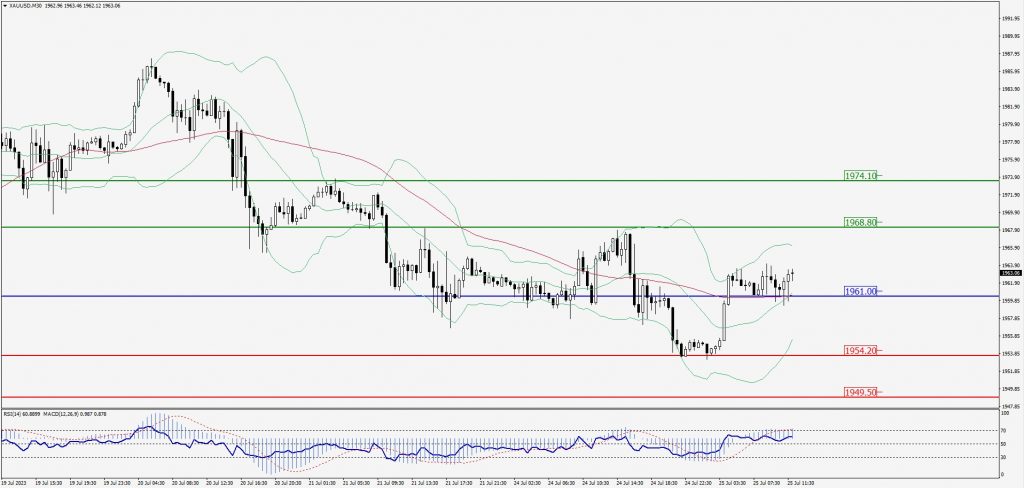
Green Lines Indicate Resistance Levels – Red Lines Indicate Support Levels
Light Blue is a Pivot Point – Black represents the price when the report was produced
Dow Jones Intraday: Trend on the upside
Our pivot point is 35,380.00
Preferable Price Action: Take buy positions above the pivot with targets at 35,484.00 & 35,567.00.
Alternative Price Action: Below 35,380.00 looks for further downside to 35,282.00 & 35,208.00.
Comment: RSI is above 50 levels and Pairs above 55MA.
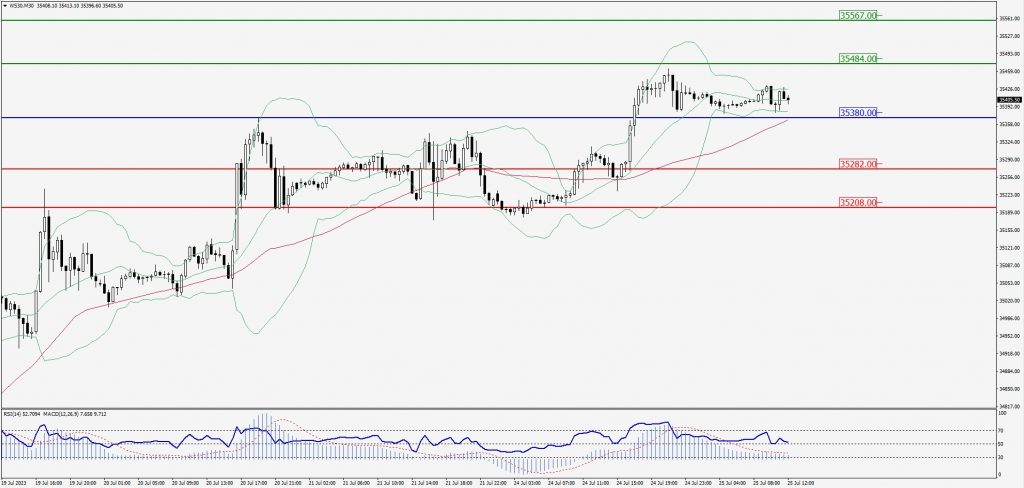
Green Lines Indicate Resistance Levels – Red Lines Indicate Support Levels
Light Blue is a Pivot Point – Black represents the price when the report was produced