Market Wrap: Stocks, Bonds, Commodities
S&P 500 futures were little changed in overnight trading after the Federal Reserve instituted a quarter percentage point hike, bringing rates to the highest level in more than 22 years.
The Dow Jones Industrial Average rose 82.05 points to 35,520.12, the S&P 500 lose 0.02% to 4,566.75 and the Nasdaq Composite subtract 17.27 points to 14,127.28.
MSCI’s index of Asia-Pacific stocks outside Japan is ascend 0.57% to 657.61 levels. The Australian index was higher by 0.73% to 7,455.90. Japanese Nikkei Index ascend 0.82% today.
European stocks were positive on Thursday, with the Stoxx Europe 50 Index rose 1.39% to 4,406.75, Germany’s DAX advance 0.88% to 16,273.45, and France’s CAC ascend 1.35% to 7,413.56 and U.K.’s FTSE 100 add 0.29% to 7,697.78.
Benchmark 10-year U.S. Treasury fell as demand for safe assets ascend again, today 10-year bond yields positive 0.62% to 3.8770.
Oil prices fell about 1 percent on Wednesday, after data showed U.S. crude inventories fell less than expected and the Federal Reserve raised interest rates by a quarter of a percentage point.
Spot Brent crude oil ascend 0.87% to $83.28 per barrel. US West Texas Intermediate crude is up 1.17% to $79.70 a barrel.
The yellow metal gold is advance 0.24% to 1,974.75 dollars per ounce.
Market Wrap: Forex
The U.S. dollar edged lower in early European trade Thursday, adding to the previous session’s losses in the wake of the Federal Reserve’s latest meeting, while the euro climbed ahead of the European Central Bank’s expected rate hike.
Today, the U.S. dollar index measures the Greenback against a trade-weighted basket of six major currencies, which slipped 0.16% to 100.470.
The Euro US Dollar (EUR/USD) is a widely traded pair that is up 0.41% today. This left the pair trading around $1.11280.
The Japanese yen was negative against the U.S. dollar on Thursday. Today USD/JPY is slipped 0.06% to the 140.130 level.
Another commodity-related currency positive against the U.S dollar, AUD/USD rose 0.60% to 0.67950, and NZD/USD surged 0.58% to 0.62460 level.
EUR/USD Intraday: Trend on the upside
Our pivot point is at 1.11020
Preferable Price Action: Take buy positions above pivot level with targets at 1.11270 & 1.11450 in extension.
Alternative Price Action: Below pivot looks for a further downside to 1.10800 & 1.10640.
Comment: RSI is above 50 levels and Pairs above its 20MA & 55MA.
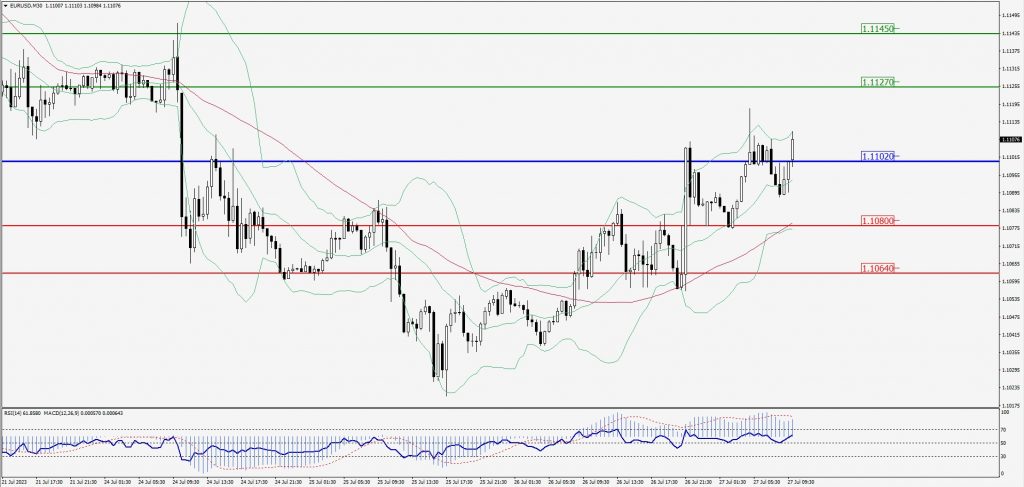
Green Lines Indicate Resistance Levels – Red Lines Indicate Support Levels
Light Blue is a Pivot Point – Black represents the price when the report was produced
GBP/USD Intraday: Trend on the upside
Our pivot point is at 1.29530
Preferable Price Action: Buy positions above pivot with targets at 1.30040 & 1.30390 in extension.
Alternative Price Action: The price below pivot would call for further downside to 1.29050 & 1.28740.
Comment: RSI is above 50 levels and Pairs above its 20MA & 55MA.
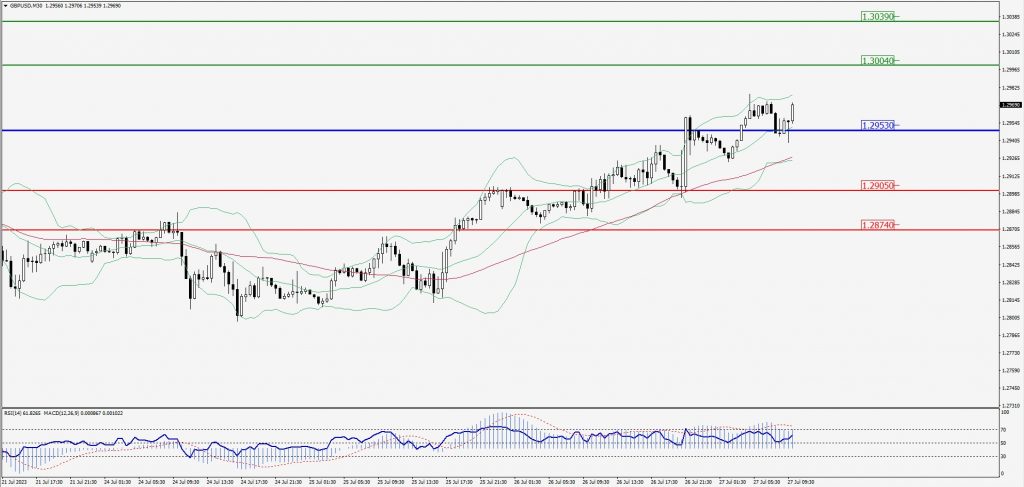
Green Lines Indicate Resistance Levels – Red Lines Indicate Support Levels
Light Blue is a Pivot Point – Black represents the price when the report was produced
USD/JPY Intraday: Resistance level at 140.230
Our pivot point is at 140.230
Preferable Price Action: Sell position below pivot with the target at 139.500 and 139.010 in extension.
Alternative Price Action: The upside breakout of the pivot would call for 140.860 and 141.350.
Comment: MACD is below 50 level and Pairs below its 20MA & 55MA.
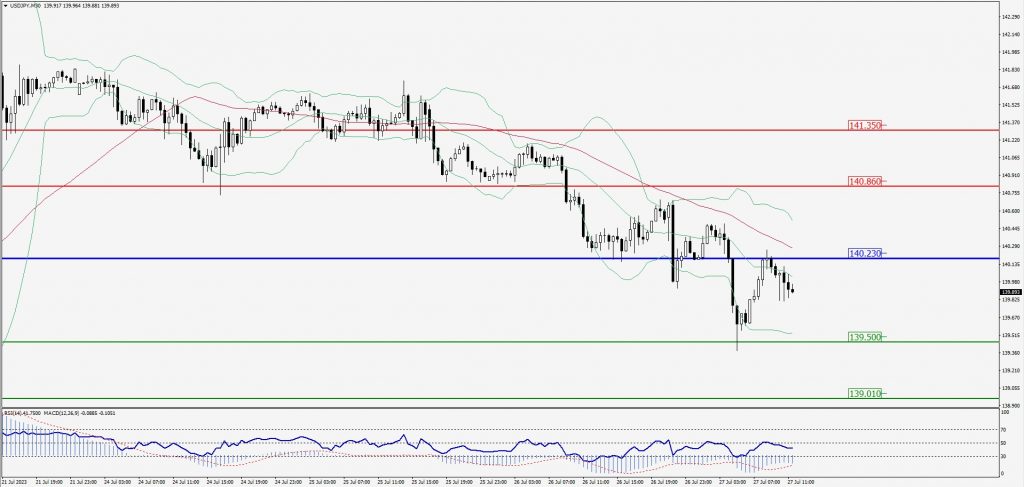
Green Lines Indicate Resistance Levels – Red Lines Indicate Support Levels
Light Blue is a Pivot Point – Black represents the price when the report was produced
AUD/USD Intraday: Trend on the upside
Our pivot point is at 0.68060
Preferable Price Action: Buy positions above pivot with targets at 0.68350 & 0.68540 in extension.
Alternative Price Action: Below pivot looks for a further downside with 0.67800 & 0.67620 as targets.
Comment: RSI is above 50 levels and Pairs above its 20AM & 55MA.
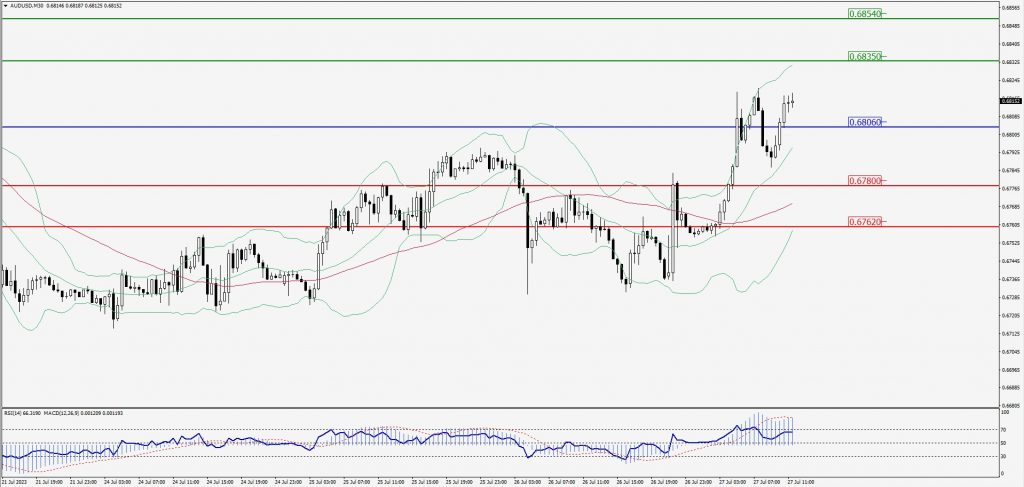
Green Lines Indicate Resistance Levels – Red Lines Indicate Support Levels
Light Blue is a Pivot Point – Black represents the price when the report was produced
CRUDEOIL Intraday: Support level at 79.25
Our pivot point is at 79.25
Preferable Price Action: Above pivot buy oil with 80.14 & 80.76 as targets.
Alternative Price Action:Sell crude below pivot with targets at 78.49 and 77.92 in extension.
Comment: MACD is positive territory and Pairs above 55MA.
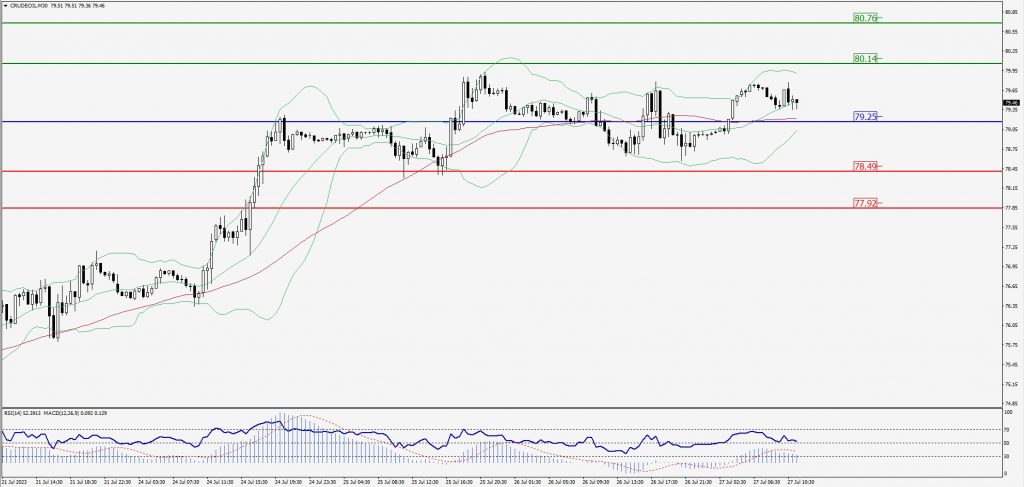
Green Lines Indicate Resistance Levels – Red Lines Indicate Support Levels
Light Blue is a Pivot Point – Black represents the price when the report was produced
XAU/USD Intraday: Trend on the upside
Our pivot point is 1974.20
Preferable Price Action: Further upside to 1981.50 and 1986.60.
Alternative Price Action: If the price gives a downside breakout of a pivot, then the price extends to 1967.80 and 1963.30.
Comment: MACD is above 50 level and Pairs above its 20MA & 55MA.
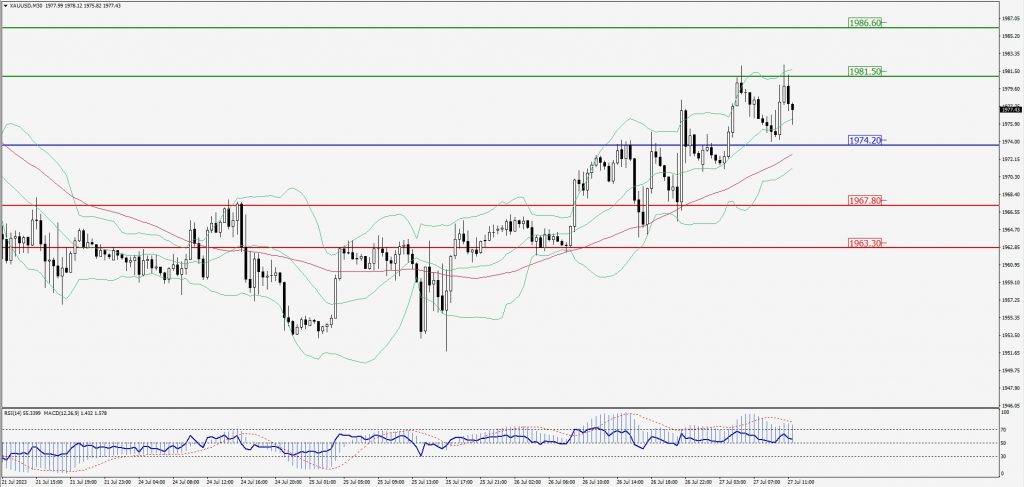
Green Lines Indicate Resistance Levels – Red Lines Indicate Support Levels
Light Blue is a Pivot Point – Black represents the price when the report was produced
Dow Jones Intraday: Major trend on the upside
Our pivot point is 35,559.00
Preferable Price Action: Take buy positions above the pivot with targets at 35,647.00 & 35,705.00.
Alternative Price Action: Below 35,559.00 looks for further downside to 35,481.00 & 35,420.00.
Comment: RSI is above 50 levels and Pairs above its 20MA & 55MA.
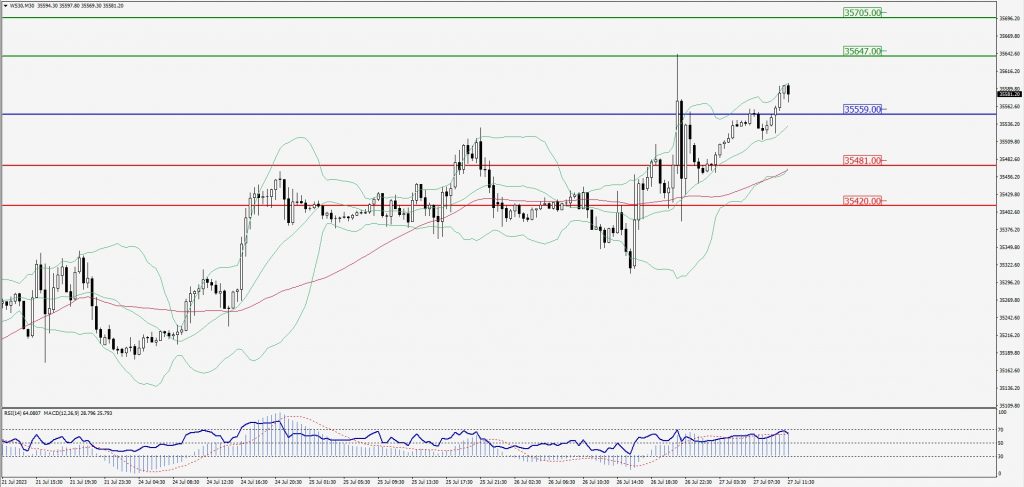
Green Lines Indicate Resistance Levels – Red Lines Indicate Support Levels
Light Blue is a Pivot Point – Black represents the price when the report was produced