Market Wrap: Stocks, Bonds, Commodities
US stocks traded in the green on Monday on expectations that corporate earnings will exceed forecasts, but global shares and the dollar traded little changed after data showed the Chinese economy grew slower than anticipated.
The Dow Jones Industrial Average rose 76.32 points to 34,585.35, the S&P 500 gain 0.39% to 4,522.79 and the Nasdaq Composite add 131.24 points to 14,244.95.
MSCI’s index of Asia-Pacific stocks outside Japan is decline 0.80% to 650.16 levels. The Australian index was lower by 0.20% to 7,283.80. Japanese Nikkei Index advance 0.32% today.
European stocks were positive on Tuesday, with the Stoxx Europe 50 Index rose 0.10% to 4,361.15, Germany’s DAX advance 0.07% to 16,079.15, and France’s CAC ascend 0.13% to 7,302.10 and U.K.’s FTSE 100 add 0.15% to 7,417.34.
Benchmark 10-year U.S. Treasury fell a0s demand for safe assets ascend again, today 10-year bond yields negative 0.93% to 3.7620.
Oil prices were little changed on Tuesday as investors weighed a possible tightening of U.S. crude supplies against weaker-than-expected Chinese economic growth.
Spot Brent crude oil ascend 0.13% to $78.60 per barrel. US West Texas Intermediate crude is up 0.23% to $74.27 a barrel.
The yellow metal gold is advance 0.45% to 1,965.85 dollars per ounce.
Market Wrap: Forex
The dollar dipped against a basket of currencies on Monday after last week suffering its largest weekly decline this year as Treasury yields tumbled, but held above more than one-year lows reached on Friday with no major catalysts to drive market direction.
Today, the U.S. dollar index measures the Greenback against a trade-weighted basket of six major currencies, which slipped 0.03% to 99.490.
The Euro US Dollar (EUR/USD) is a widely traded pair that is up 0.07% today. This left the pair trading around $1.12420.
The Japanese yen was negative against the U.S. dollar on Tuesday. Today USD/JPY is slipped 0.28% to the 138.320 level.
Another commodity-related currency negative against the U.S dollar, AUD/USD fell 0.12% to 0.68070, and NZD/USD slipped 0.48% to 0.62930 level.
EUR/USD Intraday: Trend on the upside
Our pivot point is at 1.12480
Preferable Price Action: Take buy positions above pivot level with targets at 1.12990 & 1.13340 in extension.
Alternative Price Action: Below pivot looks for a further downside to 1.12040 & 1.11710.
Comment: RSI is above 50 levels and Pairs above its 20MA & 55MA.
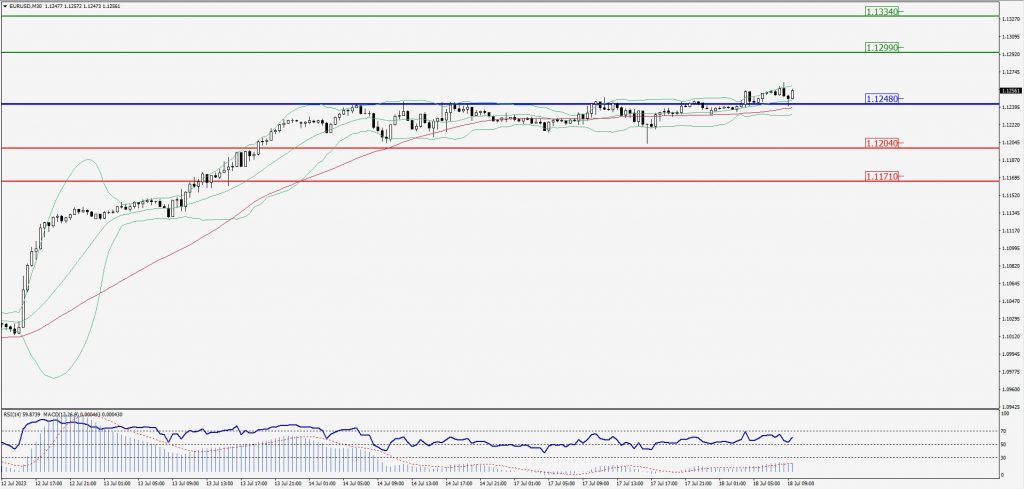
Green Lines Indicate Resistance Levels – Red Lines Indicate Support Levels
Light Blue is a Pivot Point – Black represents the price when the report was produced
GBP/USD Intraday: In a consolidation zone
Our pivot point is at 1.30740
Preferable Price Action: Buy positions above pivot with targets at 1.31220 & 1.31480 in extension.
Alternative Price Action: The price below pivot would call for further downside to 1.30360 & 1.30120.
Comment: RSI is at 50 levels and Pairs above 55MA.
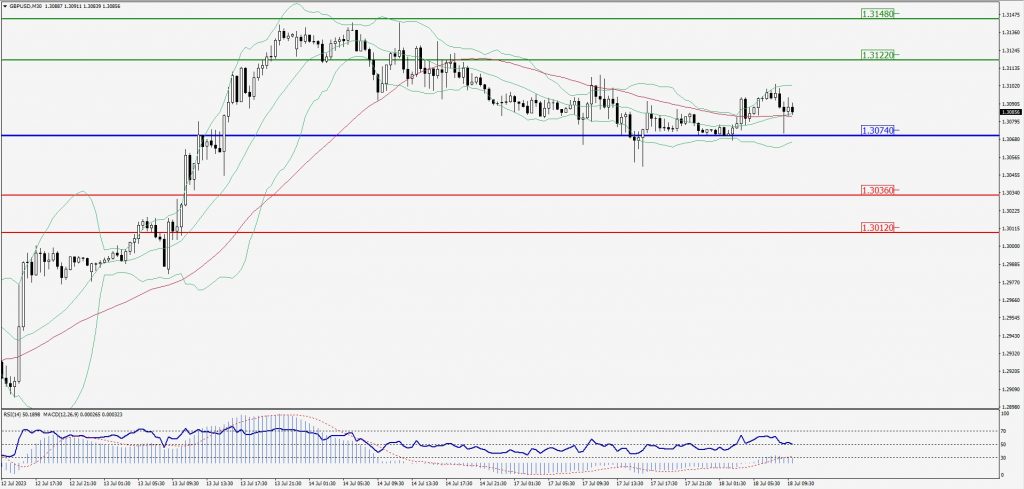
Green Lines Indicate Resistance Levels – Red Lines Indicate Support Levels
Light Blue is a Pivot Point – Black represents the price when the report was produced
USD/JPY Intraday: Trend on the downside
Our pivot point is at 138.540
Preferable Price Action: Sell position below pivot with the target at 138.060 and 137.710 in extension.
Alternative Price Action: The upside breakout of the pivot would call for 138.960 and 139.250.
Comment: MACD is below 50 level and Pairs below its 20MA & 55MA.
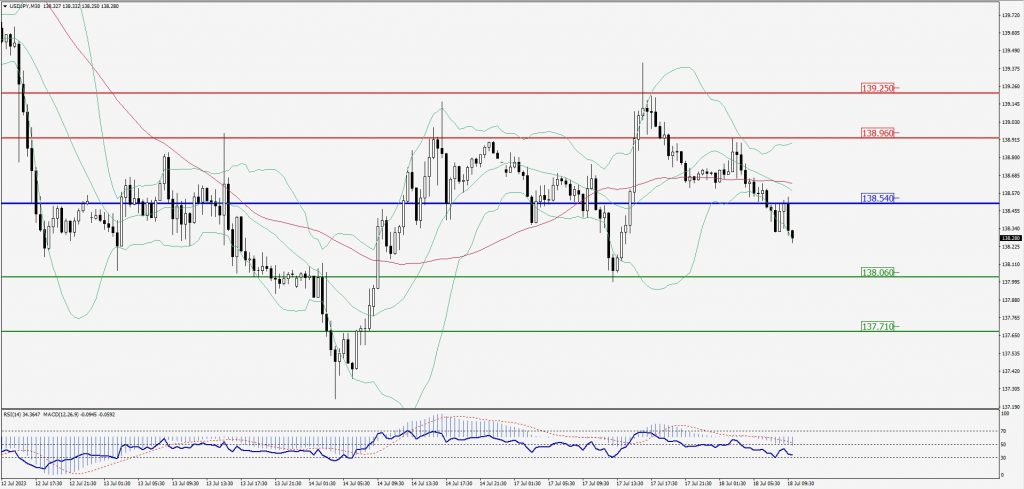
Green Lines Indicate Resistance Levels – Red Lines Indicate Support Levels
Light Blue is a Pivot Point – Black represents the price when the report was produced
AUD/USD Intraday: Support level at 0.68190
Our pivot point is at 0.68190
Preferable Price Action: Buy positions above pivot with targets at 0.68580 & 0.68870 in extension.
Alternative Price Action: Below pivot looks for a further downside with 0.67820 & 0.67580 as targets.
Comment: RSI is above 50 levels and Pairs above its 20MA & 55MA.
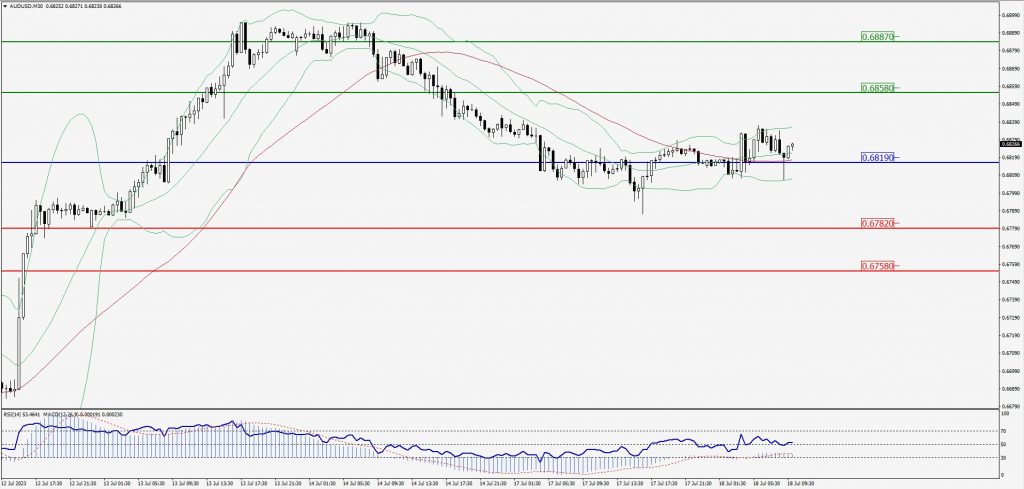
Green Lines Indicate Resistance Levels – Red Lines Indicate Support Levels
Light Blue is a Pivot Point – Black represents the price when the report was produced
CRUDEOIL Intraday: Trend on the downside
Our pivot point is at 74.38
Preferable Price Action: Below pivot sell oil with 73.41 & 72.77 as targets.
Alternative Price Action: Buy crude above pivot with targets at 75.23 and 75.95 in extension.
Comment: MACD is negative territory and Pairs below its 20MA & 55MA.
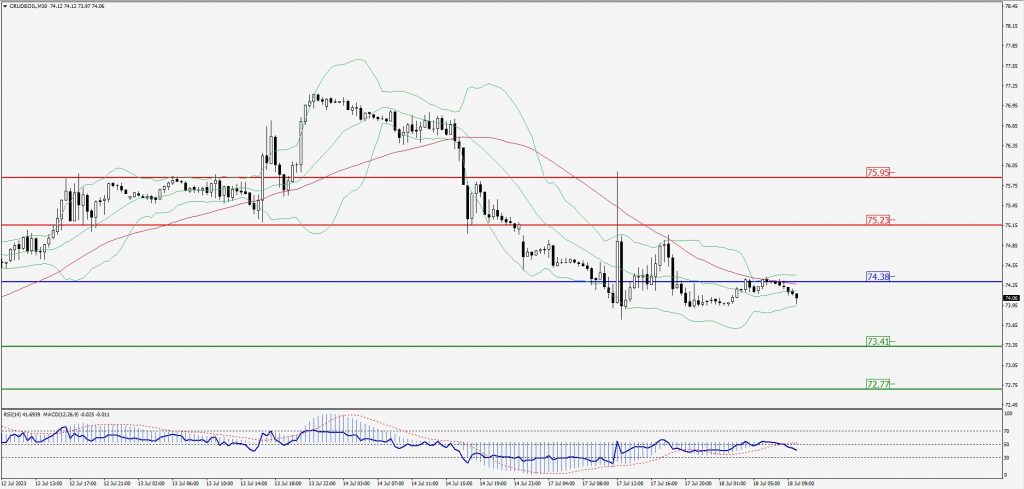
Green Lines Indicate Resistance Levels – Red Lines Indicate Support Levels
Light Blue is a Pivot Point – Black represents the price when the report was produced
XAU/USD Intraday: Trend on the upside
Our pivot point is 1959.50
Preferable Price Action: Further upside to 1965.70 and 1969.80.
Alternative Price Action: If the price gives a downside breakout of a pivot, then the price extends to 1954.40 and 1950.50.
Comment: MACD is above 50 level and Pairs above its 20MA & 55MA.
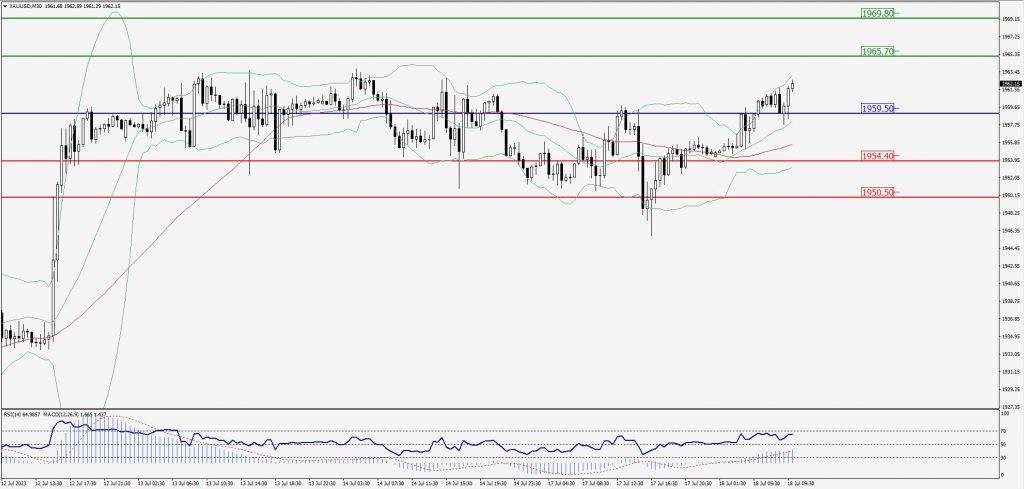
Green Lines Indicate Resistance Levels – Red Lines Indicate Support Levels
Light Blue is a Pivot Point – Black represents the price when the report was produced
Dow Jones Intraday: Trend 0n the upside
Our pivot point is 34,562.00
Preferable Price Action: Take buy positions above the pivot with targets at 34,650.00 & 34,706.00.
Alternative Price Action: Below 34,562.00 looks for further downside to 34,486.00 & 34,431.00.
Comment: RSI is above 50 levels and Pairs above 55MA.
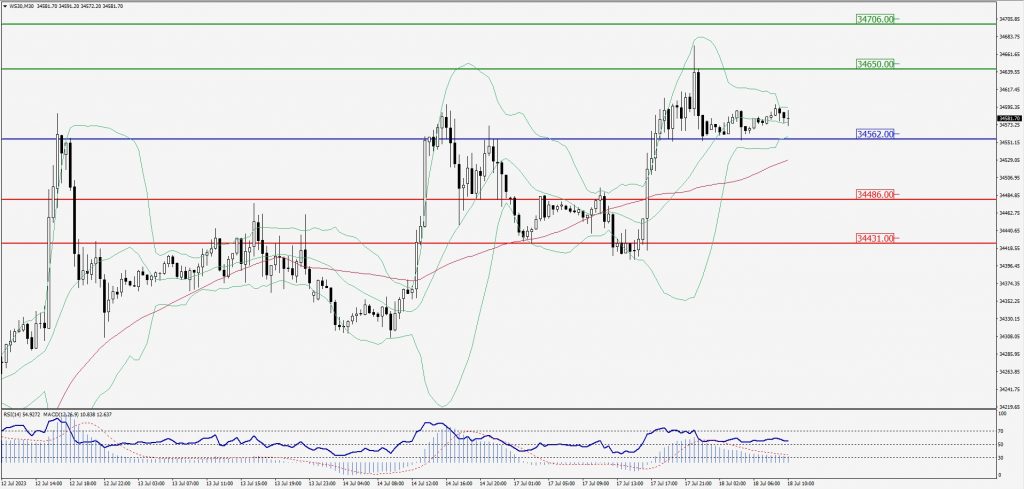
Green Lines Indicate Resistance Levels – Red Lines Indicate Support Levels
Light Blue is a Pivot Point – Black represents the price when the report was produced