Market Wrap: Stocks, Bonds, Commodities
US stocks advanced on Tuesday, partly boosted by a round of solid bank earnings which helped put the Dow on track for its longest streak of daily gains in more than two years.
The Dow Jones Industrial Average rose 366.58 points to 34,951.93, the S&P 500 gain 0.71% to 4,554.98 and the Nasdaq Composite add 108.69 points to 14,353.64.
MSCI’s index of Asia-Pacific stocks outside Japan is decline 0.25% to 648.09 levels. The Australian index was higher by 0.55% to 7,323.70. Japanese Nikkei Index advance 1.24% today.
European stocks were positive on Wednesday, with the Stoxx Europe 50 Index rose 0.33% to 4,383.95, Germany’s DAX advance 0.22% to 16,162.55, and France’s CAC ascend 0.37% to 7,346.33 and U.K.’s FTSE 100 add 1.28% to 7,548.94.
Benchmark 10-year U.S. Treasury fell as demand for safe assets ascend again, today 10-year bond yields negative 1.27% to 3.7420.
Global oil prices rose on Wednesday, boosted by China’s pledge to support economic growth, tighter supply from Russia and on lower weekly U.S. crude oil inventories.
Spot Brent crude oil drop 0.16% to $79.50 per barrel. US West Texas Intermediate crude is down 0.29% to $75.42 a barrel.
The yellow metal gold is advance 0.09% to 1,982.65 dollars per ounce.
Market Wrap: Forex
The U.S. dollar rose from a 15-month low against a basket of currencies on Tuesday after core retail sales saw strong gains in June, as investors wait on the Federal Reserve’s interest rate decision next week.
Today, the U.S. dollar index measures the Greenback against a trade-weighted basket of six major currencies, which surged 0.15% to 99.770.
The Euro US Dollar (EUR/USD) is a widely traded pair that is up 0.05% today. This left the pair trading around $1.12320.
The Japanese yen was negative against the U.S. dollar on Wednesday. Today USD/JPY is surged 0.41% to the 139.370 level.
Another commodity-related currency negative against the U.S dollar, AUD/USD fell 0.40% to 0.67860, and NZD/USD slipped 0.26% to 0.62550 level.
EUR/USD Intraday: Trend on the downside
Our pivot point is at 1.12160
Preferable Price Action: Take sell positions below pivot level with targets at 1.11900 & 1.11730 in extension.
Alternative Price Action: Above pivot looks for a further upside to 1.12380 & 1.12540.
Comment: RSI is below 50 levels and Pairs below its 20MA & 55MA.
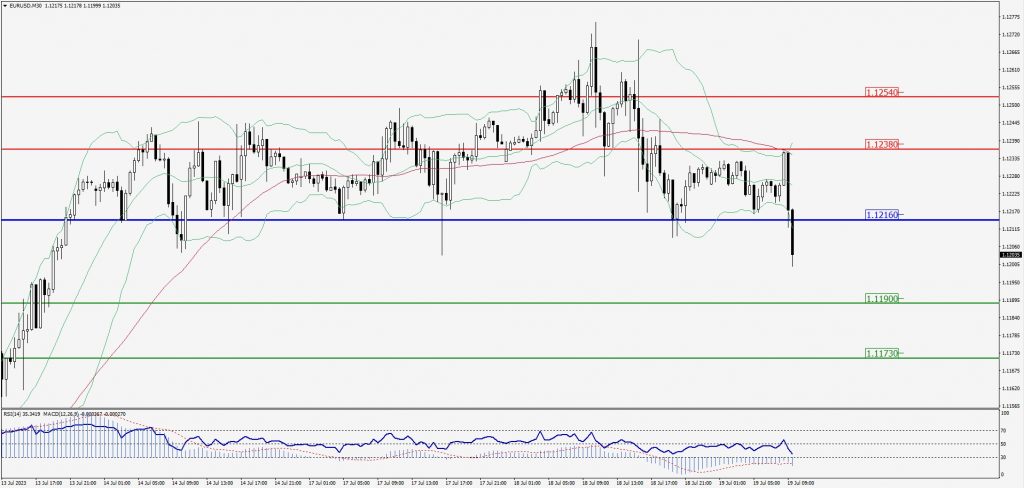
Green Lines Indicate Resistance Levels – Red Lines Indicate Support Levels
Light Blue is a Pivot Point – Black represents the price when the report was produced
GBP/USD Intraday: Major trend on the downside
Our pivot point is at 1.29730
Preferable Price Action: Sell positions below pivot with targets at 1.29030 & 1.28490 in extension.
Alternative Price Action: The price above pivot would call for further upside to 1.30390 & 1.30930.
Comment: RSI is below 50 levels and Pairs below its 20MA & 55MA.
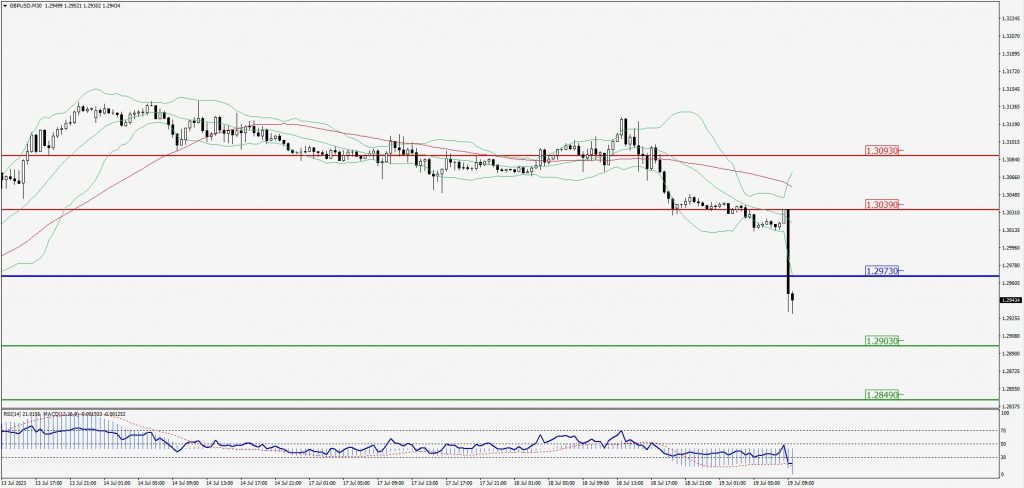
Green Lines Indicate Resistance Levels – Red Lines Indicate Support Levels
Light Blue is a Pivot Point – Black represents the price when the report was produced
USD/JPY Intraday: Major trend on the upside
Our pivot point is at 139.350
Preferable Price Action: Buy position above pivot with the target at 140.060 and 140.560 in extension.
Alternative Price Action: The downside breakout of the pivot would call for 138.720 and 138.270.
Comment: MACD is above 50 level and Pairs above its 20MA & 55MA.
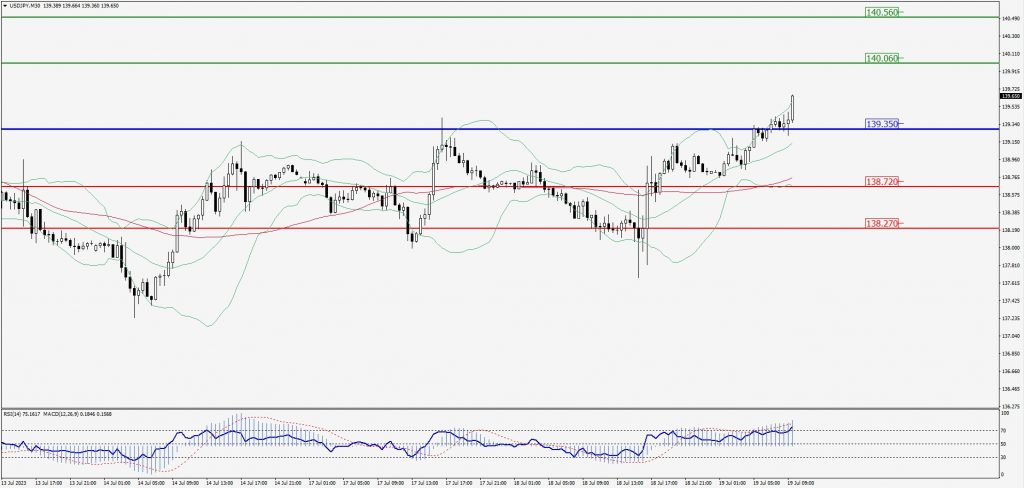
Green Lines Indicate Resistance Levels – Red Lines Indicate Support Levels
Light Blue is a Pivot Point – Black represents the price when the report was produced
AUD/USD Intraday: Trend on the downside
Our pivot point is at 0.67900
Preferable Price Action: Sell positions below pivot with targets at 0.67510 & 0.67270 in extension.
Alternative Price Action: Above pivot looks for a further upside with 0.68240 & 0.68520 as targets.
Comment: RSI is below 50 levels and Pairs below its 20MA & 55MA.
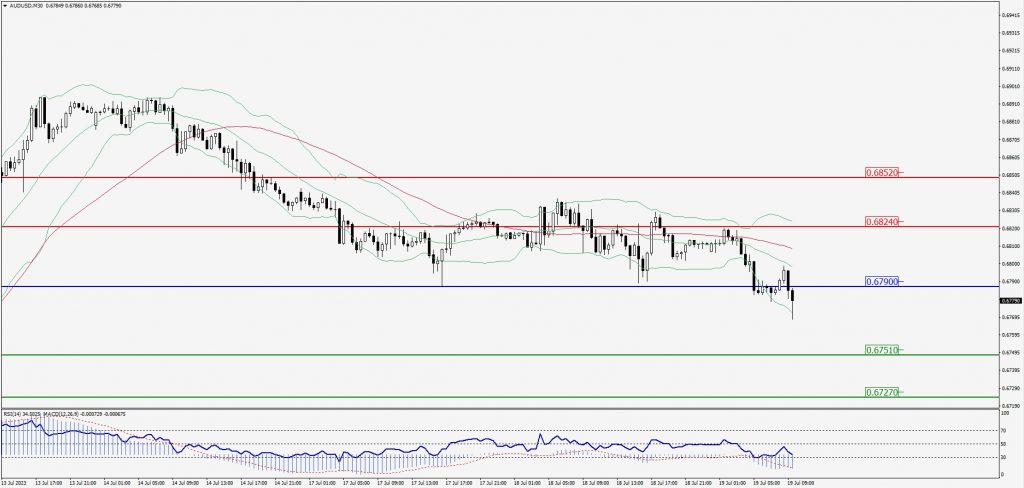
Green Lines Indicate Resistance Levels – Red Lines Indicate Support Levels
Light Blue is a Pivot Point – Black represents the price when the report was produced
CRUDEOIL Intraday: Support level at 75.30
Our pivot point is at 75.30
Preferable Price Action: Above pivot buy oil with 76.08 & 76.62 as targets.
Alternative Price Action: Sell crude below pivot with targets at 74.62 and 74.13 in extension.
Comment: MACD is positive territory and Pairs above 55MA.
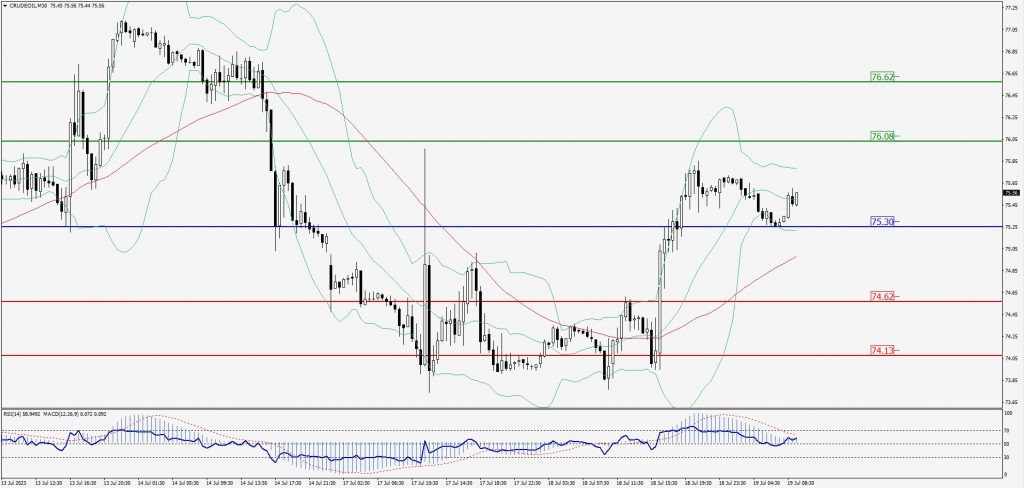
Green Lines Indicate Resistance Levels – Red Lines Indicate Support Levels
Light Blue is a Pivot Point – Black represents the price when the report was produced
XAU/USD Intraday: In a consolidation zone
Our pivot point is 1974.30
Preferable Price Action: Further upside to 1980.50 and 1985.10.
Alternative Price Action: If the price gives a downside breakout of a pivot, then the price extends to 1968.90 and 1965.00.
Comment: MACD is at 50 level and Pairs above 55MA.
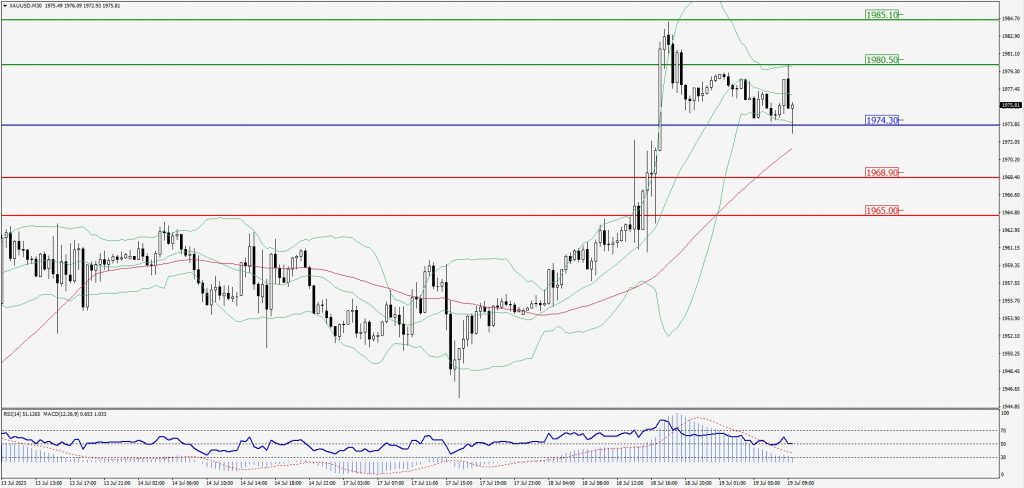
Green Lines Indicate Resistance Levels – Red Lines Indicate Support Levels
Light Blue is a Pivot Point – Black represents the price when the report was produced
Dow Jones Intraday: Trend 0n the upside
Our pivot point is 34,950.00
Preferable Price Action: Take buy positions above the pivot with targets at 35,108.00 & 35,207.00.
Alternative Price Action: Below 34,950.00 looks for further downside to 34,820.00 & 34,734.00.
Comment: RSI is above 50 levels and Pairs above its 20MA & 55MA.
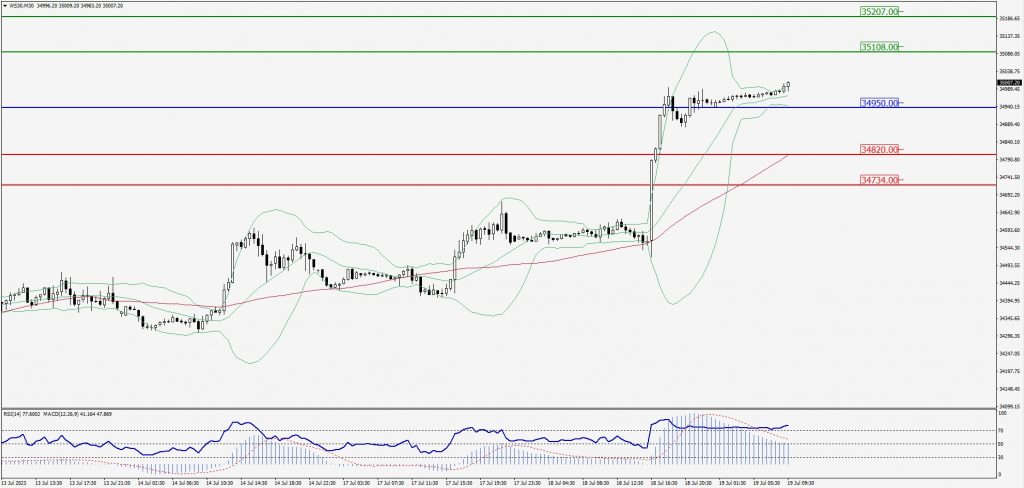
Green Lines Indicate Resistance Levels – Red Lines Indicate Support Levels
Light Blue is a Pivot Point – Black represents the price when the report was produced