Market Wrap: Stocks, Bonds, Commodities
The S&P 500 and the Nasdaq closed higher on Thursday as U.S. Federal Reserve Chairman Jerome Powell continued to beat a hawkish drum and suggested the central bank has not reached the end of its tightening cycle, but provided reassurance that the Fed would proceed with caution.
The Dow Jones Industrial Average fell 4.81 points to 33,946.71, the S&P 500 gain 0.37% to 4,381.89 and the Nasdaq Composite add 128.41 points to 13,630.61.
MSCI’s index of Asia-Pacific stocks outside Japan is decline 1.09% to 632.02 levels. The Australian index was lower by 1.34% to 7,099.20. Japanese Nikkei Index decline 1.45% today.
European stocks were negative on Friday, with the Stoxx Europe 50 Index fell 0.38% to 4,288.25, Germany’s DAX decline 0.58% to 15,896.25, and France’s CAC drop 0.20% to 7,188.89 and U.K.’s FTSE 100 subtract 0.15% to 7,490.81.
Benchmark 10-year U.S. Treasury fell as demand for safe assets ascend again, today 10-year bond yields negative 1.54% to 3.7400.
Oil futures fell about 4 percent on Thursday, as a bigger-than-expected Bank of England rate hike prompted worries about the economy and fuel demand that outweighed support from a surprise draw in US oil supplies.
Spot Brent crude oil drop 1.67% to $72.91 per barrel. US West Texas Intermediate crude is down 1.84% to $68.22 a barrel.
The yellow metal gold is advance 0.20% to 1,927.75 dollars per ounce.
Market Wrap: Forex
The U.S. dollar gained in early European trade Friday, as more aggressive monetary tightening by a series of central banks, including the Bank of England, prompted a bout of risk aversion.
Today, the U.S. dollar index measures the Greenback against a trade-weighted basket of six major currencies, which surged 0.76% to 102.760.
The Euro US Dollar (EUR/USD) is a widely traded pair that is down 1.01% today. This left the pair trading around $1.08470.
The Japanese yen was negative against the U.S. dollar on Friday. Today USD/JPY is surged 0.03% to the 143.160 level.
Another commodity-related currency negative against the U.S dollar, AUD/USD fell 1.01% to 0.66880, and NZD/USD slipped 0.78% to 0.61300 level.
EUR/USD Intraday: Major trend on the downside
Our pivot point is at 1.08840
Preferable Price Action: Take sell positions below pivot level with targets at 1.08500 & 1.08250 in extension.
Alternative Price Action: Above pivot looks for a further upside to 1.09140 & 1.09400.
Comment: RSI is below 50 levels and Pairs below its 20MA & 55MA.
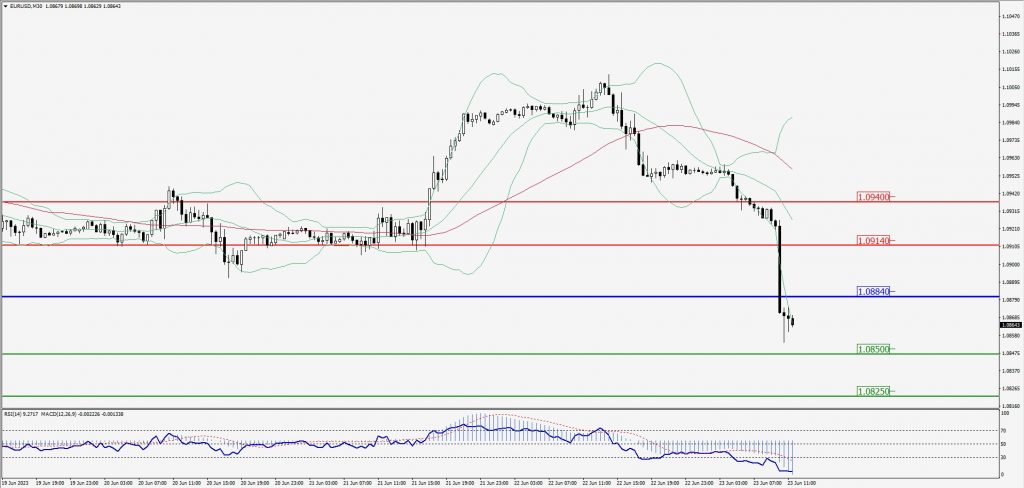
Green Lines Indicate Resistance Levels – Red Lines Indicate Support Levels
Light Blue is a Pivot Point – Black represents the price when the report was produced
GBP/USD Intraday: Trend on the downside
Our pivot point is at 1.27220
Preferable Price Action: Sell positions below pivot with targets at 1.26950 & 1.26740 in extension.
Alternative Price Action: The price above pivot would call for further upside to 1.27470 & 1.27680.
Comment: RSI is below 50 levels and Pairs below its 20MA & 55MA.
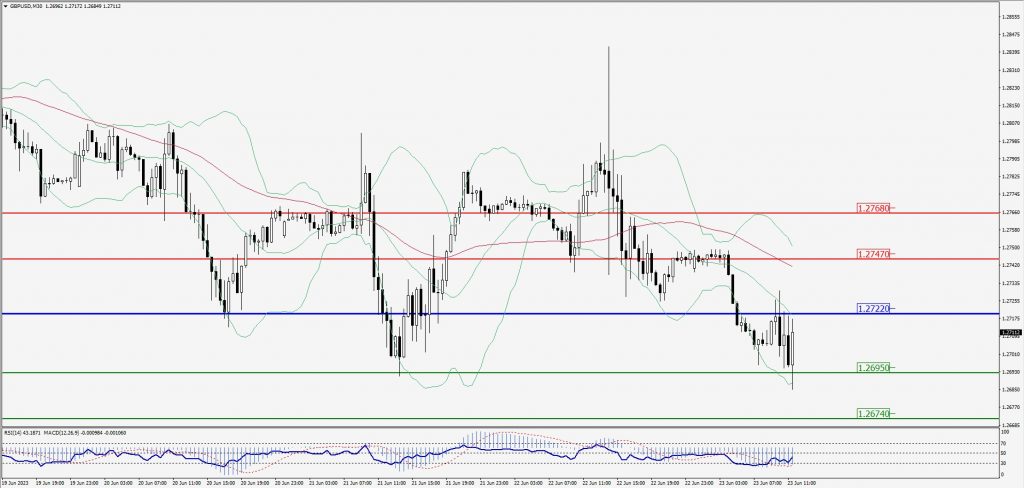
Green Lines Indicate Resistance Levels – Red Lines Indicate Support Levels
Light Blue is a Pivot Point – Black represents the price when the report was produced
USD/JPY Intraday: In a consolidation zone
Our pivot point is at 143.140
Preferable Price Action: Sell position below pivot with the target at 142.740 and 142.470 in extension.
Alternative Price Action: The upside breakout of the pivot would call for 143.510 and 143.790.
Comment: MACD is at 50 level and Pairs below 20MA.
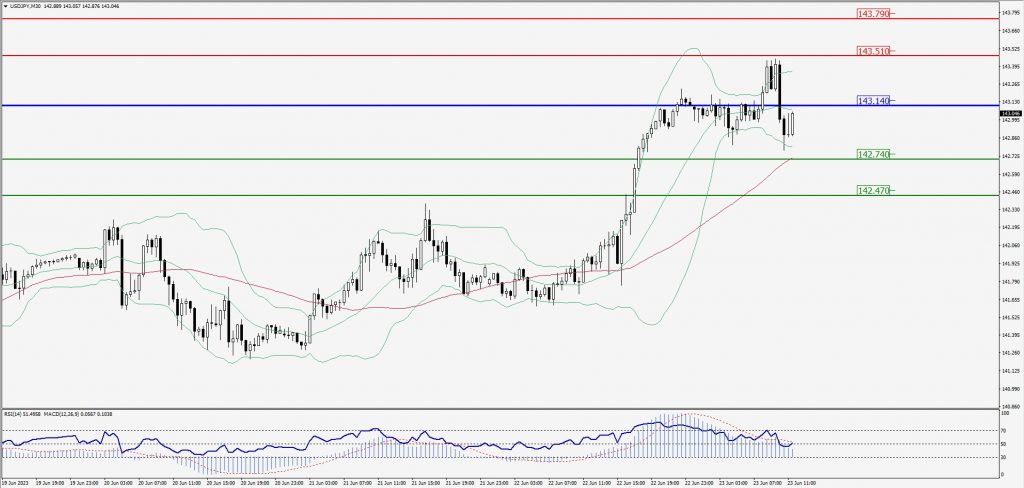
Green Lines Indicate Resistance Levels – Red Lines Indicate Support Levels
Light Blue is a Pivot Point – Black represents the price when the report was produced
AUD/USD Intraday: Major trend on the downside
Our pivot point is at 0.67110
Preferable Price Action: Sell positions below pivot with targets at 0.66740 & 0.66490 in extension.
Alternative Price Action: Above pivot looks for a further upside with 0.67390 & 0.67650 as targets.
Comment: RSI is below 50 levels and Pairs below its 20MA & 55MA.
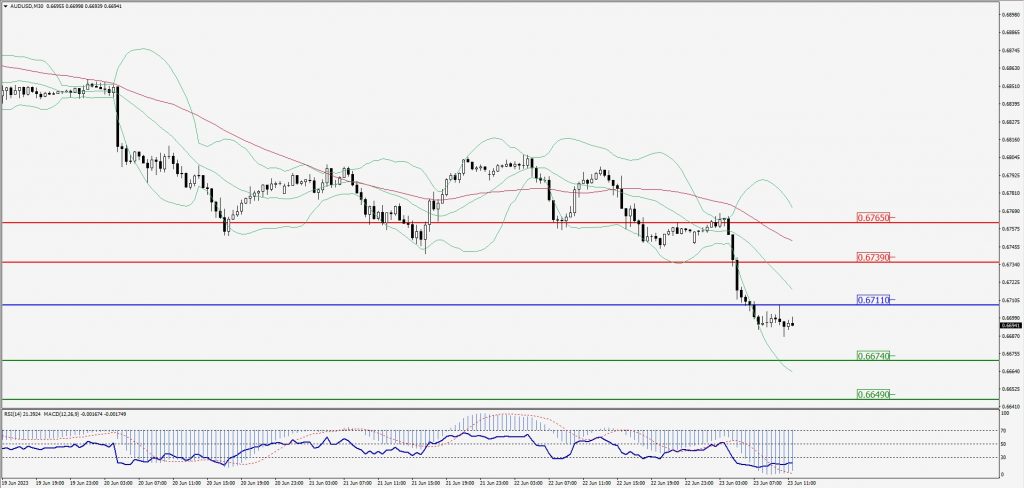
Green Lines Indicate Resistance Levels – Red Lines Indicate Support Levels
Light Blue is a Pivot Point – Black represents the price when the report was produced
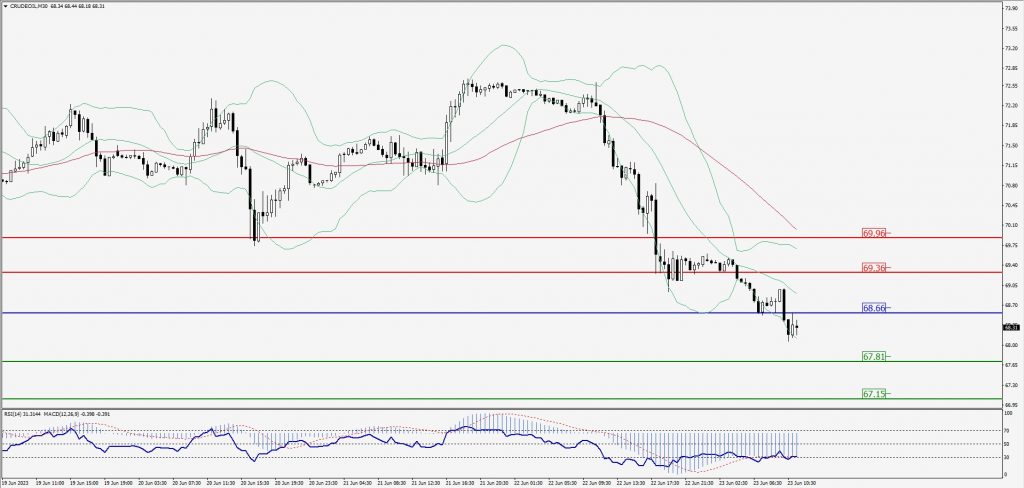
CRUDEOIL Intraday: Trend on the downside
Our pivot point is at 68.66
Preferable Price Action: Below pivot sell oil with 67.81 & 67.15 as targets.
Alternative Price Action: Buy crude above pivot with targets at 69.36 and 69.96 in extension.
Comment: MACD is negative territory and Pairs below its 20MA & 55MA.
Green Lines Indicate Resistance Levels – Red Lines Indicate Support Levels
Light Blue is a Pivot Point – Black represents the price when the report was produced
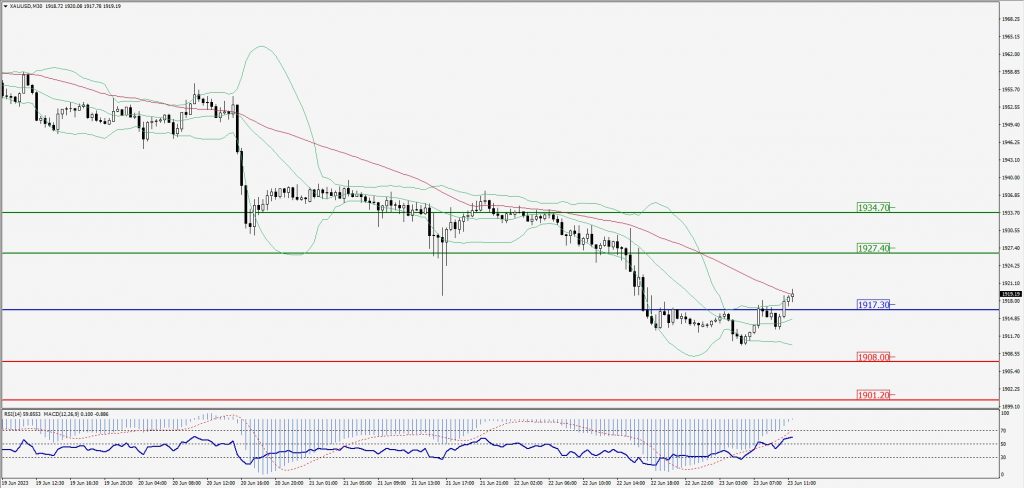
XAU/USD Intraday: Trend on the upside
Our pivot point is 1917.30
Preferable Price Action: Further upside to 1927.40 and 1934.70
Alternative Price Action: If the price gives a downside breakout of a pivot, then the price extends to 1908.00 and 1901.20.
Comment: MACD is above 50 level and Pairs above 20MA.
Green Lines Indicate Resistance Levels – Red Lines Indicate Support Levels
Light Blue is a Pivot Point – Black represents the price when the report was produced
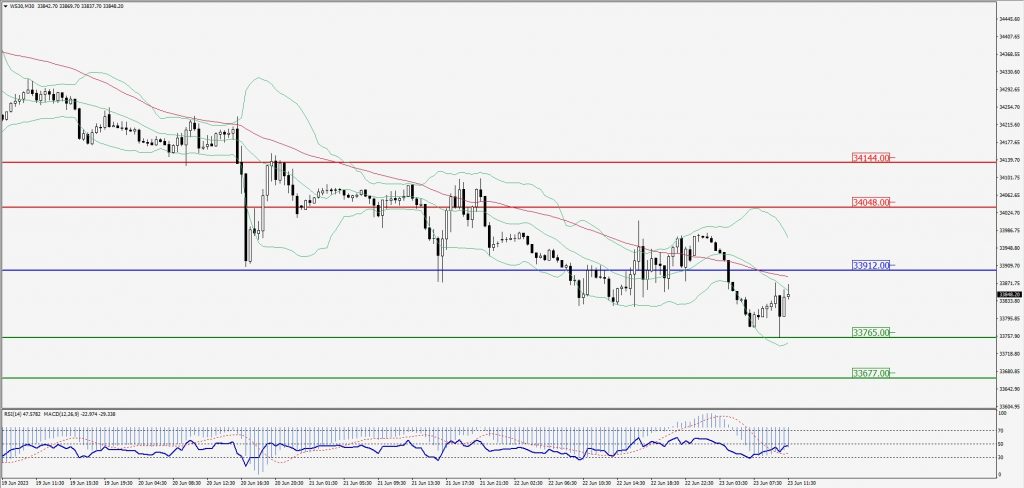
Dow Jones Intraday: Trend on the downside
Our pivot point is 33,912.00
Preferable Price Action: Take sell positions below the pivot with targets at 33,765.00 & 33,677.00.
Alternative Price Action: Above 33,912.00 looks for further upside to 34,048.00 & 34,144.00.
Comment: RSI is below 50 levels and Pairs below its 20MA & 55MA.
Green Lines Indicate Resistance Levels – Red Lines Indicate Support Levels
Light Blue is a Pivot Point – Black represents the price when the report was produced