Market Wrap: Stocks, Bonds, Commodities
S&P 500 futures were little changed Sunday night as traders looked ahead to the latest inflation data and the Federal Reserve policy meeting this week.
The Dow Jones Industrial Average rose 43.17 points to 33,876.78, the S&P 500 gain 0.11% to 4,298.86 and the Nasdaq Composite add 20.62 points to 13,259.14.
MSCI’s index of Asia-Pacific stocks outside Japan is advance 0.22% to 642.28 levels. The Australian index was higher by 0.32% to 7,122.50. Japanese Nikkei Index advance 0.52% today.
European stocks were positive on Monday, with the Stoxx Europe 50 Index rose 0.87% to 4,326.95, Germany’s DAX advance 1.03% to 16,114.75, and France’s CAC ascend 0.82% to 7,271.95 and U.K.’s FTSE 100 add 0.26% to 7,581.85.
Benchmark 10-year U.S. Treasury fell as demand for safe assets ascend again, today 10-year bond yields positive 0.32% to 3.7560.
Oil prices fell more than a dollar a barrel on Friday to record a second straight weekly decline, as disappointing Chinese data added to doubts about demand growth after Saudi Arabia’s weekend decision to cut output.
Spot Brent crude oil drop 2.29% to $73.11 per barrel. US West Texas Intermediate crude is down 2.54% to $68.36 a barrel.
The yellow metal gold is advance 0.10% to 1,979.10 dollars per ounce.
Market Wrap: Forex
The U.S. dollar traded largely unchanged Monday in the early European session, near multi-week lows as traders seem reluctant to take news positions at the start of a week that includes a policy-setting meeting by the Federal Reserve.
Today, the U.S. dollar index measures the Greenback against a trade-weighted basket of six major currencies, which slipped 0.24% to 102.900.
The Euro US Dollar (EUR/USD) is a widely traded pair that is up 0.26% today. This left the pair trading around $1.07770.
The Japanese yen was negative against the U.S. dollar on Monday. Today USD/JPY is slipped 0.08% to the 139.210 level.
Another commodity-related currency positive against the U.S dollar, AUD/USD rose 0.50% to 0.67720, and NZD/USD surged 0.44% to 0.61490 level.
EUR/USD Intraday: Trend on the upside
Our pivot point is at 1.07430
Preferable Price Action: Take buy positions above pivot level with targets at 1.07730 & 1.07960 in extension.
Alternative Price Action: Below pivot looks for a further downside to 1.07160 & 1.06970.
Comment: RSI is above 50 levels and Pairs above 20MA.
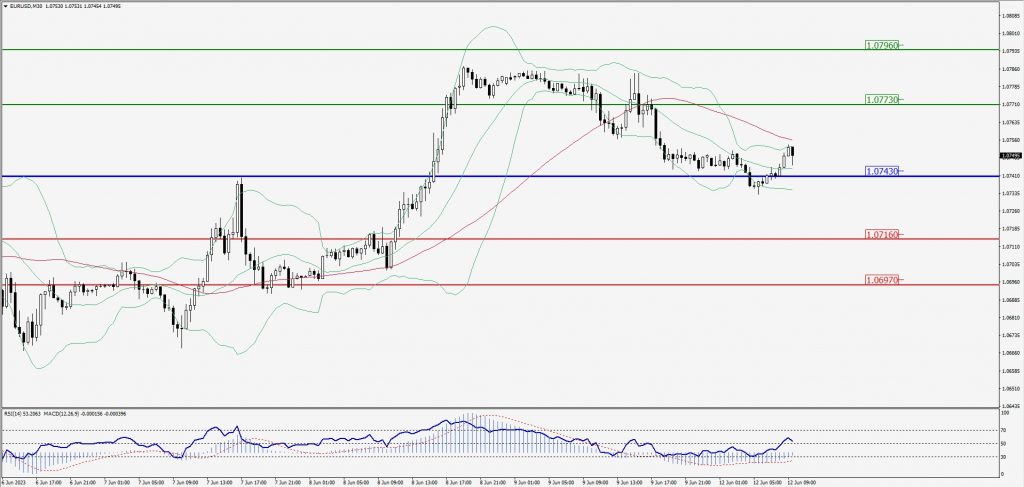
Green Lines Indicate Resistance Levels – Red Lines Indicate Support Levels
Light Blue is a Pivot Point – Black represents the price when the report was produced
GBP/USD Intraday: Support level at 1.25670
Our pivot point is at 1.25670
Preferable Price Action: Buy positions above pivot with targets at 1.26180 & 1.26500 in extension.
Alternative Price Action: The price below pivot would call for further downside to 1.25210 & 1.24840.
Comment: RSI is above 50 levels and Pairs above 55MA.
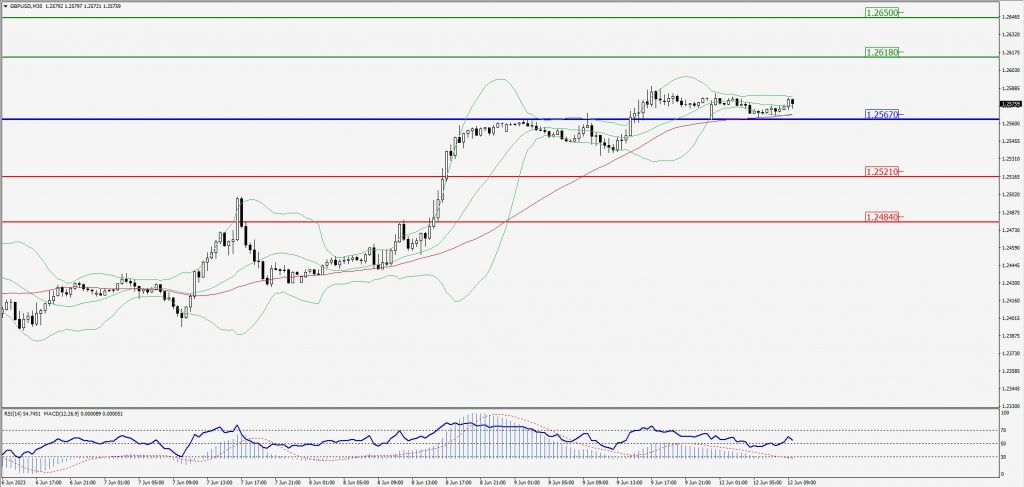
Green Lines Indicate Resistance Levels – Red Lines Indicate Support Levels
Light Blue is a Pivot Point – Black represents the price when the report was produced
USD/JPY Intraday: Trend on the upside
Our pivot point is at 139.450
Preferable Price Action: Buy position above pivot with the target at 139.810 and 140.050 in extension.
Alternative Price Action: The downside breakout of the pivot would call for 139.160 and 138.940.
Comment: MACD is above 50 level and Pairs above its 20MA & 55MA.
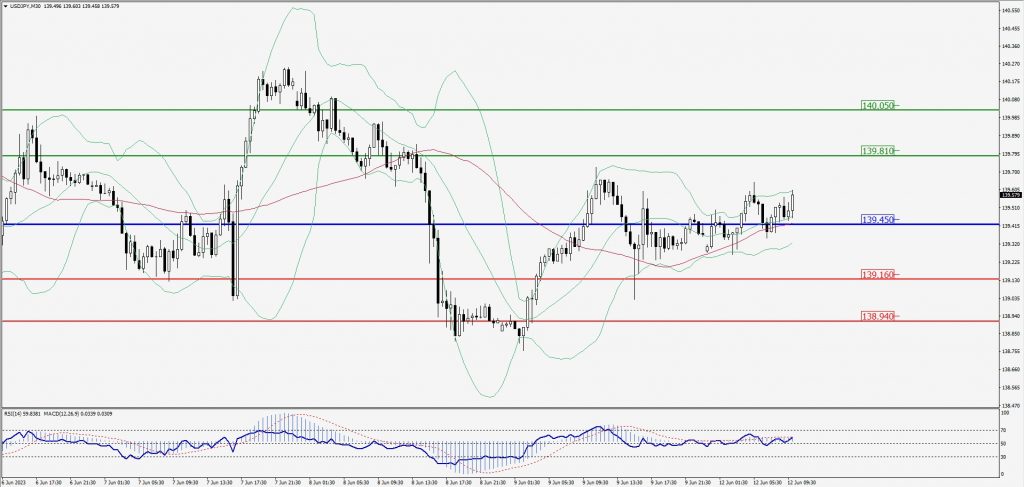
Green Lines Indicate Resistance Levels – Red Lines Indicate Support Levels
Light Blue is a Pivot Point – Black represents the price when the report was produced
AUD/USD Intraday: Trend on the upside
Our pivot point is at 0.67380
Preferable Price Action: Buy positions above pivot with targets at 0.67660 & 0.67860 in extension.
Alternative Price Action: Below pivot looks for a further downside with 0.67130 & 0.66950 as targets.
Comment: RSI is above 50 levels and Pairs above its 20MA & 55MA.
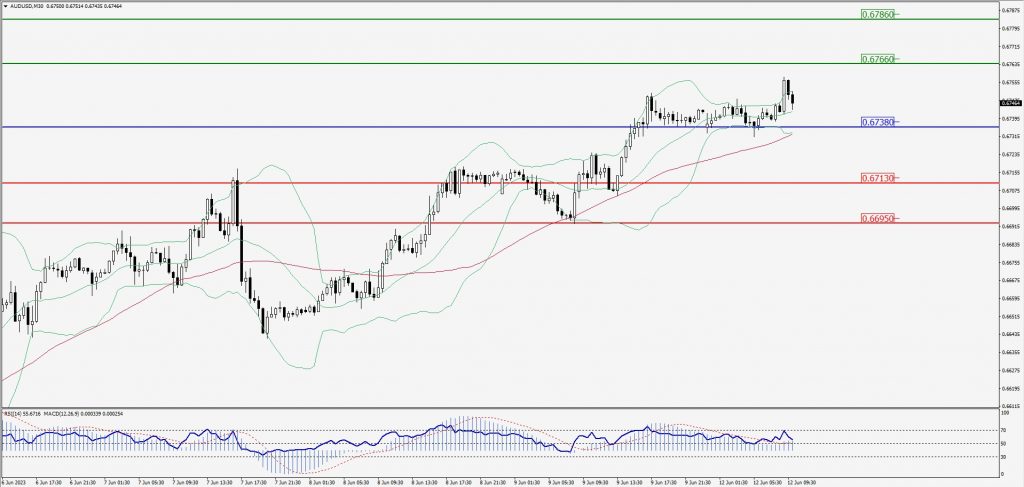
Green Lines Indicate Resistance Levels – Red Lines Indicate Support Levels
Light Blue is a Pivot Point – Black represents the price when the report was produced
CRUDEOIL Intraday: Major trend on the downside
Our pivot point is at 69.72
Preferable Price Action: Below pivot sell oil with 68.34 & 67.45 as targets.
Alternative Price Action: Buy crude above pivot with targets at 70.94 and 72.01 in extension.
Comment: MACD is negative territory and Pairs below its 20MA & 55MA.
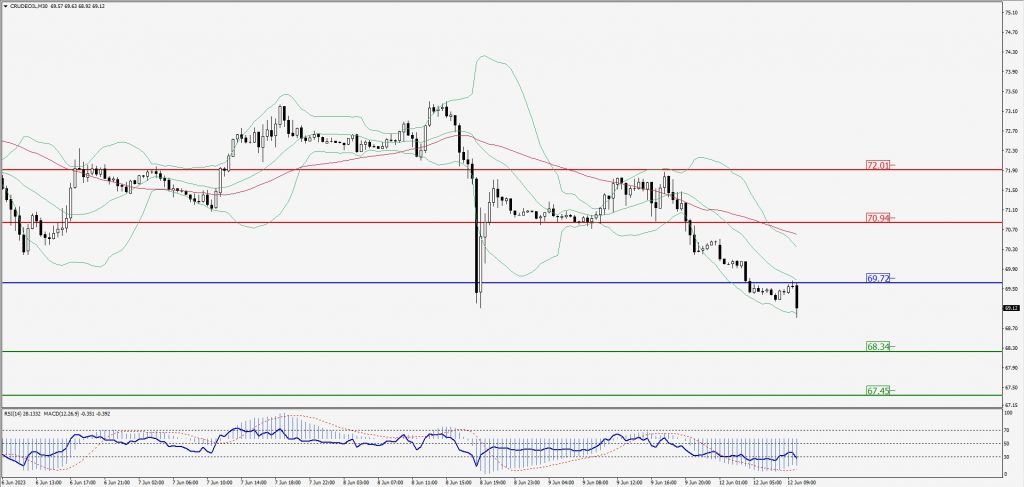
Green Lines Indicate Resistance Levels – Red Lines Indicate Support Levels
Light Blue is a Pivot Point – Black represents the price when the report was produced
XAU/USD Intraday: Trend on the upside
Our pivot point is 1957.40
Preferable Price Action: Further upside to 1965.10 and 1970.20
Alternative Price Action: If the price gives a downside breakout of a pivot, then the price extends to 1950.90 and 1945.80.
Comment: MACD is above 50 level and Pairs above 20MA.
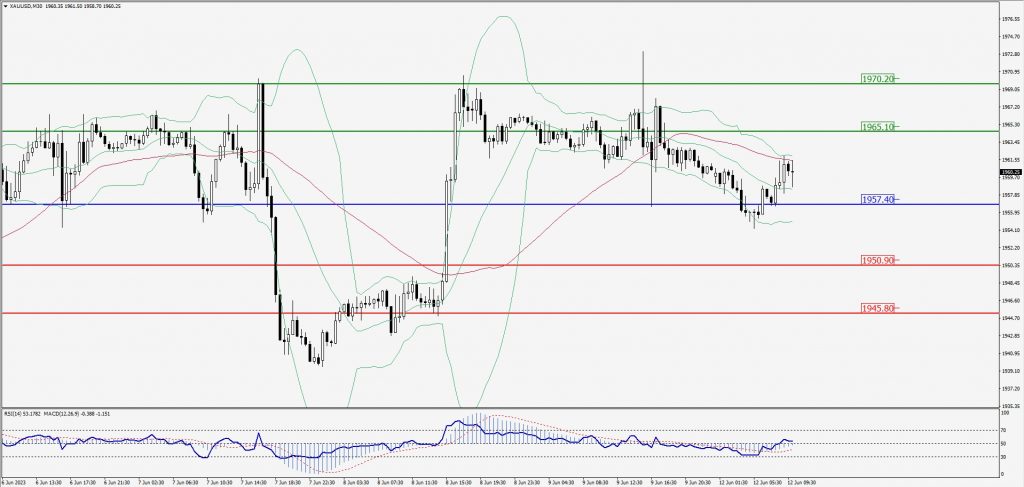
Green Lines Indicate Resistance Levels – Red Lines Indicate Support Levels
Light Blue is a Pivot Point – Black represents the price when the report was produced
Dow Jones Intraday: Support level at 33,893.00
Our pivot point is 33,893.00
Preferable Price Action: Take buy positions above the pivot with targets at 34,023.00 & 34,120.00.
Alternative Price Action: Below 33,893.00 looks for further downside to 33,772.00 & 33,684.00.
Comment: RSI is above 50 levels and Pairs above its 20MA & 55MA.
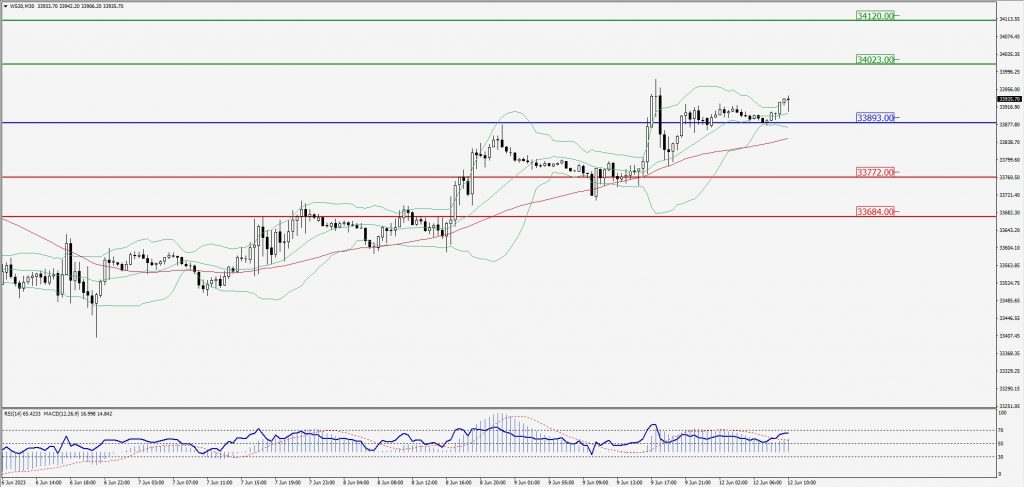
Green Lines Indicate Resistance Levels – Red Lines Indicate Support Levels
Light Blue is a Pivot Point – Black represents the price when the report was produced