Market Wrap: Stocks, Bonds, Commodities
Stock futures were little changed in overnight trading after the S&P 500 and Nasdaq Composite each notched their highest close since April 2022.
The Dow Jones Industrial Average rose 189.55 points to 34,066.33, the S&P 500 gain 0.93% to 4,338.93 and the Nasdaq Composite add 202.78 points to 13,461.92.
MSCI’s index of Asia-Pacific stocks outside Japan is advance 1.16% to 649.50 levels. The Australian index was higher by 0.23% to 7,138.90. Japanese Nikkei Index advance 1.80% today.
European stocks were positive on Tuesday, with the Stoxx Europe 50 Index rose 0.56% to 4,340.55, Germany’s DAX advance 0.35% to 16,153.35, and France’s CAC ascend 0.57% to 7,291.91 and U.K.’s FTSE 100 add 0.16% to 7,582.60.
Benchmark 10-year U.S. Treasury fell as demand for safe assets ascend again, today 10-year bond yields negative 0.94% to 3.7280.
Oil prices fell by around $3 a barrel on Monday after analysts highlighted rising global supplies and concerns about demand growth just ahead of key inflation data and a U.S. Federal Reserve meeting later this week.
Spot Brent crude oil ascend 0.96% to $72.48 per barrel. US West Texas Intermediate crude is up 0.57% to $67.51 a barrel.
The yellow metal gold is advance 0.32% to 1,975.80 dollars per ounce.
Market Wrap: Forex
The dollar edged broadly lower on Tuesday but traded in a narrow range, as investors remained cautious ahead of key U.S. inflation data due later in the day just as the Federal Reserve kicks off its two-day monetary policy meeting.
Today, the U.S. dollar index measures the Greenback against a trade-weighted basket of six major currencies, which slipped 0.33% to 102.890.
The Euro US Dollar (EUR/USD) is a widely traded pair that is up 0.37% today. This left the pair trading around $1.07990.
The Japanese yen was negative against the U.S. dollar on Tuesday. Today USD/JPY is slipped 0.01% to the 139.590 level.
Another commodity-related currency positive against the U.S dollar, AUD/USD rose 0.37% to 0.67770, and NZD/USD surged 0.38% to 0.61460 level.
EUR/USD Intraday: Major trend on the upside
Our pivot point is at 1.07850
Preferable Price Action: Take buy positions above pivot level with targets at 1.08150 & 1.08330 in extension.
Alternative Price Action: Below pivot looks for a further downside to 1.07600 & 1.07410.
Comment: RSI is above 50 levels and Pairs above its 20MA & 55MA.
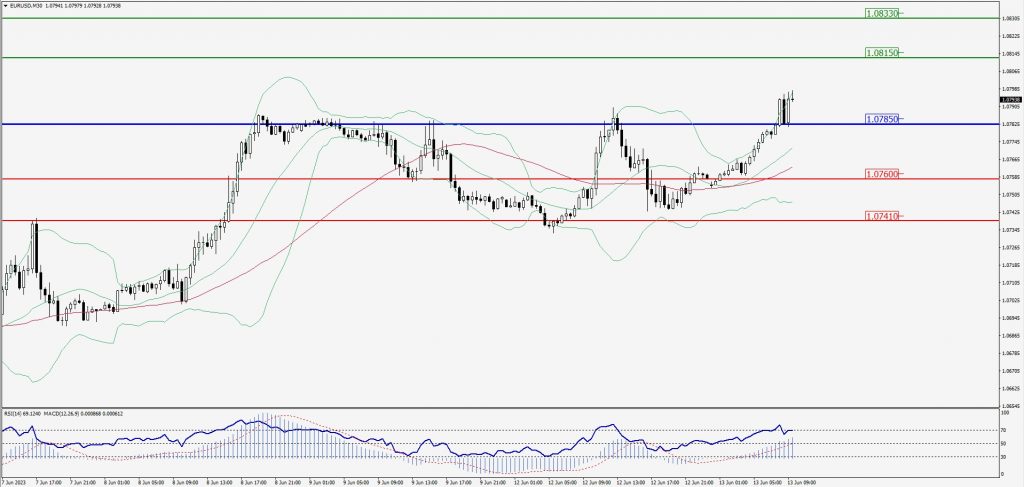
Green Lines Indicate Resistance Levels – Red Lines Indicate Support Levels
Light Blue is a Pivot Point – Black represents the price when the report was produced
GBP/USD Intraday: Trend on the upside
Our pivot point is at 1.25470
Preferable Price Action: Buy positions above pivot with targets at 1.26040 & 1.26390 in extension.
Alternative Price Action: The price below pivot would call for further downside to 1.24960 & 1.24640.
Comment: RSI is above 50 levels and Pairs above its 20MA & 55MA.
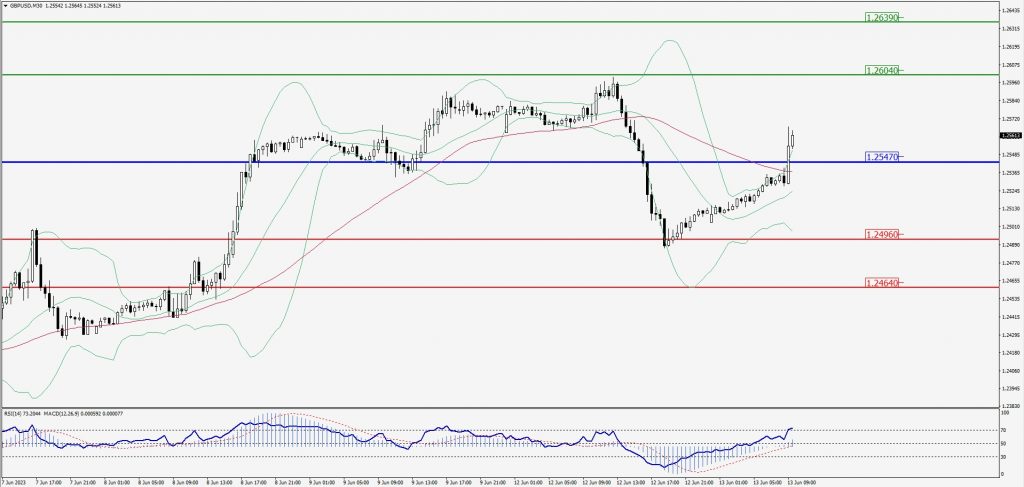
Green Lines Indicate Resistance Levels – Red Lines Indicate Support Levels
Light Blue is a Pivot Point – Black represents the price when the report was produced
USD/JPY Intraday: Support level at 139.550
Our pivot point is at 139.550
Preferable Price Action: Buy position above pivot with the target at 139.930 and 140.200 in extension.
Alternative Price Action: The downside breakout of the pivot would call for 139.210 and 138.980.
Comment: MACD is above 50 level and Pairs above its 20MA & 55MA.
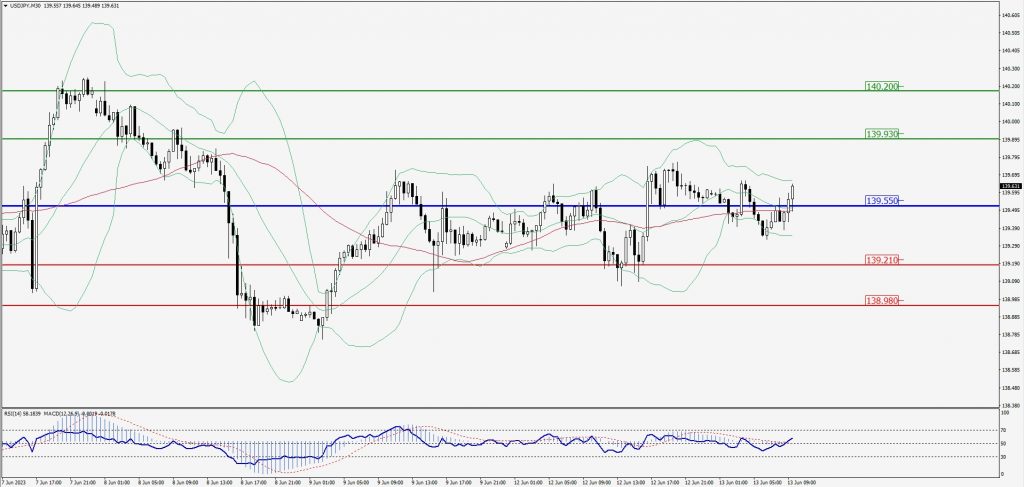
Green Lines Indicate Resistance Levels – Red Lines Indicate Support Levels
Light Blue is a Pivot Point – Black represents the price when the report was produced
AUD/USD Intraday: Trend on the upside
Our pivot point is at 0.67560
Preferable Price Action: Buy positions above pivot with targets at 0.67820 & 0.68020 in extension.
Alternative Price Action: Below pivot looks for a further downside with 0.67320 & 0.67130 as targets.
Comment: RSI is above 50 levels and Pairs above its 20MA & 55MA.
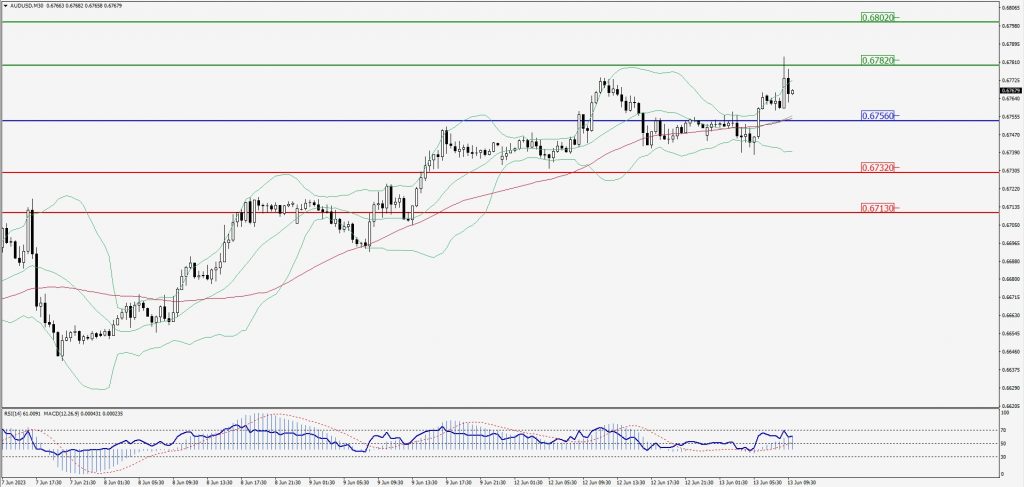
Green Lines Indicate Resistance Levels – Red Lines Indicate Support Levels
Light Blue is a Pivot Point – Black represents the price when the report was produced
CRUDEOIL Intraday: Trend on the downside
Our pivot point is at 68.05
Preferable Price Action: Below pivot sell oil with 66.64 & 65.65 as targets.
Alternative Price Action: Buy crude above pivot with targets at 69.31 and 70.32 in extension.
Comment: MACD is negative territory and Pairs below 55MA.
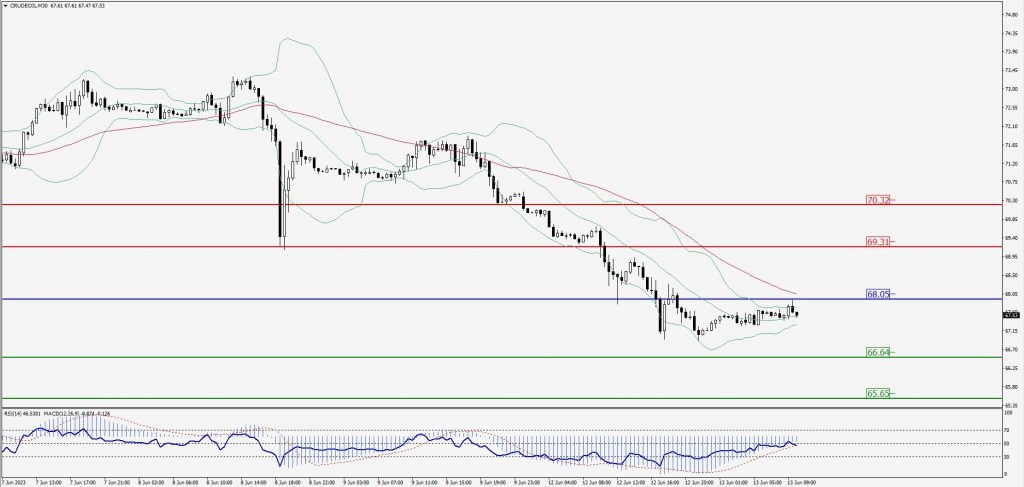
Green Lines Indicate Resistance Levels – Red Lines Indicate Support Levels
Light Blue is a Pivot Point – Black represents the price when the report was produced
XAU/USD Intraday: Trend on the upside
Our pivot point is 1960.70
Preferable Price Action: Further upside to 1968.30 and 1974.00
Alternative Price Action: If the price gives a downside breakout of a pivot, then the price extends to 1953.20 and 1948.10.
Comment: MACD is above 50 level and Pairs above its 20MA & 55MA.
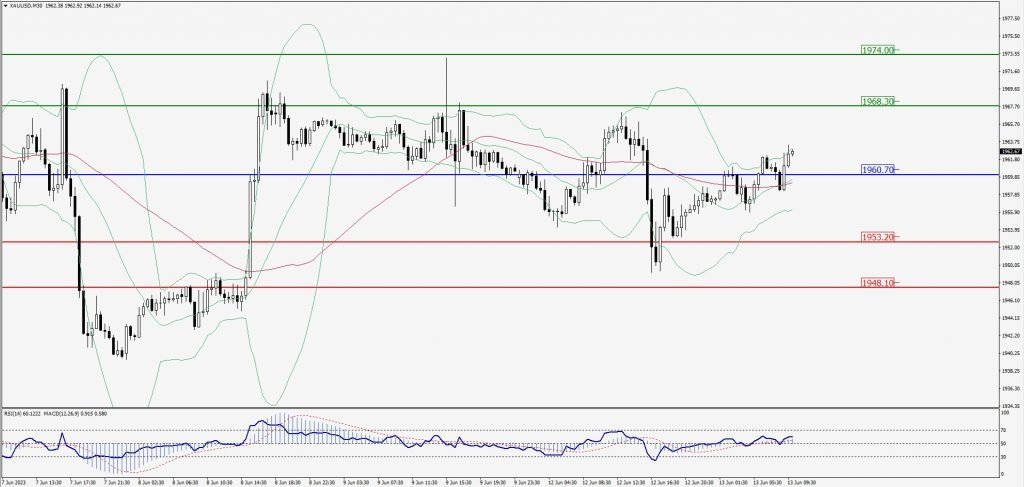
Green Lines Indicate Resistance Levels – Red Lines Indicate Support Levels
Light Blue is a Pivot Point – Black represents the price when the report was produced
Dow Jones Intraday: Support level at 34,066.00
Our pivot point is 34,066.00
Preferable Price Action: Take buy positions above the pivot with targets at 34,211.00 & 34,321.00.
Alternative Price Action: Below 34,066.00 looks for further downside to 33,923.00 & 33,822.00.
Comment: RSI is above 50 levels and Pairs above its 20MA & 55MA.
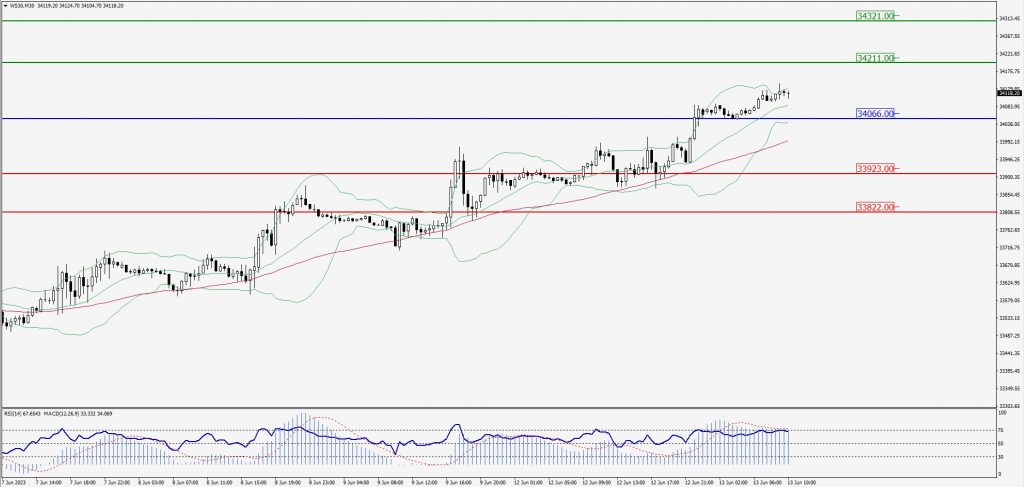
Green Lines Indicate Resistance Levels – Red Lines Indicate Support Levels
Light Blue is a Pivot Point – Black represents the price when the report was produced