Market Wrap: Stocks, Bonds, Commodities
U.S. stock futures remained little changed during Thursday’s evening deals, after major benchmark indexes finished the regular session higher, with the SPX closing at a fresh yearly high
The Dow Jones Industrial Average rose 168.59 points to 33,833.61, the S&P 500 gain 0.62% to 4,293.93 and the Nasdaq Composite add 133.63 points to 13,238.52.
MSCI’s index of Asia-Pacific stocks outside Japan is advance 0.86% to 641.99 levels. The Australian index was higher by 0.32% to 7,122.50. Japanese Nikkei Index advance 1.97% today.
European stocks were negative on Friday, with the Stoxx Europe 50 Index fell 0.07% to 4,294.75, Germany’s DAX decline 0.12% to 15,970.55, and France’s CAC drop 0.07% to 7,217.16 and U.K.’s FTSE 100 subtract 0.11% to 7,592.00.
Benchmark 10-year U.S. Treasury fell as demand for safe assets ascend again, today 10-year bond yields positive 0.87% to 3.7460.
Oil dipped on Thursday as tighter supply resulting from Saudi Arabia’s pledged production cut and a potential pause to U.S. interest rate hikes offset worries over demand weakness and a global economic slowdown.
Spot Brent crude oil ascend 0.42% to $76.28 per barrel. US West Texas Intermediate crude is up 0.42% to $71.59 a barrel.
The yellow metal gold is decline 0.04% to 1,978.05 dollars per ounce.
Market Wrap: Forex
The dollar fell on Thursday after data showed that U.S. jobless claims rose more than expected in the latest week, though the market was generally viewed as consolidating ahead of key inflation data and the Federal Reserve’s interest rate decision next week.
Today, the U.S. dollar index measures the Greenback against a trade-weighted basket of six major currencies, which surged 0.18% to 103.500.
The Euro US Dollar (EUR/USD) is a widely traded pair that is down 0.19% today. This left the pair trading around $1.07640.
The Japanese yen was negative against the U.S. dollar on Friday. Today USD/JPY is surged 0.51% to the 139.630 level.
Another commodity-related currency negative against the U.S dollar, AUD/USD fell 0.03% to 0.67150, and NZD/USD slipped 0.02% to 0.60950 level.
EUR/USD Intraday: Support level at 1.07760
Our pivot point is at 1.07760
Preferable Price Action: Take buy positions above pivot level with targets at 1.08000 & 1.08180 in extension.
Alternative Price Action: Below pivot looks for a further downside to 1.07530 & 1.07350.
Comment: RSI is above 50 levels and Pairs above 55MA.
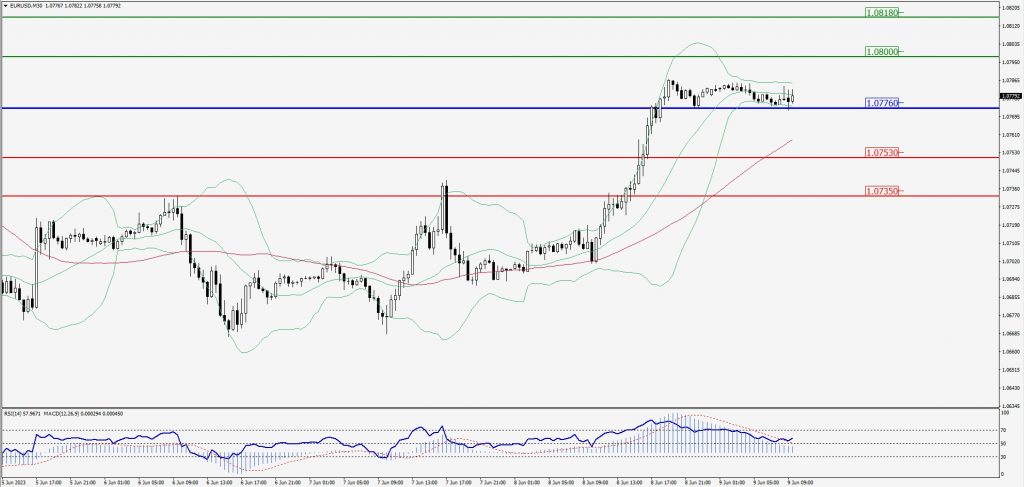
Green Lines Indicate Resistance Levels – Red Lines Indicate Support Levels
Light Blue is a Pivot Point – Black represents the price when the report was produced
GBP/USD Intraday: Trend on the upside
Our pivot point is at 1.25490
Preferable Price Action: Buy positions above pivot with targets at 1.26010 & 1.26320 in extension.
Alternative Price Action: The price below pivot would call for further downside to 1.25070 & 1.24760.
Comment: RSI is above 50 levels and Pairs above its 20MA & 55MA.
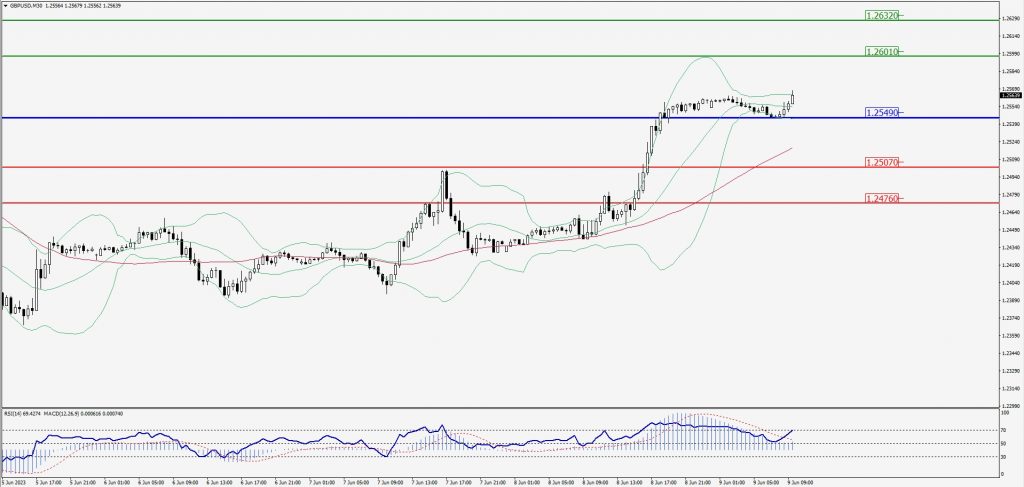
Green Lines Indicate Resistance Levels – Red Lines Indicate Support Levels
Light Blue is a Pivot Point – Black represents the price when the report was produced
USD/JPY Intraday: Trend on the upside
Our pivot point is at 139.340
Preferable Price Action: Buy position above pivot with the target at 139.690 and 139.900 in extension.
Alternative Price Action: The downside breakout of the pivot would call for 139.010 and 138.780.
Comment: MACD is above 50 level and Pairs above its 20MA & 55MA.
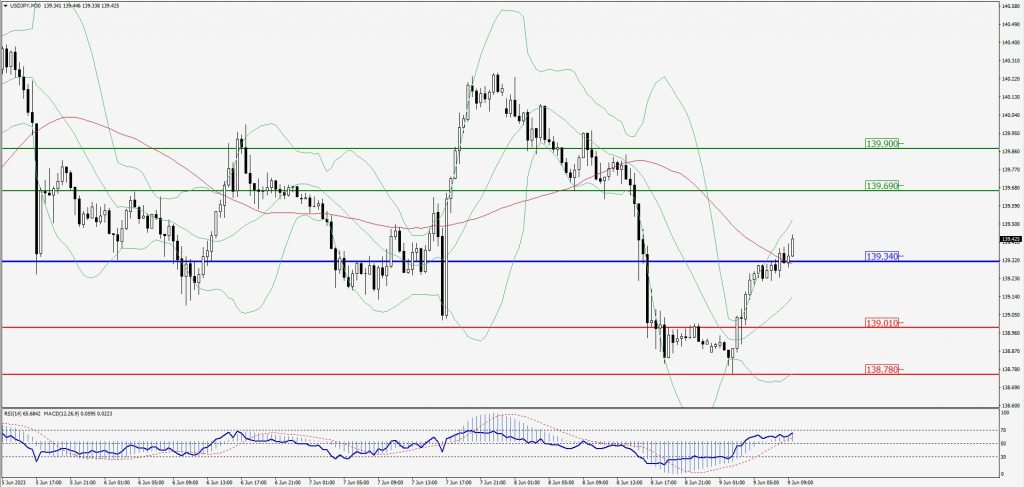
Green Lines Indicate Resistance Levels – Red Lines Indicate Support Levels
Light Blue is a Pivot Point – Black represents the price when the report was produced
AUD/USD Intraday: Trend on the upside
Our pivot point is at 0.67090
Preferable Price Action: Buy positions above pivot with targets at 0.67390 & 0.67610 in extension.
Alternative Price Action: Below pivot looks for a further downside with 0.66800 & 0.66600 as targets.
Comment: RSI is above 50 levels and Pairs above its 20MA & 55MA.
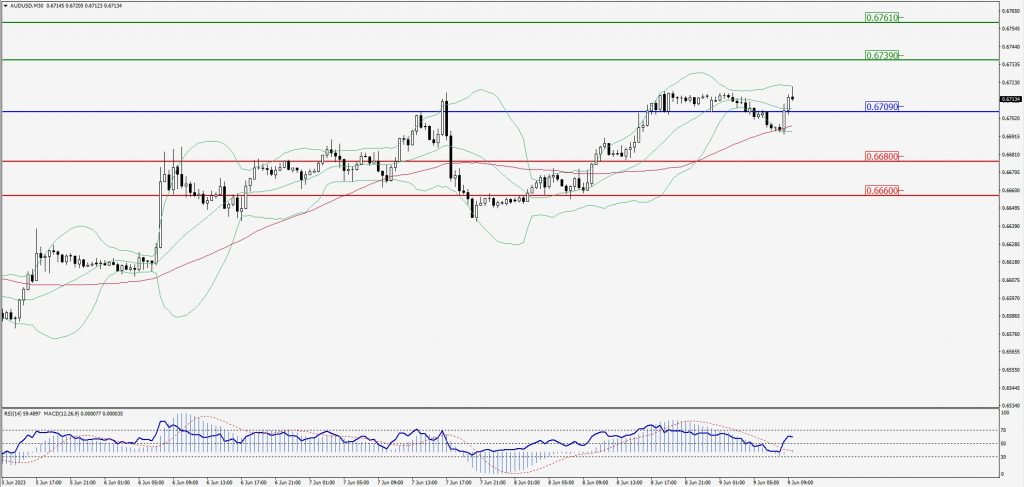
Green Lines Indicate Resistance Levels – Red Lines Indicate Support Levels
Light Blue is a Pivot Point – Black represents the price when the report was produced
CRUDEOIL Intraday: Trend on the downside
Our pivot point is at 71.42
Preferable Price Action: Below pivot sell oil with 70.51 & 69.86 as targets.
Alternative Price Action: Buy crude above pivot with targets at 72.29 and 73.02 in extension.
Comment: MACD is negative territory and Pairs below 55MA.
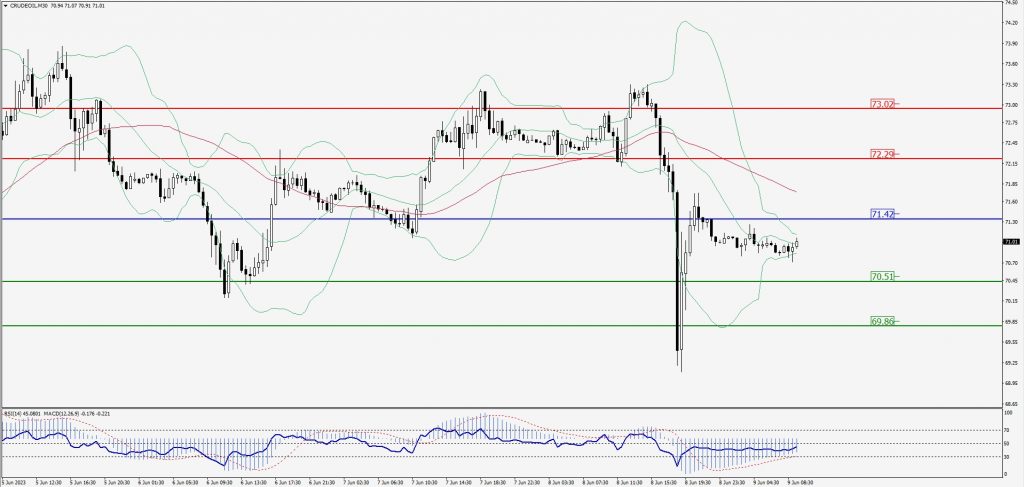
Green Lines Indicate Resistance Levels – Red Lines Indicate Support Levels
Light Blue is a Pivot Point – Black represents the price when the report was produced
XAU/USD Intraday: Trend on the upside
Our pivot point is 1964.10
Preferable Price Action: Further upside to 1971.50 and 1976.70
Alternative Price Action: If the price gives a downside breakout of a pivot, then the price extends to 1957.50 and 1952.90.
Comment: MACD is above 50 level and Pairs above 55MA.
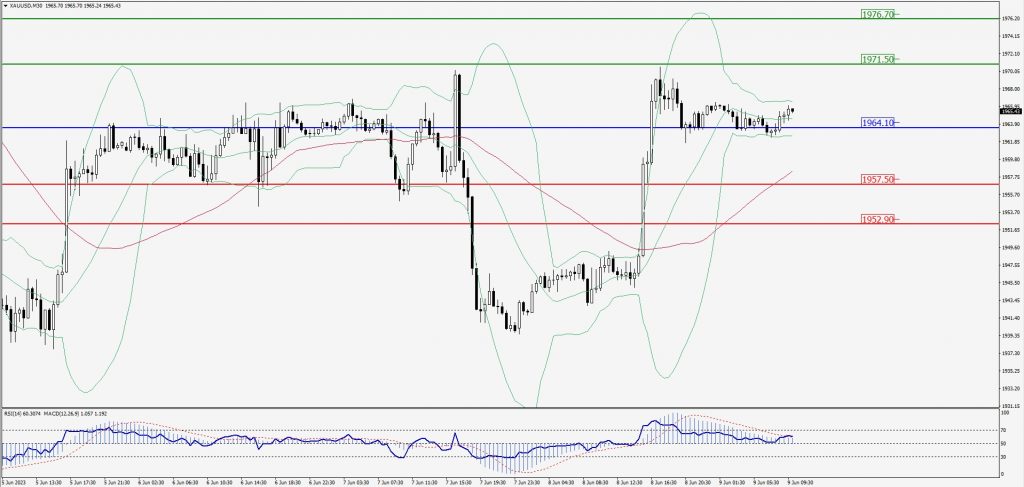
Green Lines Indicate Resistance Levels – Red Lines Indicate Support Levels
Light Blue is a Pivot Point – Black represents the price when the report was produced
Dow Jones Intraday: Trend on the downside
Our pivot point is 33,799.00
Preferable Price Action: Take sell positions below the pivot with targets at 33,705.00 & 33,636.00.
Alternative Price Action: Above 33,799.00 looks for further upside to 33,890.00 & 33,963.00.
Comment: RSI is below 50 levels and Pairs below 20MA.
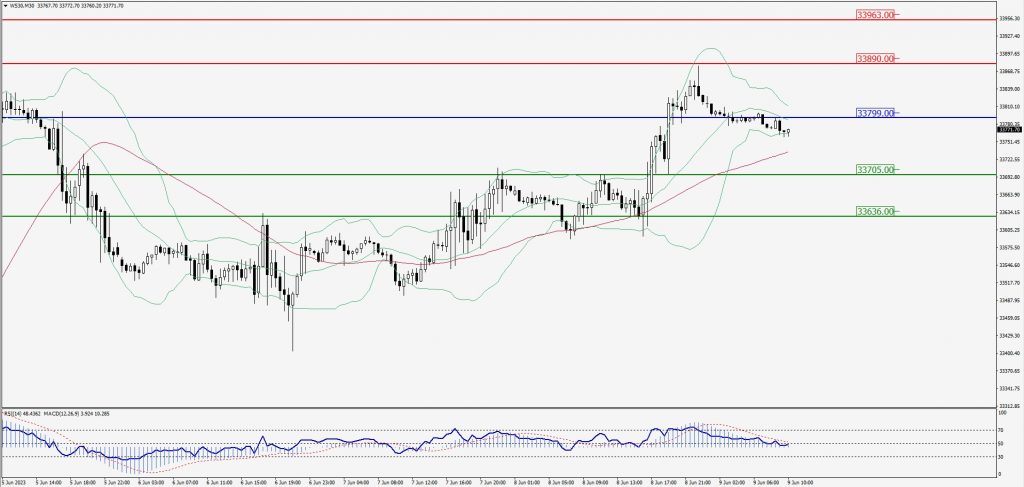
Green Lines Indicate Resistance Levels – Red Lines Indicate Support Levels
Light Blue is a Pivot Point – Black represents the price when the report was produced