Market Wrap: Stocks, Bonds, Commodities
The S&P 500 and Nasdaq closed in negative territory on Wednesday as investors took profits after a months-long mega cap stocks run and ahead of key economic and policy events next week.
The Dow Jones Industrial Average rose 91.74 points to 33,665.02, the S&P 500 lose 0.38% to 4,267.52 and the Nasdaq Composite subtract 171.52 points to 13,104.89.
MSCI’s index of Asia-Pacific stocks outside Japan is decline 0.31% to 635.34 levels. The Australian index was lower by 0.26% to 7,099.70. Japanese Nikkei Index decline 0.85% today.
European stocks were positive on Thursday, with the Stoxx Europe 50 Index rose 0.04% to 4,293.55, Germany’s DAX advance 0.13% to 15,981.55, and France’s CAC ascend 0.19% to 7,216.19 and U.K.’s FTSE 100 subtract 0.30% to 7,602.00.
Benchmark 10-year U.S. Treasury fell as demand for safe assets ascend again, today 10-year bond yields positive 0.35% to 3.7990.
Oil prices climbed about 1 percent on Wednesday as Saudi Arabia’s plans for deep output cuts more than offset demand woes stemming from rising U.S. fuel stocks and weak Chinese export data.
Spot Brent crude oil drop 0.57% to $76.51 per barrel. US West Texas Intermediate crude is down 0.59% to $72.10 a barrel.
The yellow metal gold is advance 0.23% to 1,962.85 dollars per ounce.
Market Wrap: Forex
The dollar was on the back foot on Thursday, though it drew some support from higher U.S. Treasury yields as traders contemplated the possibility of another rate hike by the U.S. Federal Reserve, even if it pauses next week.
Today, the U.S. dollar index measures the Greenback against a trade-weighted basket of six major currencies, which slipped 0.21% to 103.840.
The Euro US Dollar (EUR/USD) is a widely traded pair that is up 0.25% today. This left the pair trading around $1.07260.
The Japanese yen was negative against the U.S. dollar on Thursday. Today USD/JPY is slipped 0.25% to the 139.780 level.
Another commodity-related currency positive against the U.S dollar, AUD/USD rose 0.47% to 0.66830, and NZD/USD surged 0.55% to 0.60700 level.
EUR/USD Intraday: Trend on the upside
Our pivot point is at 1.07070
Preferable Price Action: Take buy positions above pivot level with targets at 1.07300 & 1.07470 in extension.
Alternative Price Action: Below pivot looks for a further downside to 1.06850 & 1.06700.
Comment: RSI is above 50 levels and Pairs above its 20MA & 55MA.
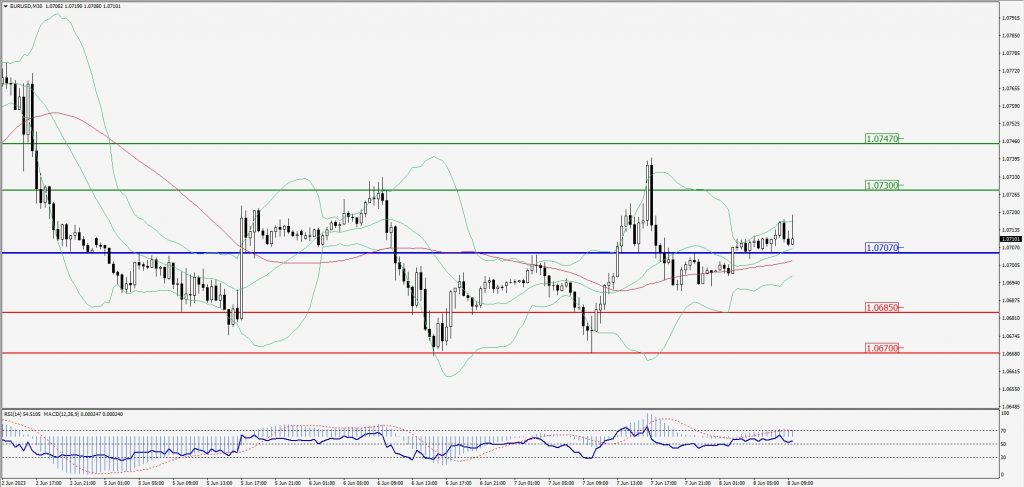
Green Lines Indicate Resistance Levels – Red Lines Indicate Support Levels
Light Blue is a Pivot Point – Black represents the price when the report was produced
GBP/USD Intraday: In a consolidation zone
Our pivot point is at 1.24430
Preferable Price Action: Buy positions above pivot with targets at 1.24760 & 1.24990 in extension.
Alternative Price Action: The price below pivot would call for further downside to 1.24120 & 1.23910.
Comment: RSI is at 50 levels and Pairs above 55MA.
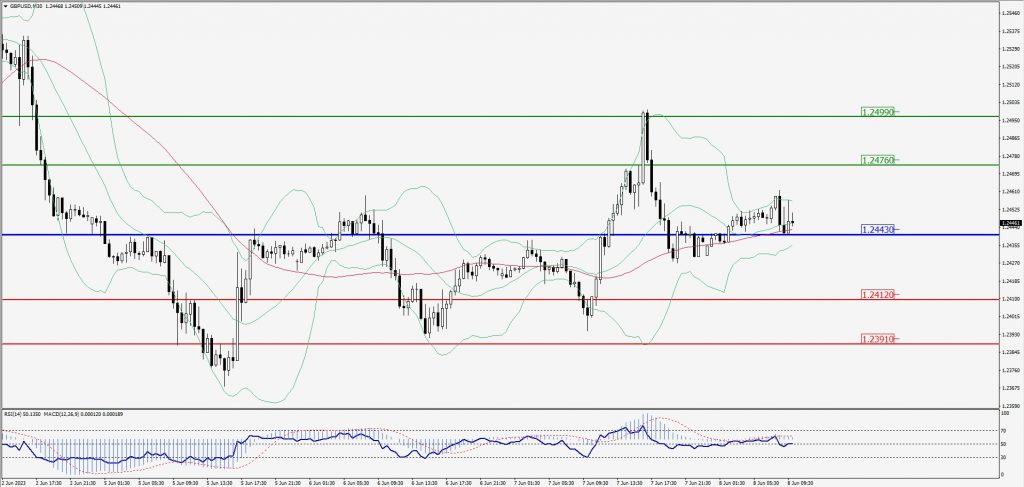
Green Lines Indicate Resistance Levels – Red Lines Indicate Support Levels
Light Blue is a Pivot Point – Black represents the price when the report was produced
USD/JPY Intraday: Trend on the upside
Our pivot point is at 139.810
Preferable Price Action: Buy position above pivot with the target at 140.140 and 140.430 in extension.
Alternative Price Action: The downside breakout of the pivot would call for 139.500 and 139.270.
Comment: MACD is at 50 level and Pairs above 55MA.
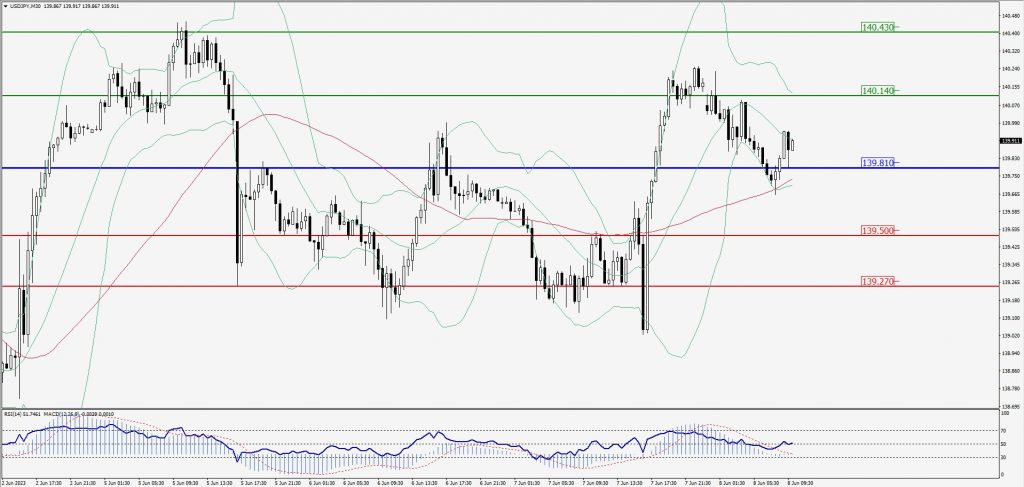
Green Lines Indicate Resistance Levels – Red Lines Indicate Support Levels
Light Blue is a Pivot Point – Black represents the price when the report was produced
AUD/USD Intraday: Trend on the upside
Our pivot point is at 0.66530
Preferable Price Action: Buy positions above pivot with targets at 0.66940 & 0.67230 in extension.
Alternative Price Action: Below pivot looks for a further downside with 0.66200 & 0.65920 as targets.
Comment: RSI is above 50 levels and Pairs above 20MA.
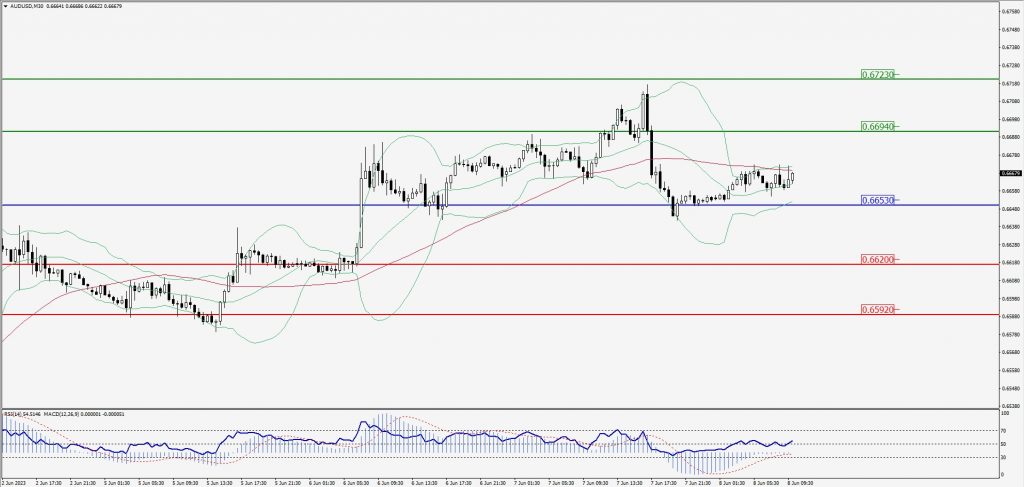
Green Lines Indicate Resistance Levels – Red Lines Indicate Support Levels
Light Blue is a Pivot Point – Black represents the price when the report was produced
CRUDEOIL Intraday: Support level at 72.51
Our pivot point is at 72.51
Preferable Price Action: Above pivot buy oil with 73.42 & 74.08 as targets.
Alternative Price Action: Sell crude below pivot with targets at 71.62 and 71.05 in extension.
Comment: MACD is positive territory and Pairs above its 20MA & 55MA.
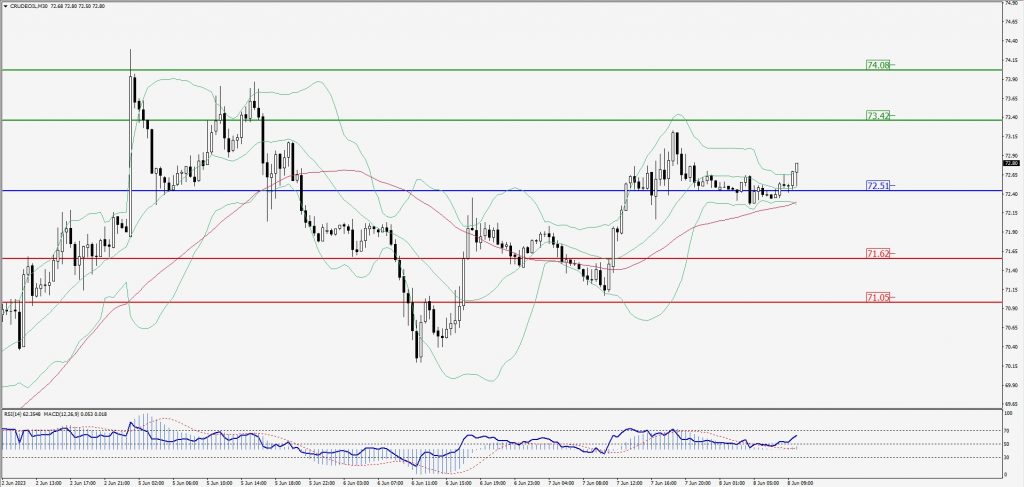
Green Lines Indicate Resistance Levels – Red Lines Indicate Support Levels
Light Blue is a Pivot Point – Black represents the price when the report was produced
XAU/USD Intraday: Trend on the downside
Our pivot point is 1949.00
Preferable Price Action: Further downside to 1938.30 and 1929.60
Alternative Price Action: If the price gives a upside breakout of a pivot, then the price extends to 1960.30 and 1968.90.
Comment: MACD is below 50 level and Pairs below 55MA.
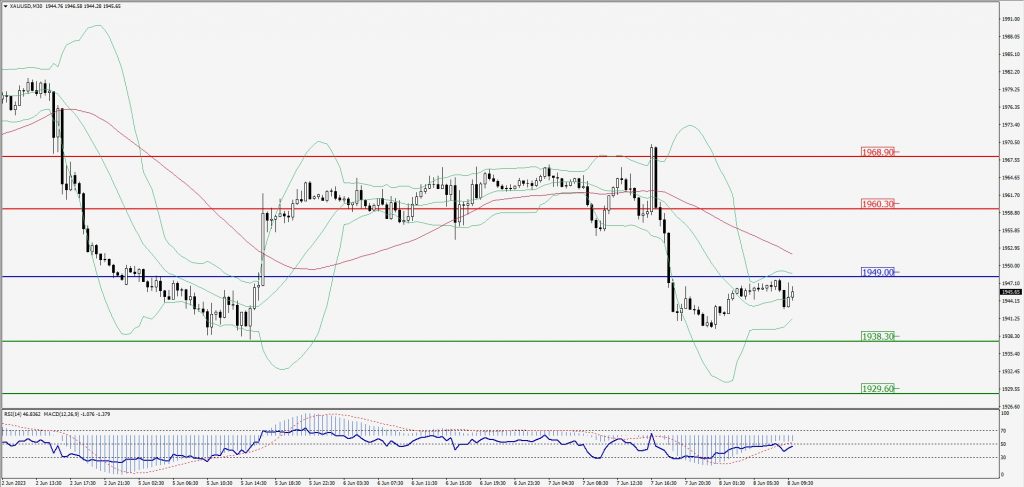
Green Lines Indicate Resistance Levels – Red Lines Indicate Support Levels
Light Blue is a Pivot Point – Black represents the price when the report was produced
Dow Jones Intraday: Trend on the upside
Our pivot point is 33,626.00
Preferable Price Action: Take buy positions above the pivot with targets at 33,771.00 & 33,882.00.
Alternative Price Action: Below 33,626.00 looks for further downside to 33,506.00 & 33,409.00.
Comment: RSI is above 50 levels and Pairs above 55MA.
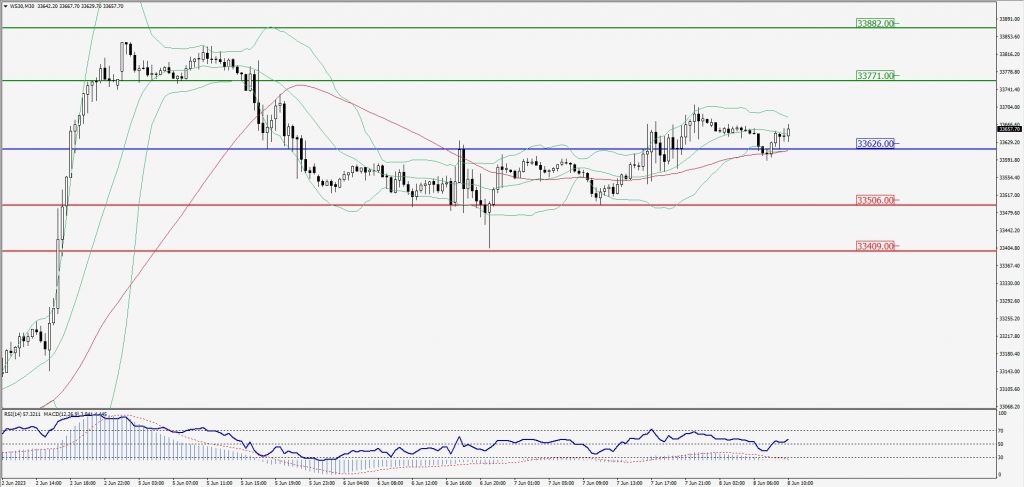
Green Lines Indicate Resistance Levels – Red Lines Indicate Support Levels
Light Blue is a Pivot Point – Black represents the price when the report was produced