Market Wrap: Stocks, Bonds, Commodities
US equity futures were changed little on Sunday evening after a broad-based rally last week that pushed the S&P 500 to its best week since March, and its highest level since last August.
The Dow Jones Industrial Average rose 701.19 points to 33,762.76, the S&P 500 gain 1.45% to 4,282.37 and the Nasdaq Composite add 139.78 points to 13,240.77.
MSCI’s index of Asia-Pacific stocks outside Japan is advance 0.05% to 632.66 levels. The Australian index was higher by 1.00% to 7,216.30. Japanese Nikkei Index advance 2.20% today.
European stocks were positive on Monday, with the Stoxx Europe 50 Index rose 0.02% to 4,324.45, Germany’s DAX advance 0.12% to 16,070.55, and France’s CAC ascend 0.01% to 7,272.52 and U.K.’s FTSE 100 add 0.53% to 7,646.27.
Benchmark 10-year U.S. Treasury fell as demand for safe assets ascend again, today 10-year bond yields positive 1.45% to 3.7410.
Oil prices rose more than 2 percent on Friday after the U.S. Congress passed a debt ceiling deal that averted a government default in the world’s biggest oil consumer and jobs data fed hopes for a possible pause in interest rate hikes ahead of a meeting of OPEC and its allies this weekend.
Spot Brent crude oil ascend 2.48% to $78.01 per barrel. US West Texas Intermediate crude is up 2.58% to $73.59 a barrel.
The yellow metal gold is decline 0.54% to 1,958.85 dollars per ounce.
Market Wrap: Forex
The U.S. dollar climbed higher in early European trade Monday after a healthy jobs report prompted traders to price in a continuation of the Federal Reserve’s hawkish stance.
Today, the U.S. dollar index measures the Greenback against a trade-weighted basket of six major currencies, which surged 0.21% to 104.170.
The Euro US Dollar (EUR/USD) is a widely traded pair that is down 0.15% today. This left the pair trading around $1.06920.
The Japanese yen was negative against the U.S. dollar on Monday. Today USD/JPY is surged 0.19% to the 140.250 level.
Another commodity-related currency negative against the U.S dollar, AUD/USD fell 0.30% to 0.65980, and NZD/USD slipped 0.24% to 0.60560 level.
EUR/USD Intraday: Resistance level at 1.07050
Our pivot point is at 1.07050
Preferable Price Action: Take sell positions below pivot level with targets at 1.06710 & 1.06510 in extension.
Alternative Price Action: Above pivot looks for a further upside to 1.07350 & 1.07580.
Comment: RSI is below 50 levels and Pairs below its 20MA & 55MA.
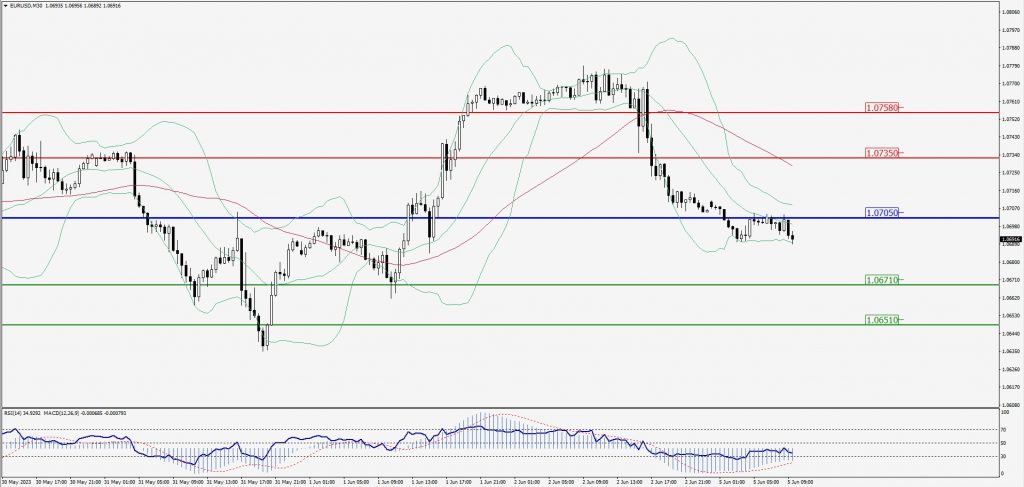
Green Lines Indicate Resistance Levels – Red Lines Indicate Support Levels
Light Blue is a Pivot Point – Black represents the price when the report was produced
GBP/USD Intraday: Major trend on the downside
Our pivot point is at 1.24340
Preferable Price Action: Sell positions below pivot with targets at 1.23880 & 1.23600 in extension.
Alternative Price Action: The price above pivot would call for further upside to 1.24760 & 1.25090.
Comment: RSI is below 50 levels and Pairs below its 20MA & 55MA.
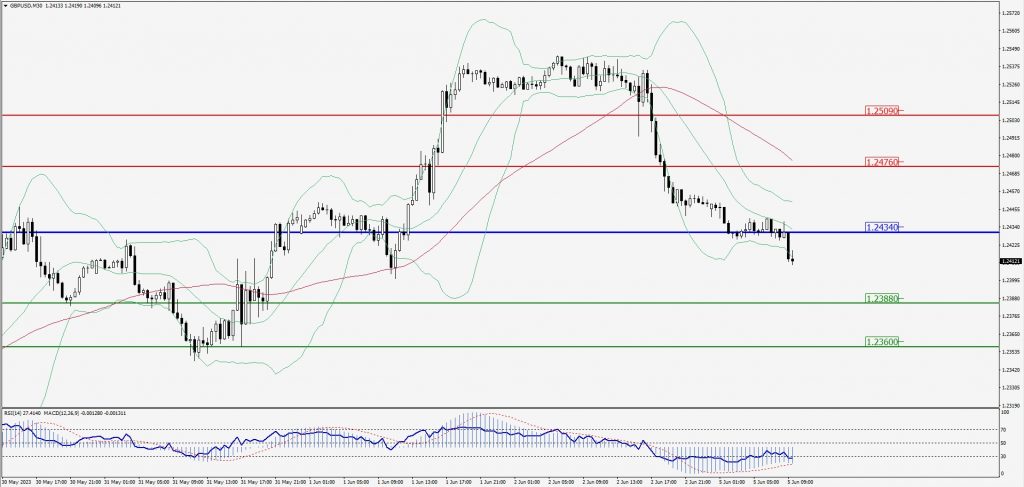
Green Lines Indicate Resistance Levels – Red Lines Indicate Support Levels
Light Blue is a Pivot Point – Black represents the price when the report was produced
USD/JPY Intraday: Major trend on the upside
Our pivot point is at 140.100
Preferable Price Action: Buy position above pivot with the target at 140.660 and 141.020 in extension.
Alternative Price Action: The downside breakout of the pivot would call for 139.650 and 139.330.
Comment: MACD is above 50 level and Pairs above its 20MA & 55MA.
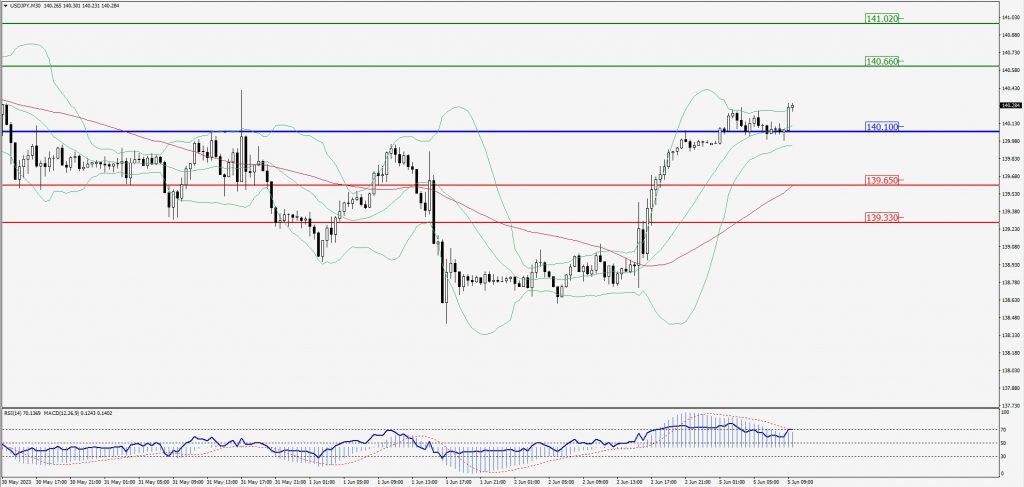
Green Lines Indicate Resistance Levels – Red Lines Indicate Support Levels
Light Blue is a Pivot Point – Black represents the price when the report was produced
AUD/USD Intraday: Trend on the downside
Our pivot point is at 0.66090
Preferable Price Action: Sell positions below pivot with targets at 0.65750 & 0.65500 in extension.
Alternative Price Action: Above pivot looks for a further upside with 0.66410 & 0.66640 as targets.
Comment: RSI is below 50 levels and Pairs below its 20MA & 55MA.
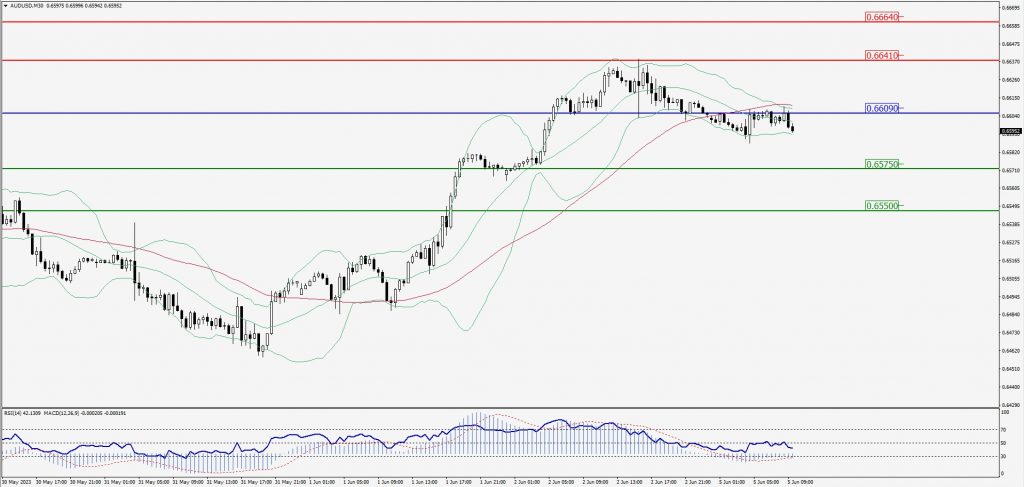
Green Lines Indicate Resistance Levels – Red Lines Indicate Support Levels
Light Blue is a Pivot Point – Black represents the price when the report was produced
CRUDEOIL Intraday: Trend on the upside
Our pivot point is at 72.58
Preferable Price Action: Above pivot buy oil with 73.85 & 74.61 as targets.
Alternative Price Action: Sell crude below pivot with targets at 71.39 and 70.55 in extension.
Comment: MACD is positive territory and Pairs above 55MA.
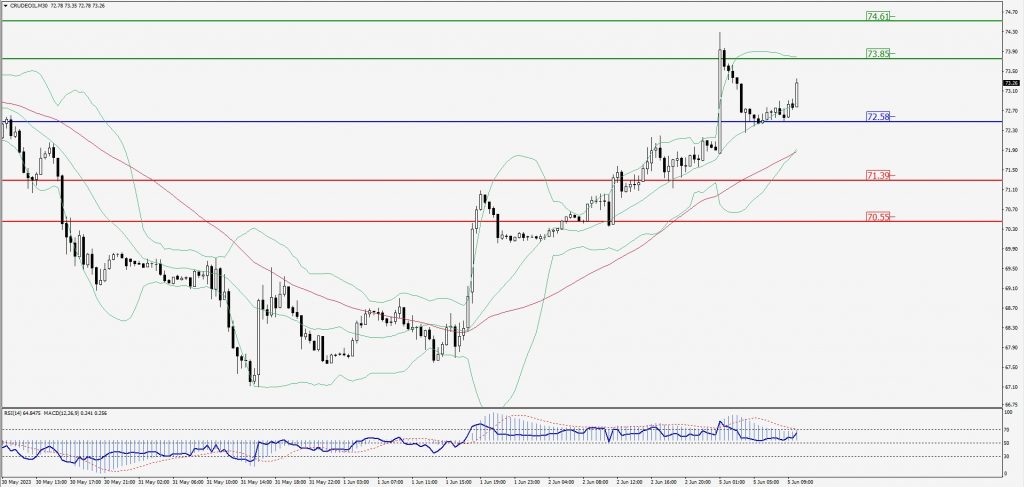
Green Lines Indicate Resistance Levels – Red Lines Indicate Support Levels
Light Blue is a Pivot Point – Black represents the price when the report was produced
XAU/USD Intraday: Trend on the downside
Our pivot point is 1947.90
Preferable Price Action: Further downside to 1935.20 and 1926.40
Alternative Price Action: If the price gives an upside breakout of a pivot, then the price extends to 1960.00 and 1969.10.
Comment: MACD is below 50 level and Pairs below its 20MA & 55MA.
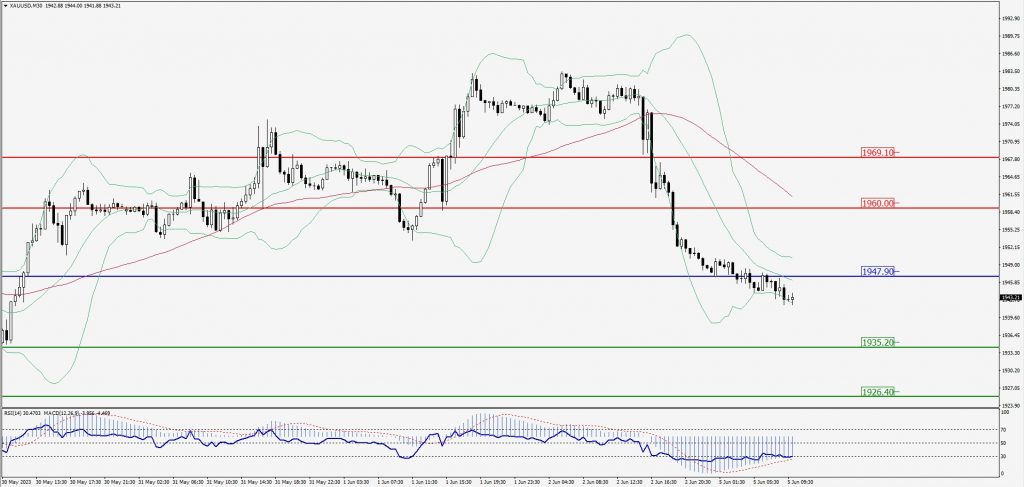
Green Lines Indicate Resistance Levels – Red Lines Indicate Support Levels
Light Blue is a Pivot Point – Black represents the price when the report was produced
Dow Jones Intraday: Support level at 33,785.00
Our pivot point is 33,785.00
Preferable Price Action: Take buy positions above the pivot with targets at 34,067.00 & 34,289.00.
Alternative Price Action: Below 33,785.00 looks for further downside to 33,517.00 & 33,306.00.
Comment: RSI is above 50 levels and Pairs above 55MA.
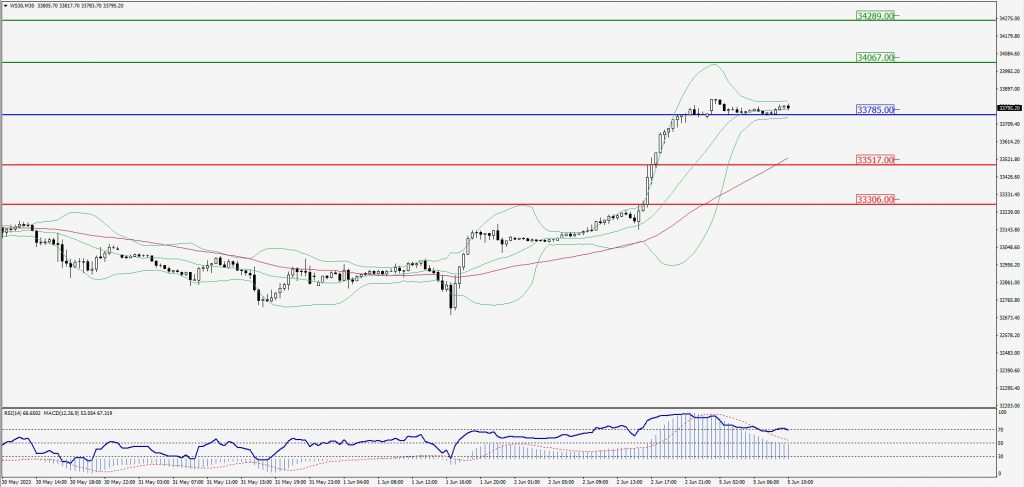
Green Lines Indicate Resistance Levels – Red Lines Indicate Support Levels
Light Blue is a Pivot Point – Black represents the price when the report was produced