Market Wrap: Stocks, Bonds, Commodities
Stock futures were flat on Tuesday evening as investors kept an eye on the federal debt ceiling debate in Washington ahead of the final trading day of May.
The Dow Jones Industrial Average fell 50.55 points to 33,042.78, the S&P 500 gain 0.01% to 4,205.52 and the Nasdaq Composite add 41.74 points to 13,017.43.
MSCI’s index of Asia-Pacific stocks outside Japan is decline 1.40% to 615.76 levels. The Australian index was lower by 1.64% to 7,091.30. Japanese Nikkei Index decline 1.41% today.
European stocks were negative on Wednesday, with the Stoxx Europe 50 Index fell 0.50% to 4,328.65, Germany’s DAX decline 0.32% to 15,857.85, and France’s CAC drop 0.55% to 7,498.70 and U.K.’s FTSE 100 subtract 0.30% to 7,500.12.
Benchmark 10-year U.S. Treasury fell as demand for safe assets ascend again, today 10-year bond yields negative 1.37% to 3.6500.
Oil prices fell by more than 4 percent on Tuesday on concerns about whether U.S. Congress will pass the U.S. debt ceiling pact and as mixed messages from major producers clouded the supply outlook ahead of the OPEC+ meeting this weekend.
Spot Brent crude oil drop 0.84% to $73.08 per barrel. US West Texas Intermediate crude is down 0.82% to $68.91 a barrel.
The yellow metal gold is decline 0.13% to 1,974.45 dollars per ounce.
Market Wrap: Forex
The U.S. dollar gained in early European trading Wednesday after weak Chinese activity data hit risk sentiment, while the U.S. debt ceiling deal cleared an important hurdle.
Today, the U.S. dollar index measures the Greenback against a trade-weighted basket of six major currencies, which surged 0.42% to 104.520.
The Euro US Dollar (EUR/USD) is a widely traded pair that is down 0.67% today. This left the pair trading around $1.06610.
The Japanese yen was negative against the U.S. dollar on Wednesday. Today USD/JPY is surged 0.06% to the 139.880 level.
Another commodity-related currency negative against the U.S dollar, AUD/USD fell 0.63% to 0.65400, and NZD/USD slipped 0.79% to 0.59960 level.
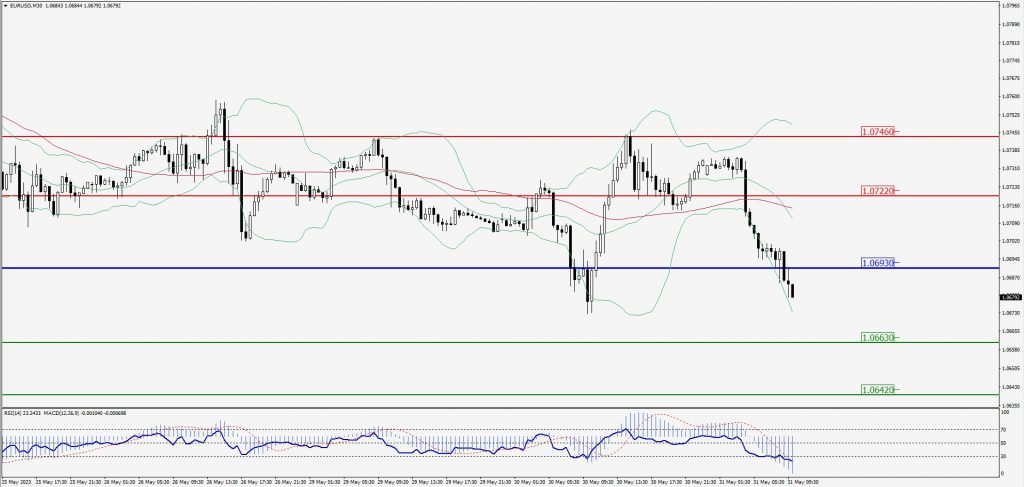
EUR/USD Intraday: Major trend on the downside
Our pivot point is at 1.06930
Preferable Price Action: Take sell positions below pivot level with targets at 1.06630 & 1.06420 in extension.
Alternative Price Action: Above pivot looks for a further upside to 1.07220 & 1.07460.
Comment: RSI is below 50 levels and Pairs below its 20MA & 55MA.
Green Lines Indicate Resistance Levels – Red Lines Indicate Support Levels
Light Blue is a Pivot Point – Black represents the price when the report was produced
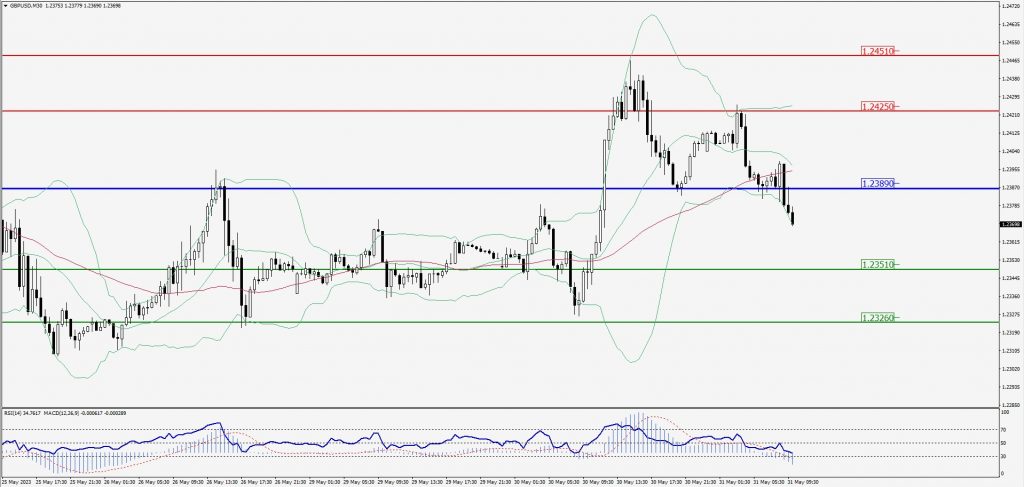
GBP/USD Intraday: Trend on the downside
Our pivot point is at 1.23890
Preferable Price Action: Sell positions below pivot with targets at 1.23510 & 1.23260 in extension.
Alternative Price Action: The price above pivot would call for further upside to 1.24250 & 1.24510.
Comment: RSI is below 50 levels and Pairs below its 20MA & 55MA.
Green Lines Indicate Resistance Levels – Red Lines Indicate Support Levels
Light Blue is a Pivot Point – Black represents the price when the report was produced
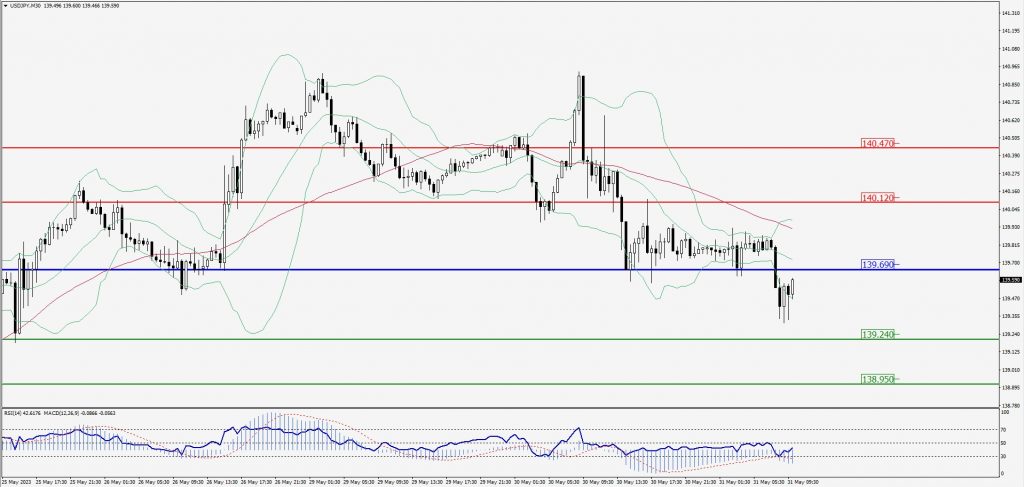
USD/JPY Intraday: Trend on the downside
Our pivot point is at 139.690
Preferable Price Action: Sell position below pivot with the target at 139.240 and 138.950 in extension.
Alternative Price Action: The upside breakout of the pivot would call for 140.120 and 140.470.
Comment: MACD is below 50 level and Pairs below its 20MA & 55MA.
Green Lines Indicate Resistance Levels – Red Lines Indicate Support Levels
Light Blue is a Pivot Point – Black represents the price when the report was produced
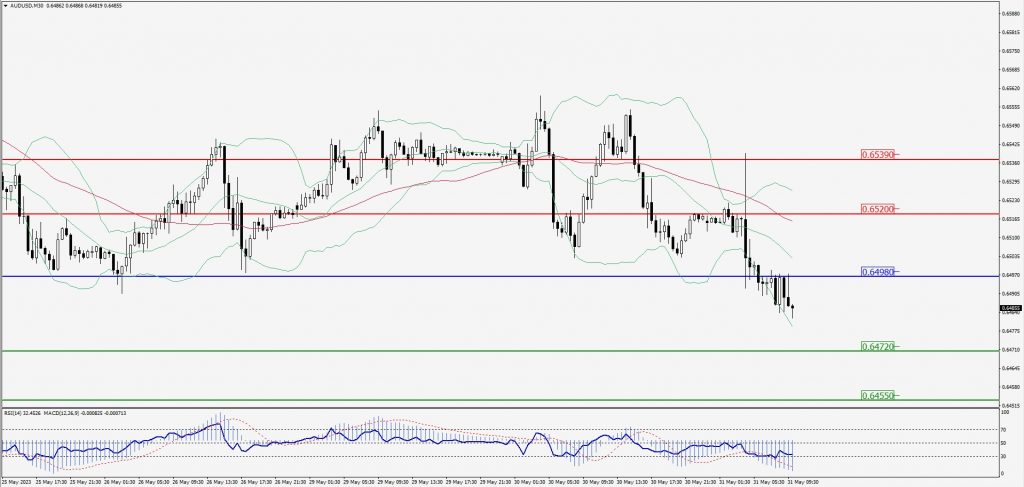
AUD/USD Intraday: Resistance level at 0.64980
Our pivot point is at 0.64980
Preferable Price Action: Sell positions below pivot with targets at 0.64720 & 0.64550 in extension.
Alternative Price Action: Above pivot looks for a further upside with 0.65200 & 0.65390 as targets.
Comment: RSI is below 50 levels and Pairs below its 20MA & 55MA.
Green Lines Indicate Resistance Levels – Red Lines Indicate Support Levels
Light Blue is a Pivot Point – Black represents the price when the report was produced
CRUDEOIL Intraday: Trend on the downside
Our pivot point is at 69.91
Preferable Price Action: Below pivot sell oil with 68.64 & 67.64 as targets.
Alternative Price Action: Buy crude above pivot with targets at 71.26 and 72.38 in extension.
Comment: MACD is negative territory and Pairs below 55MA.
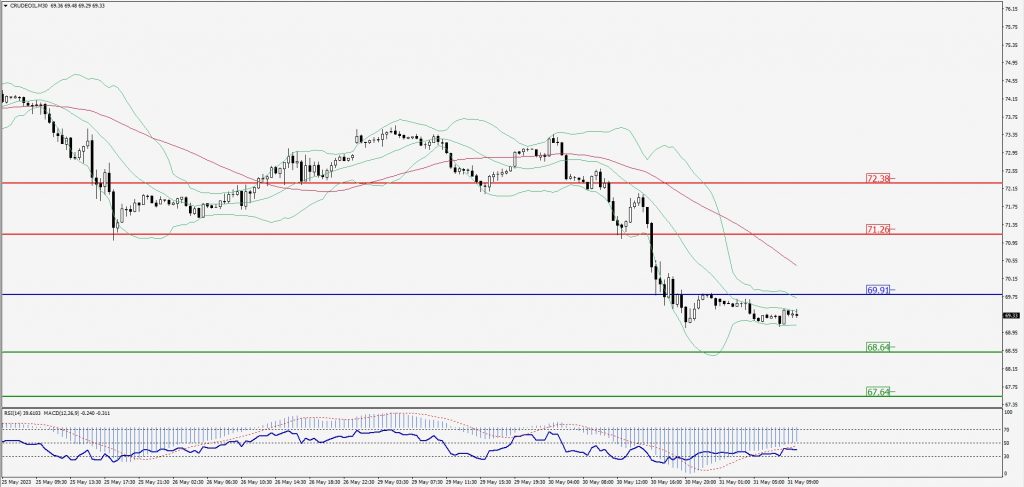
Green Lines Indicate Resistance Levels – Red Lines Indicate Support Levels
Light Blue is a Pivot Point – Black represents the price when the report was produced
XAU/USD Intraday: Trend on the upside
Our pivot point is 1956.60
Preferable Price Action: Further upside to 1964.30 and 1970.40
Alternative Price Action: If the price gives a downside breakout of a pivot, then the price extends to 1949.60 and 1944.70.
Comment: MACD is above 50 level and Pairs above 55MA.
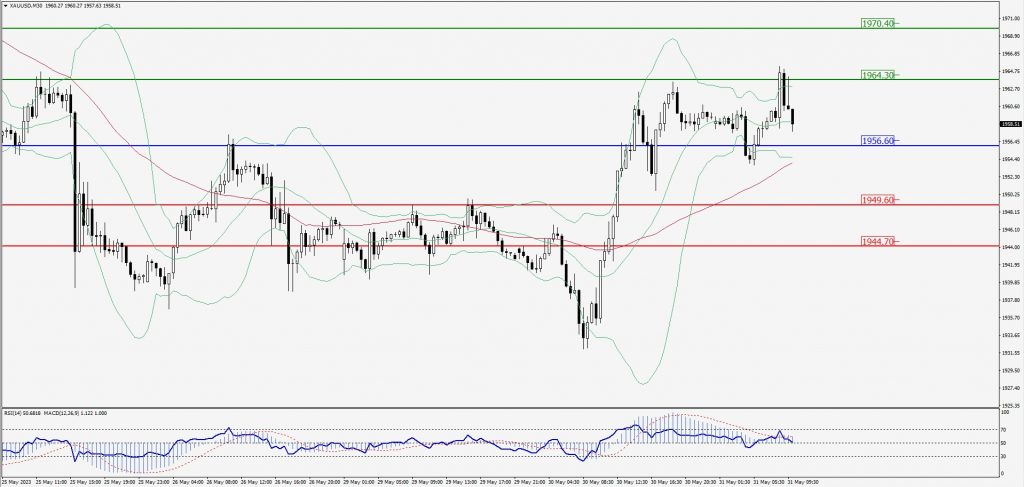
Green Lines Indicate Resistance Levels – Red Lines Indicate Support Levels
Light Blue is a Pivot Point – Black represents the price when the report was produced
Dow Jones Intraday: Trend on the downside
Our pivot point is 32,953.00
Preferable Price Action: Take sell positions below the pivot with targets at 32,802.00 & 32,701.00.
Alternative Price Action: Above 32,953.00 looks for further upside to 33,091.00 & 33,191.00.
Comment: RSI is below 50 levels and Pairs below its 20MA & 55MA.
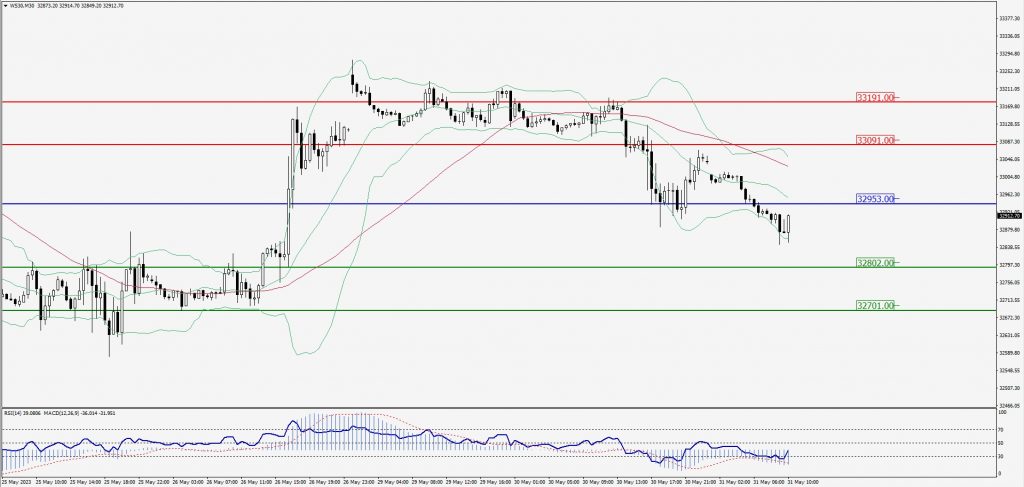
Green Lines Indicate Resistance Levels – Red Lines Indicate Support Levels
Light Blue is a Pivot Point – Black represents the price when the report was produced