Market Wrap: Stocks, Bonds, Commodities
Stock futures looked up on Monday night after the Biden administration and Republican lawmakers reached a tentative deal on raising the US debt ceiling.
The Dow Jones Industrial Average rose 328.69 points to 33,093.34, the S&P 500 gain 1.30% to 4,205.45 and the Nasdaq Composite add 277.59 points to 12,975.69.
MSCI’s index of Asia-Pacific stocks outside Japan is advance 0.11% to 624.77 levels. The Australian index was lower by 0.11% to 7,209.30. Japanese Nikkei Index advance 0.30% today.
European stocks were mixed on Tuesday, with the Stoxx Europe 50 Index rose 0.20% to 4,328.65, Germany’s DAX advance 0.36% to 16,010.85, and France’s CAC drop 0.29% to 7,282.87 and U.K.’s FTSE 100 subtract 0.15% to 7,616.55.
Benchmark 10-year U.S. Treasury fell as demand for safe assets ascend again, today 10-year bond yields negative 1.74% to 3.7490.
Oil prices rose on Monday after U.S. leaders reached a tentative debt ceiling deal, possibly averting a default in the world’s largest economy and oil consumer, although concerns about further interest rate hikes capped gains.
Spot Brent crude oil drop 1.75% to $75.75 per barrel. US West Texas Intermediate crude is down 0.32% to $71.44 a barrel.
The yellow metal gold is decline 0.05% to 1,962.40 dollars per ounce.
Market Wrap: Forex
The U.S. dollar climbed higher in early European trading Tuesday, remaining close to a two-month peak, as traders digested the potential for more Federal Reserve interest rate hikes as well as the passage of the U.S. debt ceiling deal through a divided Congress.
Today, the U.S. dollar index measures the Greenback against a trade-weighted basket of six major currencies, which surged 0.09% to 104.230.
The Euro US Dollar (EUR/USD) is a widely traded pair that is down 0.15% today. This left the pair trading around $1.07030.
The Japanese yen was negative against the U.S. dollar on Tuesday. Today USD/JPY is slipped 0.16% to the 140.400 level.
Another commodity-related currency mixed against the U.S dollar, AUD/USD rose 0.29% to 0.65400, and NZD/USD slipped 0.06% to 0.60460 level.
EUR/USD Intraday: Trend on the downside
Our pivot point is at 1.07050
Preferable Price Action: Take sell positions below pivot level with targets at 1.06750 & 1.06550 in extension.
Alternative Price Action: Above pivot looks for a further upside to 1.07320 & 1.07530.
Comment: RSI is below 50 levels and Pairs below its 20MA & 55MA.
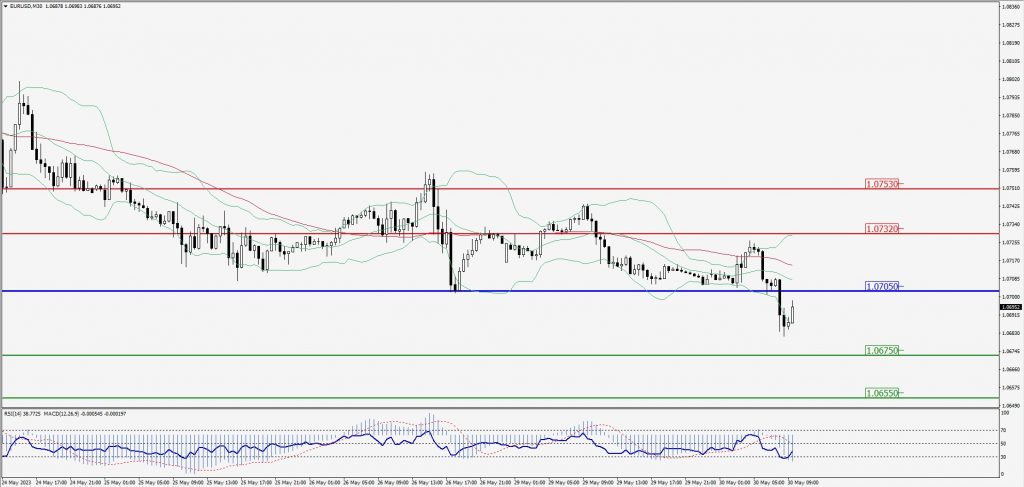
Green Lines Indicate Resistance Levels – Red Lines Indicate Support Levels
Light Blue is a Pivot Point – Black represents the price when the report was produced
GBP/USD Intraday: Resistance level at 1.23580
Our pivot point is at 1.23580
Preferable Price Action: Sell positions below pivot with targets at 1.23290 & 1.23110 in extension.
Alternative Price Action: The price above pivot would call for further upside to 1.23840 & 1.24030.
Comment: RSI is below 50 levels and Pairs below its 20MA & 55MA.
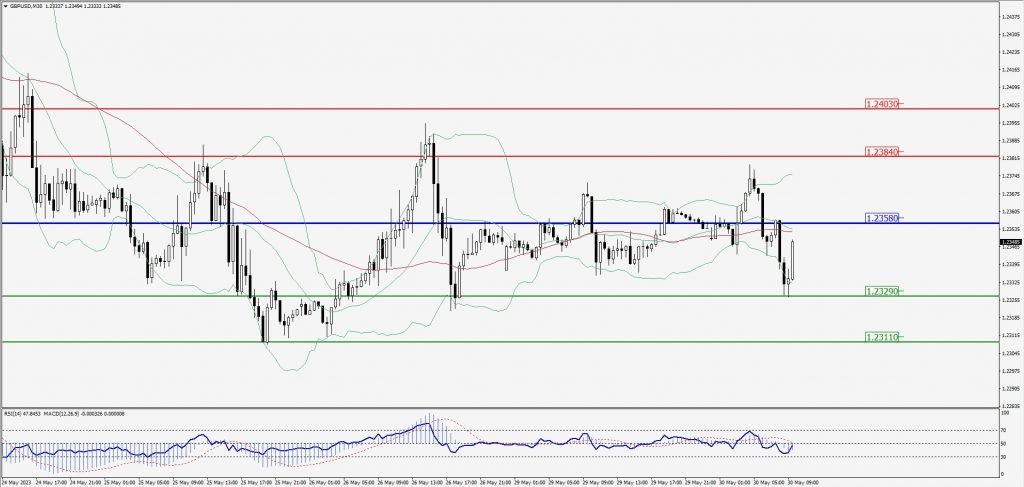
Green Lines Indicate Resistance Levels – Red Lines Indicate Support Levels
Light Blue is a Pivot Point – Black represents the price when the report was produced
USD/JPY Intraday: In a consolidation zone
Our pivot point is at 140.600
Preferable Price Action: Sell position below pivot with the target at 140.080 and 139.710 in extension.
Alternative Price Action: The upside breakout of the pivot would call for 141.100 and 141.500.
Comment: MACD is at 50 level.
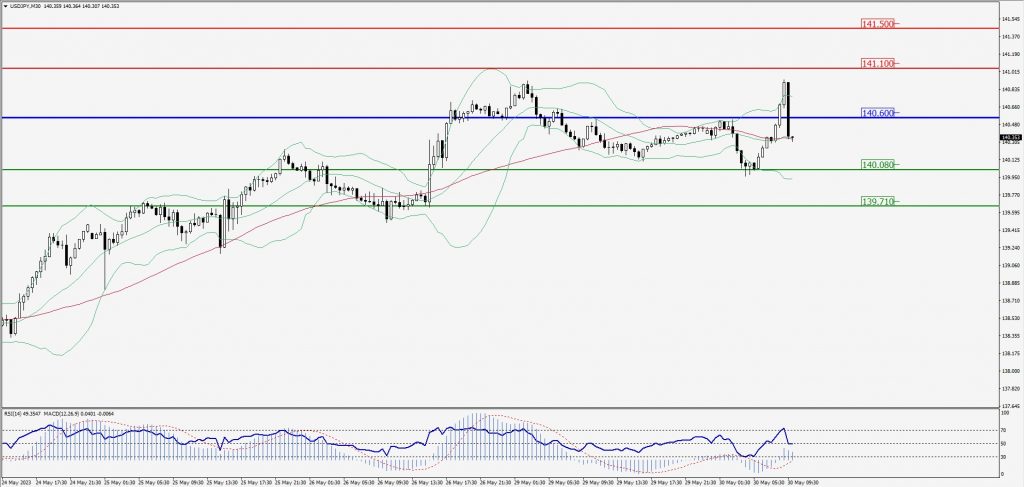
Green Lines Indicate Resistance Levels – Red Lines Indicate Support Levels
Light Blue is a Pivot Point – Black represents the price when the report was produced
AUD/USD Intraday: Trend on the downside
Our pivot point is at 0.65300
Preferable Price Action: Sell positions below pivot with targets at 0.65050 & 0.64870 in extension.
Alternative Price Action: Above pivot looks for a further upside with 0.65540 & 0.65730 as targets.
Comment: RSI is below 50 levels and Pairs below its 20MA & 55MA.
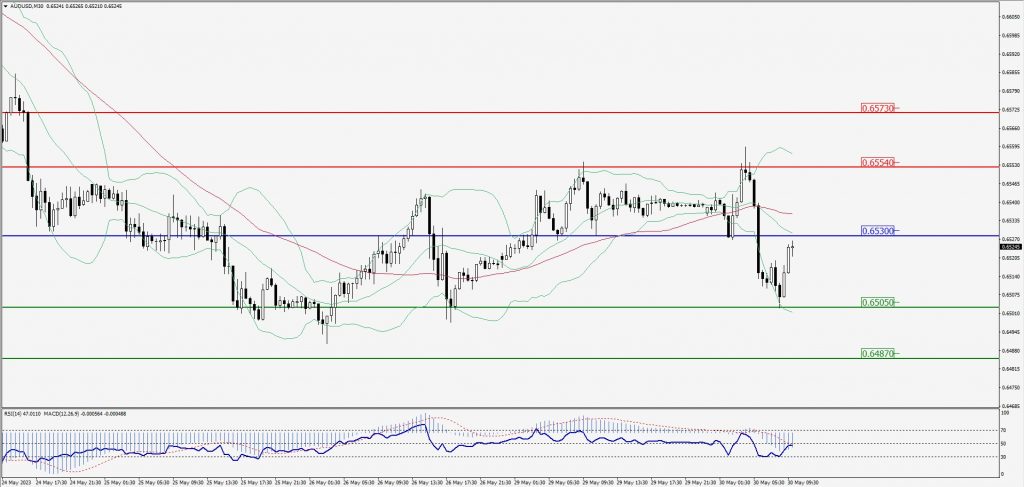
Green Lines Indicate Resistance Levels – Red Lines Indicate Support Levels
Light Blue is a Pivot Point – Black represents the price when the report was produced
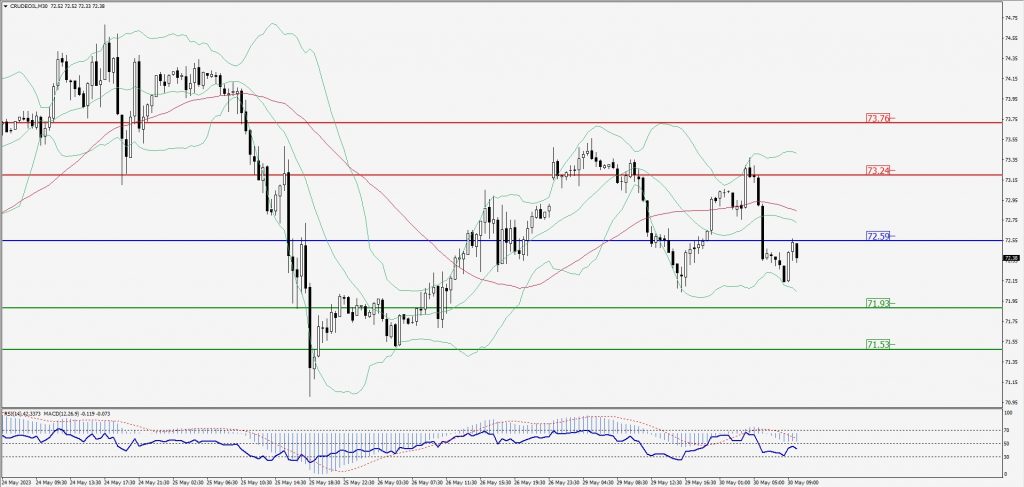
CRUDEOIL Intraday: Trend on the downside
Our pivot point is at 72.59
Preferable Price Action: Below pivot sell oil with 71.93 & 71.53 as targets.
Alternative Price Action: Buy crude above pivot with targets at 73.24 and 73.76 in extension.
Comment: MACD is negative territory and Pairs below its 20MA & 55MA.
Green Lines Indicate Resistance Levels – Red Lines Indicate Support Levels
Light Blue is a Pivot Point – Black represents the price when the report was produced
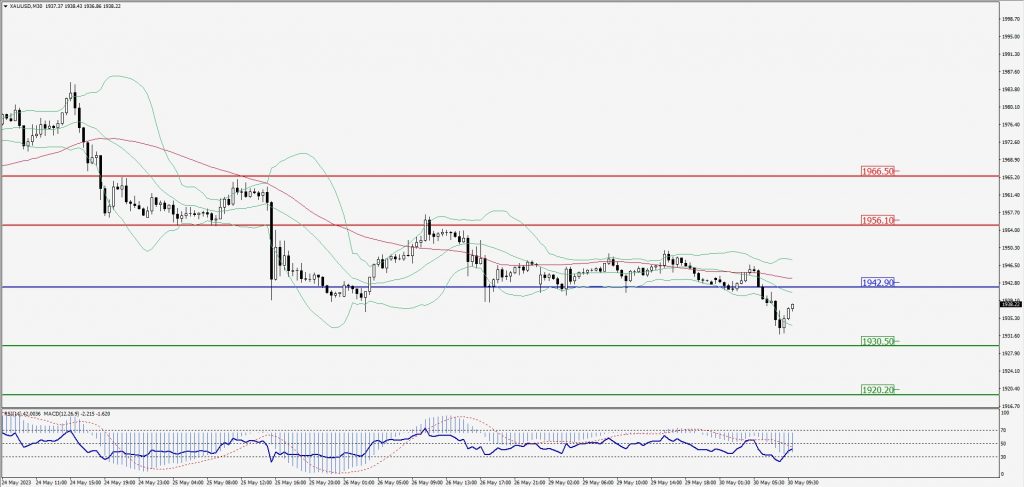
XAU/USD Intraday: Trend on the downside
Our pivot point is 1942.90
Preferable Price Action: Further downside to 1930.50 and 1920.20
Alternative Price Action: If the price gives an upside breakout of a pivot, then the price extends to 1956.10 and 1966.50.
Comment: MACD is below 50 level and Pairs below its 20MA & 55MA.
Green Lines Indicate Resistance Levels – Red Lines Indicate Support Levels
Light Blue is a Pivot Point – Black represents the price when the report was produced
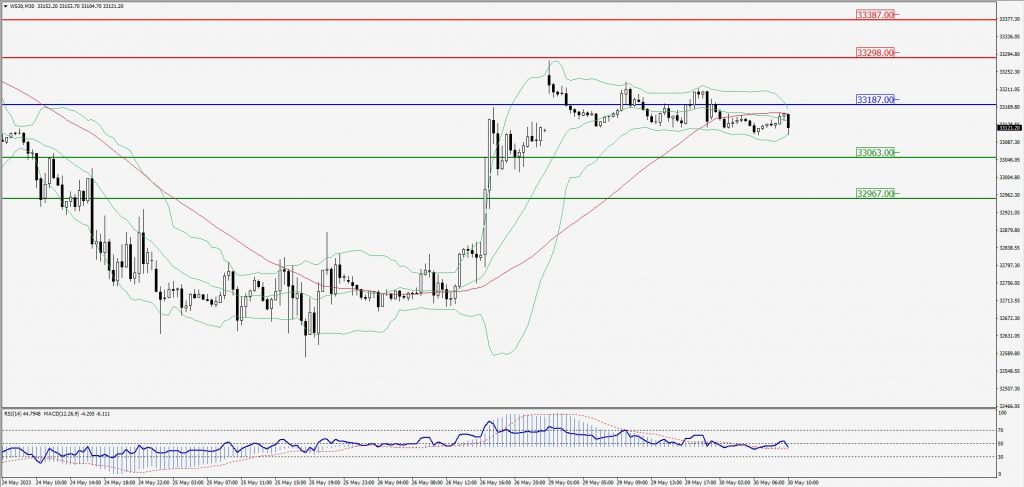
Dow Jones Intraday: Trend on the downside
Our pivot point is 33,187.00
Preferable Price Action: Take sell positions below the pivot with targets at 33,063.00 & 32,967.00.
Alternative Price Action: Above 33,187.00 looks for further upside to 33,298.00 & 33,387.00.
Comment: RSI is below 50 levels and Pairs below 55MA.
Green Lines Indicate Resistance Levels – Red Lines Indicate Support Levels
Light Blue is a Pivot Point – Black represents the price when the report was produced