Market Wrap: Stocks, Bonds, Commodities
Stocks jumped Friday as traders grew hopeful that lawmakers will reach a deal to raise the US debt ceiling, avoiding a potentially catastrophic default.
The Dow Jones Industrial Average rose 328.69 points to 33,093.34, the S&P 500 gain 1.30% to 4,205.45 and the Nasdaq Composite add 277.59 points to 12,975.69.
MSCI’s index of Asia-Pacific stocks outside Japan is decline 0.07% to 624.58 levels. The Australian index was higher by 0.87% to 7,217.40. Japanese Nikkei Index advance 1.03% today.
European stocks were positive on Monday, with the Stoxx Europe 50 Index rose 0.07% to 4,340.35, Germany’s DAX advance 0.12% to 16,002.35, and France’s CAC ascend 0.10% to 7,326.25 and U.K.’s FTSE 100 add 0.74% to 7,627.20.
Benchmark 10-year U.S. Treasury fell as demand for safe assets ascend again, today 10-year bond yields negative 0.68% to 3.7950.
Oil prices ticked up on Friday as U.S. officials appeared close to striking a debt ceiling deal, and as the market weighed conflicting messages on supply from Russia and Saudi Arabia ahead of the next OPEC+ policy meeting.
Spot Brent crude oil ascend 0.21% to $77.13 per barrel. US West Texas Intermediate crude is up 0.32% to $72.90 a barrel.
The yellow metal gold is advance 0.02% to 1,963.00 dollars per ounce.
Market Wrap: Forex
The dollar edged down on Monday, pulling back from six-month peaks against the yen as a U.S. debt ceiling deal lifted risk appetite across financial markets and dented the greenback’s safe-haven appeal.
Today, the U.S. dollar index measures the Greenback against a trade-weighted basket of six major currencies, which slipped 0.02% to 104.118.
The Euro US Dollar (EUR/USD) is a widely traded pair that is up 0.03% today. This left the pair trading around $1.07220.
The Japanese yen was negative against the U.S. dollar on Monday. Today USD/JPY is slipped 0.17% to the 140.370 level.
Another commodity-related currency positive against the U.S dollar, AUD/USD rose 0.31% to 0.65420, and NZD/USD surged 0.17% to 0.60600 level.
EUR/USD Intraday: Trend on the upside
Our pivot point is at 1.07300
Preferable Price Action: Take buy positions above pivot level with targets at 1.07500 & 1.07660 in extension.
Alternative Price Action: Below pivot looks for a further downside to 1.07110 & 1.06980.
Comment: RSI is above 50 levels and Pairs above its 20MA & 55MA.
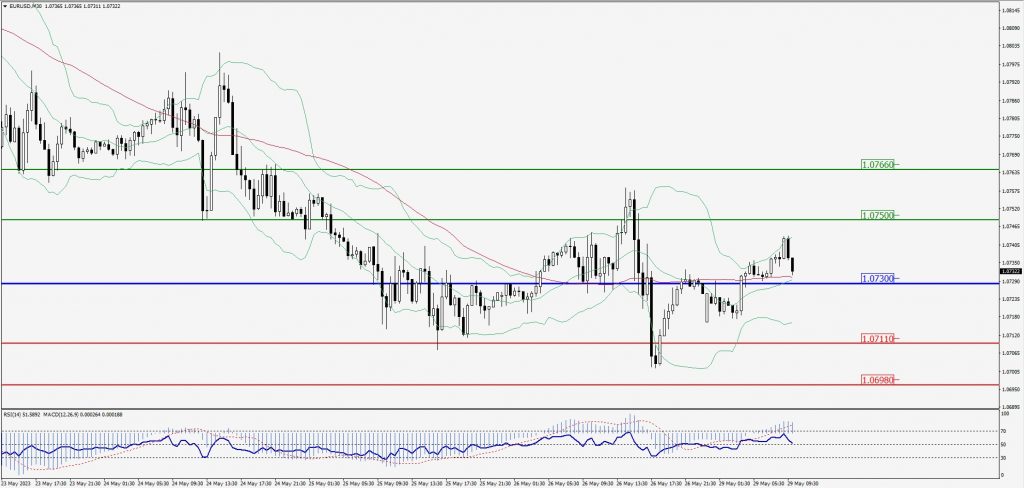
Green Lines Indicate Resistance Levels – Red Lines Indicate Support Levels
Light Blue is a Pivot Point – Black represents the price when the report was produced
GBP/USD Intraday: Trend on the upside
Our pivot point is at 1.23490
Preferable Price Action: Buy positions above pivot with targets at 1.23810 & 1.24040 in extension.
Alternative Price Action: The price below pivot would call for further downside to 1.23210 & 1.23000.
Comment: RSI is above 50 levels and Pairs above 20MA.
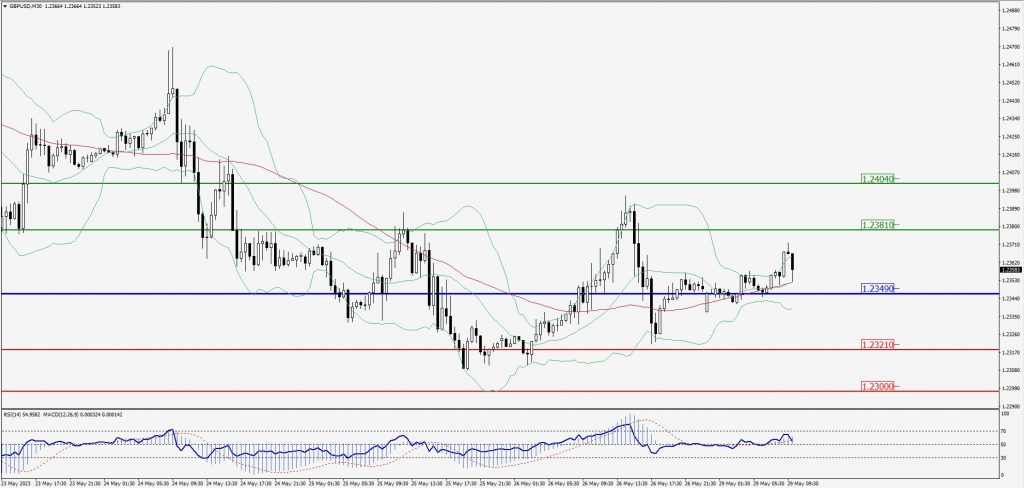
Green Lines Indicate Resistance Levels – Red Lines Indicate Support Levels
Light Blue is a Pivot Point – Black represents the price when the report was produced
USD/JPY Intraday: Trend on the downside
Our pivot point is at 140.590
Preferable Price Action: Sell position below pivot with the target at 140.060 and 139.720 in extension.
Alternative Price Action: The upside breakout of the pivot would call for 141.030 and 141.380.
Comment: MACD is below 50 level and Pairs below 20MA.
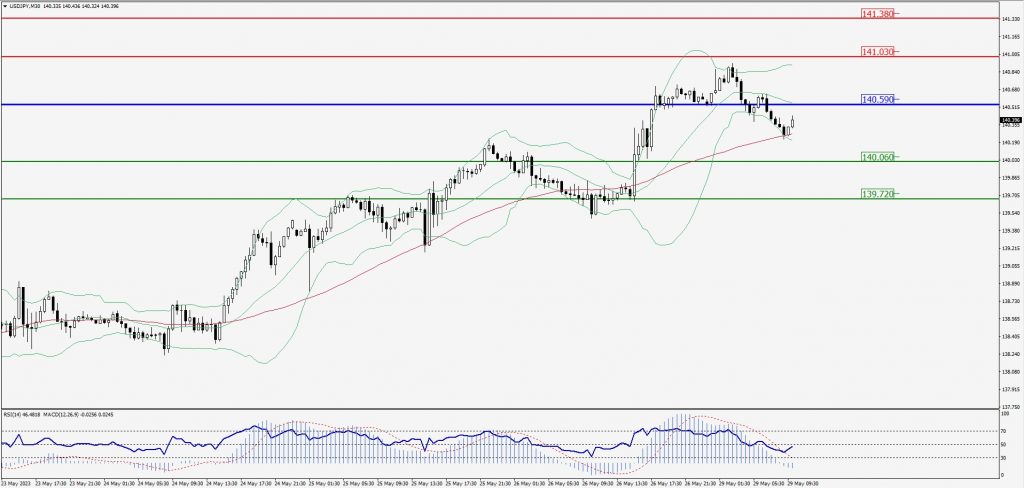
Green Lines Indicate Resistance Levels – Red Lines Indicate Support Levels
Light Blue is a Pivot Point – Black represents the price when the report was produced
AUD/USD Intraday: Support level at 0.65310
Our pivot point is at 0.65310
Preferable Price Action: Buy positions above pivot with targets at 0.65640 & 0.65880 in extension.
Alternative Price Action: Below pivot looks for a further downside with 0.64980 & 0.64750 as targets.
Comment: RSI is above 50 levels and Pairs above its 20MA & 55MA.
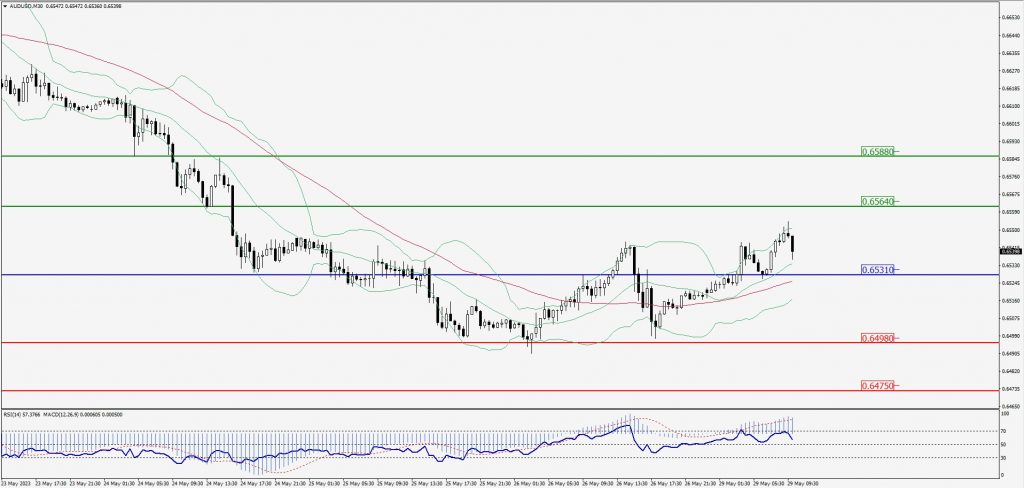
Green Lines Indicate Resistance Levels – Red Lines Indicate Support Levels
Light Blue is a Pivot Point – Black represents the price when the report was produced
CRUDEOIL Intraday: Trend on the upside
Our pivot point is at 73.19
Preferable Price Action: Above pivot buy oil with 74.27 & 75.06 as targets.
Alternative Price Action: Sell crude below pivot with targets at 72.28 and 71.61 in extension.
Comment: MACD is positive territory and Pairs above 55MA.
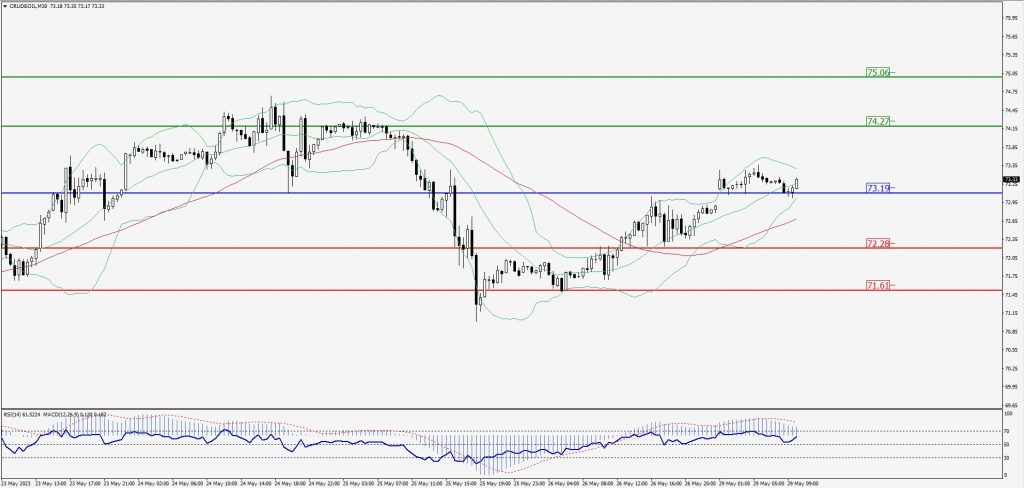
Green Lines Indicate Resistance Levels – Red Lines Indicate Support Levels
Light Blue is a Pivot Point – Black represents the price when the report was produced
XAU/USD Intraday: Trend on the upside
Our pivot point is 1944.20
Preferable Price Action: Further upside to 1958.30 and 1968.60
Alternative Price Action: If the price gives a downside breakout of a pivot, then the price extends to 1931.30 and 1921.90.
Comment: MACD is above 50 level and Pairs above 20MA.
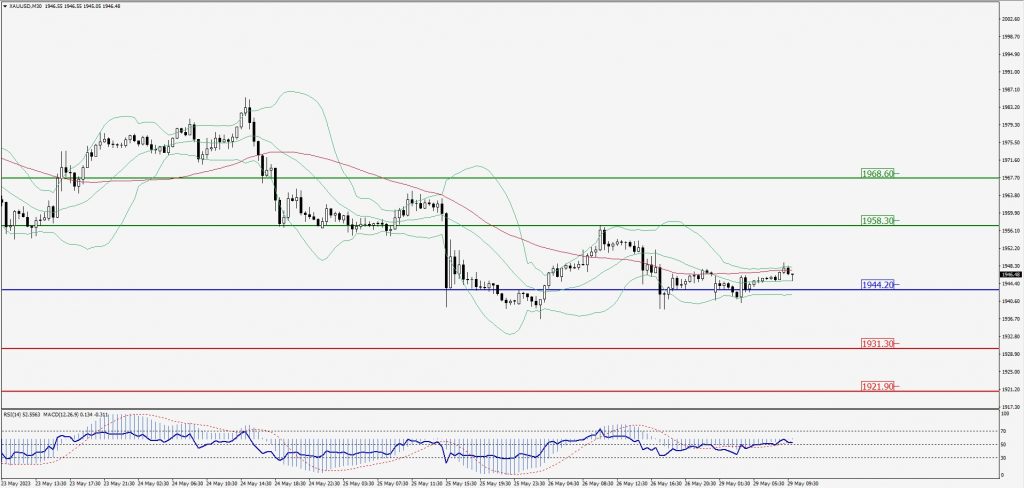
Green Lines Indicate Resistance Levels – Red Lines Indicate Support Levels
Light Blue is a Pivot Point – Black represents the price when the report was produced
Dow Jones Intraday: Major trend on the upside
Our pivot point is 33,173.00
Preferable Price Action: Take buy positions above the pivot with targets at 33,331.00 & 33,438.00.
Alternative Price Action: Below 33,173.00 looks for further downside to 33,034.00 & 32,935.00.
Comment: RSI is above 50 levels and Pairs above its 20MA & 55MA.
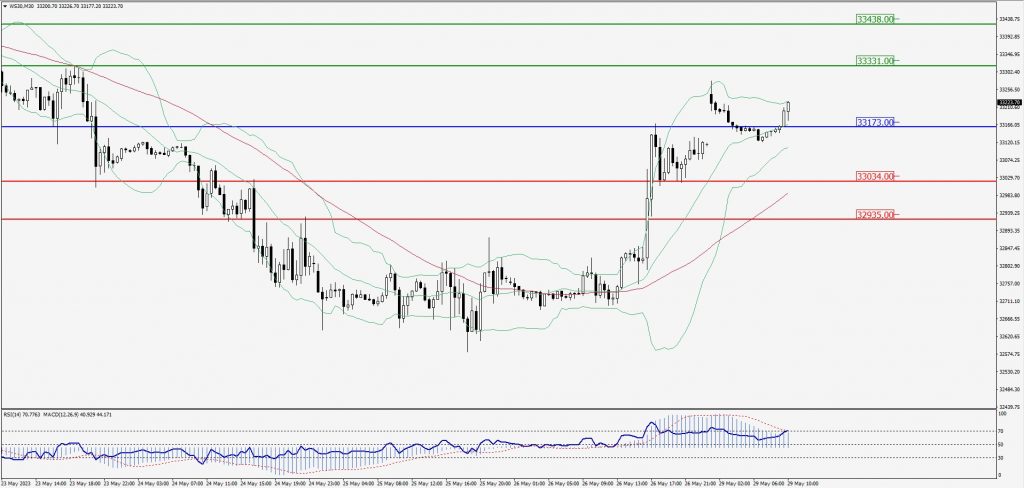
Green Lines Indicate Resistance Levels – Red Lines Indicate Support Levels
Light Blue is a Pivot Point – Black represents the price when the report was produced