Market Wrap: Stocks, Bonds, Commodities
US stocks closed lower on Tuesday and the benchmark Treasury yields extended their rise as mixed economic data, weak corporate results and ongoing debt ceiling negotiations in Washington dampened investor risk appetite.
The Dow Jones Industrial Average fell 336.46 points to 33,012.14, the S&P 500 lose 0.64% to 4,109.90 and the Nasdaq Composite subtract 22.16 points to 12,343.05.
MSCI’s index of Asia-Pacific stocks outside Japan is decline 0.65% to 626.29 levels. The Australian index was lower by 0.49% to 7,199.20. Japanese Nikkei Index advance 0.84% today.
European stocks were mixed on Wednesday, with the Stoxx Europe 50 Index rose 0.05% to 4,317.65, Germany’s DAX advance 0.37% to 15,957.65, and France’s CAC drop 0.09% to 7,398.82 and U.K.’s FTSE 100 add 0.04% to 7,753.15.
Benchmark 10-year U.S. Treasury fell as demand for safe assets ascend again, today 10-year bond yields negative 0.31% to 3.5370.
Oil futures edged lower on Tuesday as weaker-than-expected economic data in China offset a forecast of higher global demand from the International Energy Agency (IEA).
Spot Brent crude oil drop 0.25% to $74.72 per barrel. US West Texas Intermediate crude is down 0.34% to $70.62 a barrel.
The yellow metal gold is decline 0.09% to 1,991.15 dollars per ounce.
Market Wrap: Forex
The U.S. dollar traded higher in early European hours Wednesday following hawkish comments from a number of Fed officials and with the debt ceiling standoff in Washington continuing.
Today, the U.S. dollar index measures the Greenback against a trade-weighted basket of six major currencies, which surged 0.29% to 102.700.
The Euro US Dollar (EUR/USD) is a widely traded pair that is down 0.19% today. This left the pair trading around $1.08420.
The Japanese yen was negative against the U.S. dollar on Wednesday. Today USD/JPY is surged 0.42% to the 136.950 level.
Another commodity-related currency mixed against the U.S dollar, AUD/USD fell 0.14% to 0.66460, and NZD/USD surged 0.21% to 0.62440 level.
EUR/USD Intraday: Trend on the downside
Our pivot point is at 1.08690
Preferable Price Action: Take sell positions below pivot level with targets at 1.08460 & 1.08320 in extension.
Alternative Price Action: Above pivot looks for a further upside to 1.08880 & 1.09010.
Comment: RSI is below 50 levels and Pairs below its 20MA & 55MA.
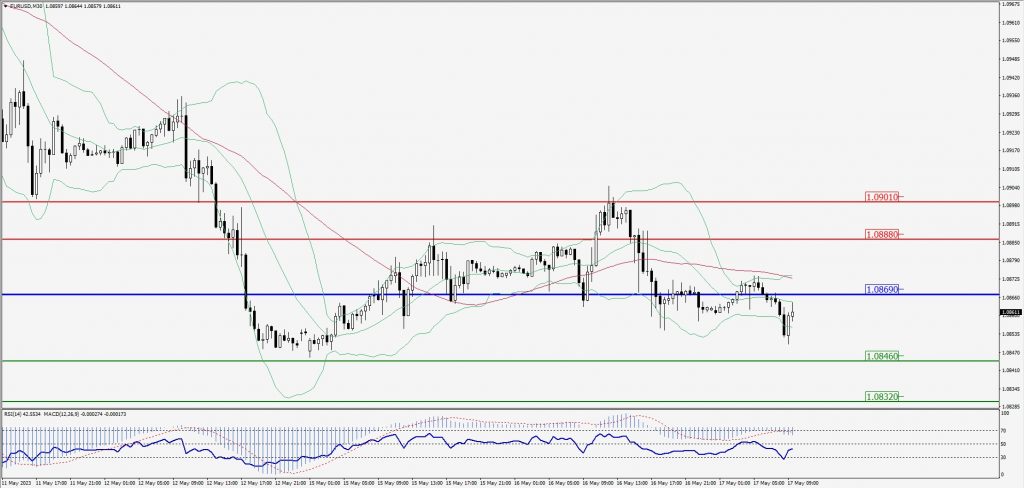
Green Lines Indicate Resistance Levels – Red Lines Indicate Support Levels
Light Blue is a Pivot Point – Black represents the price when the report was produced
GBP/USD Intraday: Major trend on the downside
Our pivot point is at 1.24830
Preferable Price Action: Sell positions below pivot with targets at 1.24340 & 1.24060 in extension.
Alternative Price Action: The price above pivot would call for further upside to 1.25230 & 1.25530.
Comment: RSI is below 50 levels and Pairs below its 20MA & 55MA.
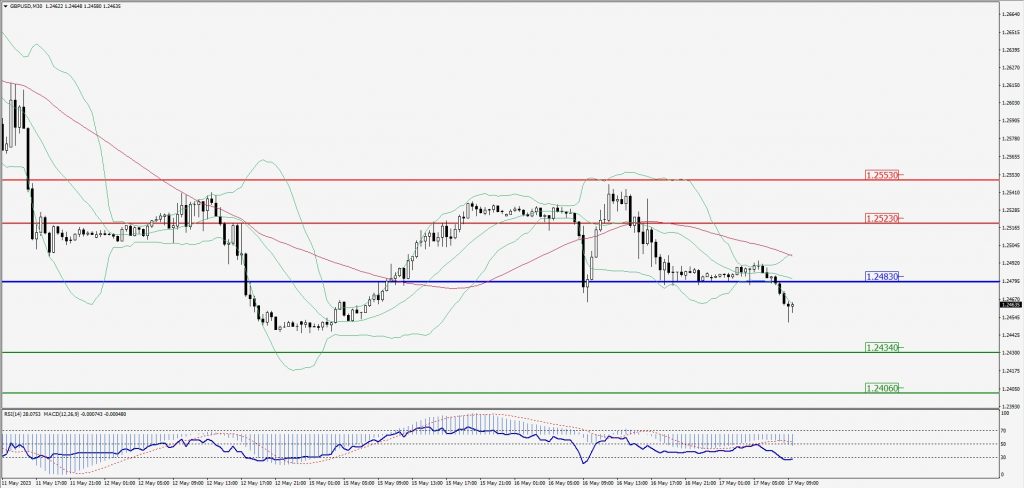
Green Lines Indicate Resistance Levels – Red Lines Indicate Support Levels
Light Blue is a Pivot Point – Black represents the price when the report was produced
USD/JPY Intraday: Major trend on the upside
Our pivot point is at 136.650
Preferable Price Action: Buy position above pivot with the target at 137.240 and 137.690 in extension.
Alternative Price Action: The downside breakout of the pivot would call for 136.100 and 135.690.
Comment: MACD is above 50 level and Pairs above its 20MA & 55MA.
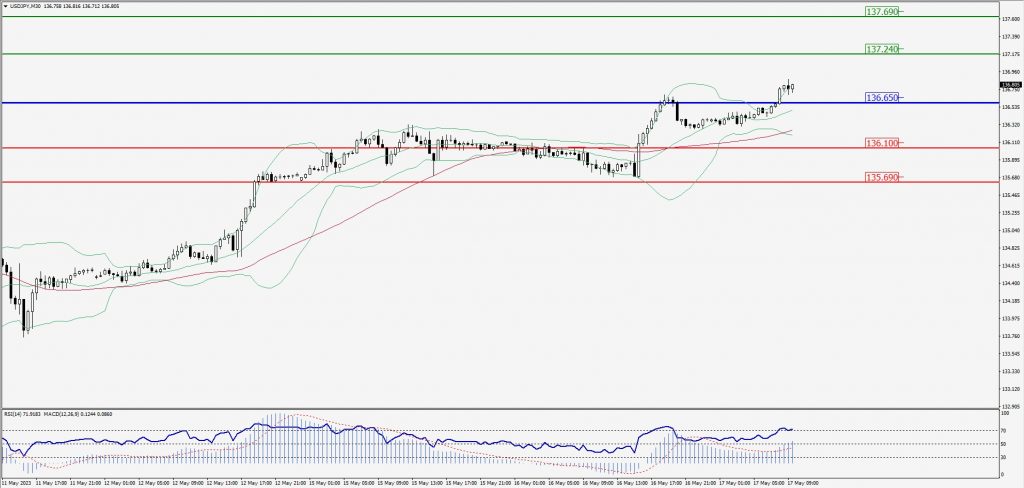
Green Lines Indicate Resistance Levels – Red Lines Indicate Support Levels
Light Blue is a Pivot Point – Black represents the price when the report was produced
AUD/USD Intraday: Trend on the downside
Our pivot point is at 0.66550
Preferable Price Action: Sell positions below pivot with targets at 0.66200 & 0.66000 in extension.
Alternative Price Action: Above pivot looks for a further upside with 0.66840 & 0.67080 as targets.
Comment: RSI is below 50 levels and Pairs below its 20MA & 55MA.
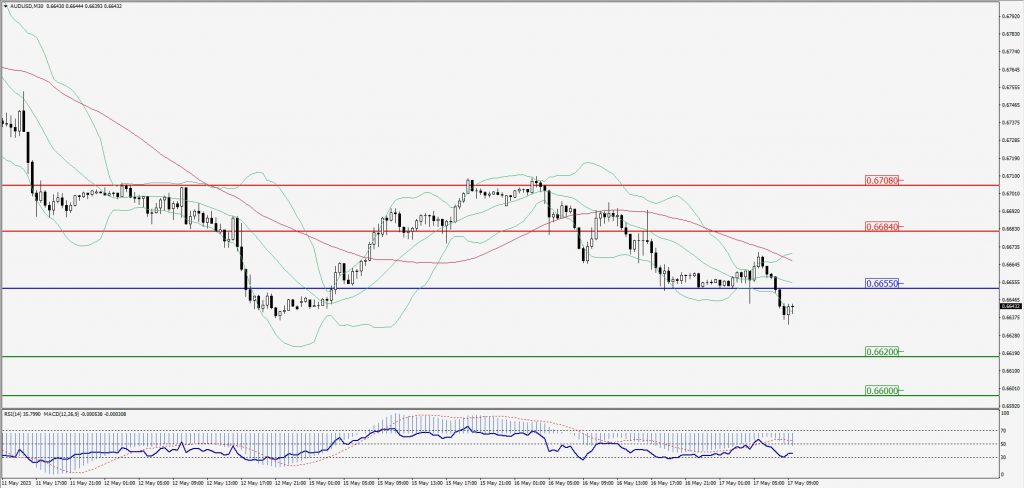
Green Lines Indicate Resistance Levels – Red Lines Indicate Support Levels
Light Blue is a Pivot Point – Black represents the price when the report was produced
CRUDEOIL Intraday: Trend on the downside
Our pivot point is at 70.65
Preferable Price Action: Below pivot sell oil with 69.93 & 69.46 as targets.
Alternative Price Action: Buy crude above pivot with targets at 71.31 and 71.83 in extension.
Comment: MACD is negative territory and Pairs below its 20MA & 55MA.
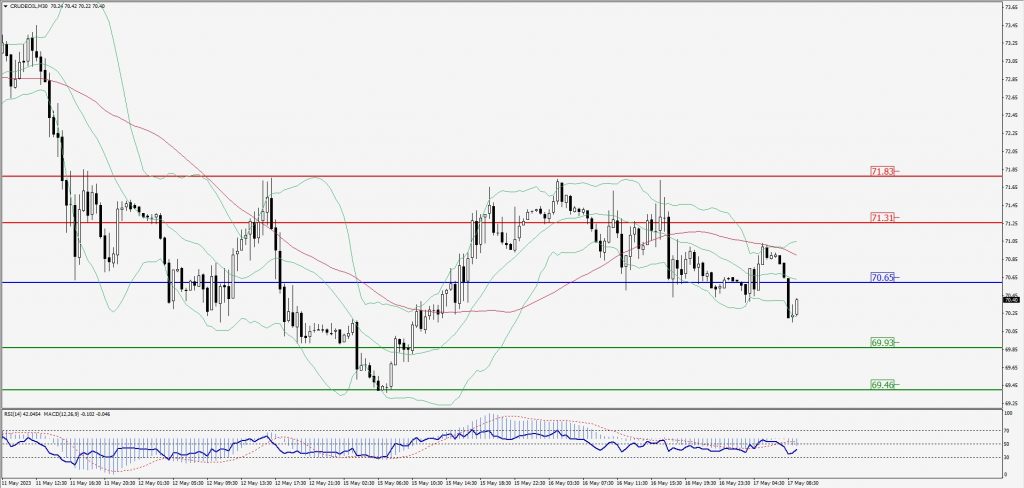
Green Lines Indicate Resistance Levels – Red Lines Indicate Support Levels
Light Blue is a Pivot Point – Black represents the price when the report was produced
XAU/USD Intraday: Resistance level at 1994.20
Our pivot point is 1994.20
Preferable Price Action: Further downside to 1981.20 and 1973.00
Alternative Price Action: If the price gives an upside breakout of a pivot, then the price extends to 2005.00 and 2013.40.
Comment: MACD is below 50 level and Pairs below its 20MA & 55MA.
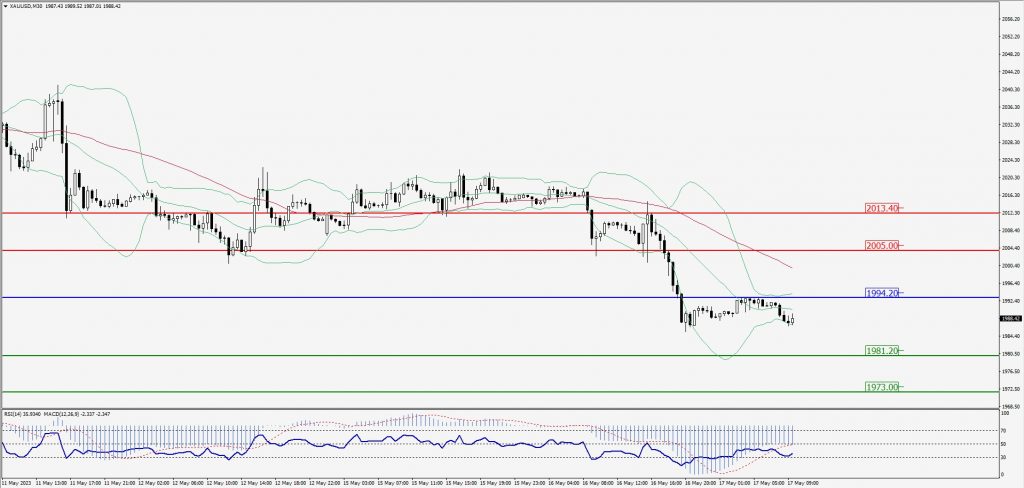
Green Lines Indicate Resistance Levels – Red Lines Indicate Support Levels
Light Blue is a Pivot Point – Black represents the price when the report was produced
Dow Jones Intraday: Trend on the downside
Our pivot point is 33,086.00
Preferable Price Action: Take sell positions below the pivot with targets at 32,929.00 & 32,832.00.
Alternative Price Action: Above 33,086.00 looks for further upside to 33,230.00 & 33,340.00.
Comment: RSI is below 50 levels and Pairs below its 20MA & 55MA.
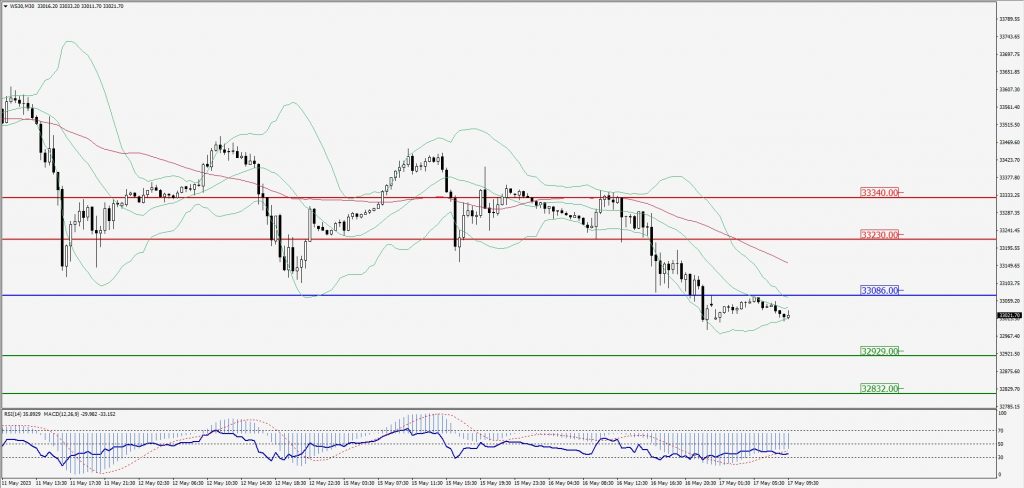
Green Lines Indicate Resistance Levels – Red Lines Indicate Support Levels
Light Blue is a Pivot Point – Black represents the price when the report was produced