Market Wrap: Stocks, Bonds, Commodities
European stock markets traded higher Thursday, with investors optimistic of a deal to lift the U.S. debt ceiling while awaiting comments from ECB chief Christine Lagarde.
The Dow Jones Industrial Average rose 408.63 points to 33,420.77, the S&P 500 gain 1.19% to 4,158.77 and the Nasdaq Composite add 157.51 points to 12,500.57.
MSCI’s index of Asia-Pacific stocks outside Japan is advance 0.54% to 630.17 levels. The Australian index was higher by 0.52% to 7,236.80. Japanese Nikkei Index advance 1.60% today.
European stocks were positive on Thursday, with the Stoxx Europe 50 Index rose 1.01% to 4,366.95, Germany’s DAX advance 1.43% to 16,177.25, and France’s CAC ascend 0.81% to 7,459.74 and U.K.’s FTSE 100 add 0.58% to 7,768.00.
Benchmark 10-year U.S. Treasury fell as demand for safe assets ascend again, today 10-year bond yields positive 0.28% to 3.5920.
Oil prices rose 2 percent on Wednesday as optimism on oil demand and U.S. debt ceiling negotiations outweighed supply concerns.
Spot Brent crude oil drop 0.42% to $76.65 per barrel. US West Texas Intermediate crude is down 0.37% to $72.56 a barrel.
The yellow metal gold is decline 0.30% to 1,978.85 dollars per ounce.
Market Wrap: Forex
The U.S. dollar held near a seven-week peak on Thursday after President Joe Biden and top U.S. congressional Republican Kevin McCarthy worked towards avoiding a damaging debt default, while investors scaled back Federal Reserve easing expectations.
Today, the U.S. dollar index measures the Greenback against a trade-weighted basket of six major currencies, which surged 0.23% to 102.960.
The Euro US Dollar (EUR/USD) is a widely traded pair that is down 0.21% today. This left the pair trading around $1.08170.
The Japanese yen was negative against the U.S. dollar on Thursday. Today USD/JPY is surged 0.07% to the 137.780 level.
Another commodity-related currency negative against the U.S dollar, AUD/USD fell 0.39% to 0.66340, and NZD/USD slipped 0.14% to 0.62400 level.
EUR/USD Intraday: Trend on the downside
Our pivot point is at 1.08380
Preferable Price Action: Take sell positions below pivot level with targets at 1.08120 & 1.07960 in extension.
Alternative Price Action: Above pivot looks for a further upside to 1.08600 & 1.08780.
Comment: RSI is below 50 levels and Pairs below its 20MA & 55MA.
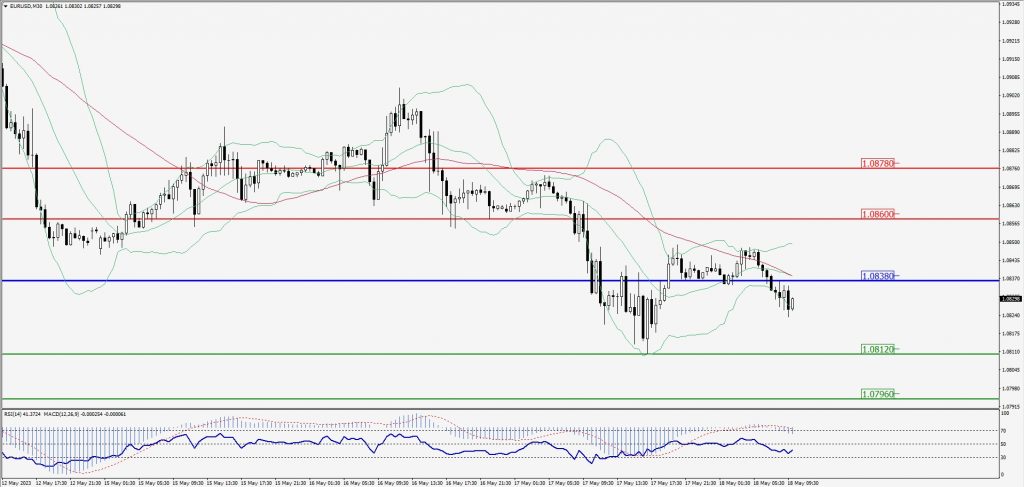
Green Lines Indicate Resistance Levels – Red Lines Indicate Support Levels
Light Blue is a Pivot Point – Black represents the price when the report was produced
GBP/USD Intraday: Trend on the downside
Our pivot point is at 1.24780
Preferable Price Action: Sell positions below pivot with targets at 1.24450 & 1.24260 in extension.
Alternative Price Action: The price above pivot would call for further upside to 1.25100 & 1.25300.
Comment: RSI is below 50 levels and Pairs below its 20MA & 55MA.
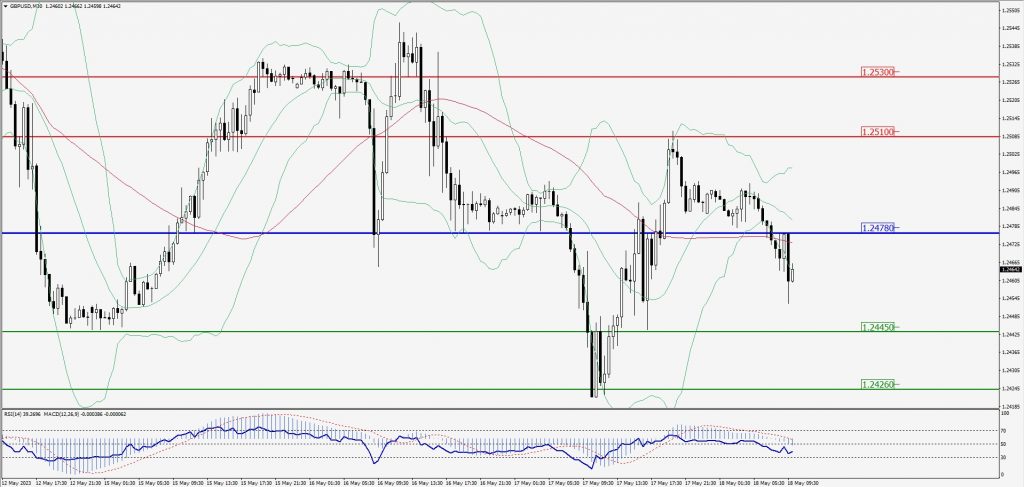
Green Lines Indicate Resistance Levels – Red Lines Indicate Support Levels
Light Blue is a Pivot Point – Black represents the price when the report was produced
USD/JPY Intraday: Support level at 137.410
Our pivot point is at 137.410
Preferable Price Action: Buy position above pivot with the target at 137.990 and 138.410 in extension.
Alternative Price Action: The downside breakout of the pivot would call for 136.900 and 136.540.
Comment: MACD is above 50 level and Pairs above 55MA.
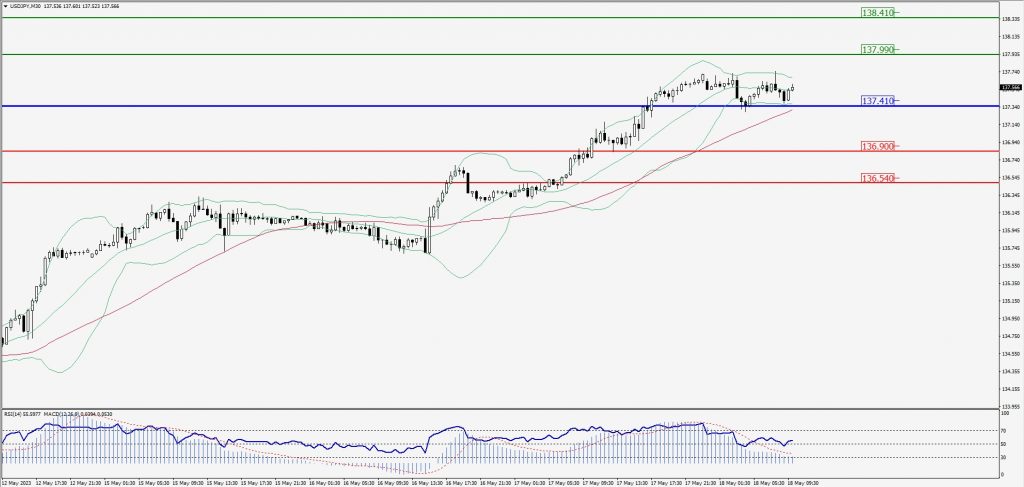
Green Lines Indicate Resistance Levels – Red Lines Indicate Support Levels
Light Blue is a Pivot Point – Black represents the price when the report was produced
AUD/USD Intraday: Trend on the downside
Our pivot point is at 0.66480
Preferable Price Action: Sell positions below pivot with targets at 0.66220 & 0.66070 in extension.
Alternative Price Action: Above pivot looks for a further upside with 0.66710 & 0.66880 as targets.
Comment: RSI is below 50 levels and Pairs below its 20MA & 55MA.
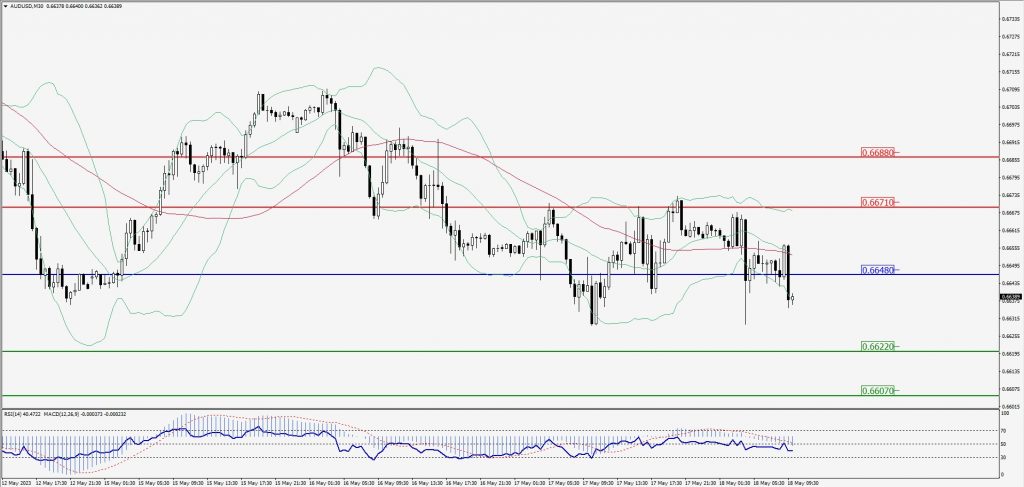
Green Lines Indicate Resistance Levels – Red Lines Indicate Support Levels
Light Blue is a Pivot Point – Black represents the price when the report was produced
CRUDEOIL Intraday: Trend on the upside
Our pivot point is at 72.46
Preferable Price Action: Above pivot buy oil with 73.18 & 73.73 as targets.
Alternative Price Action: Sell crude below pivot with targets at 71.83 and 71.33 in extension.
Comment: MACD is positive territory and Pairs above 55MA.
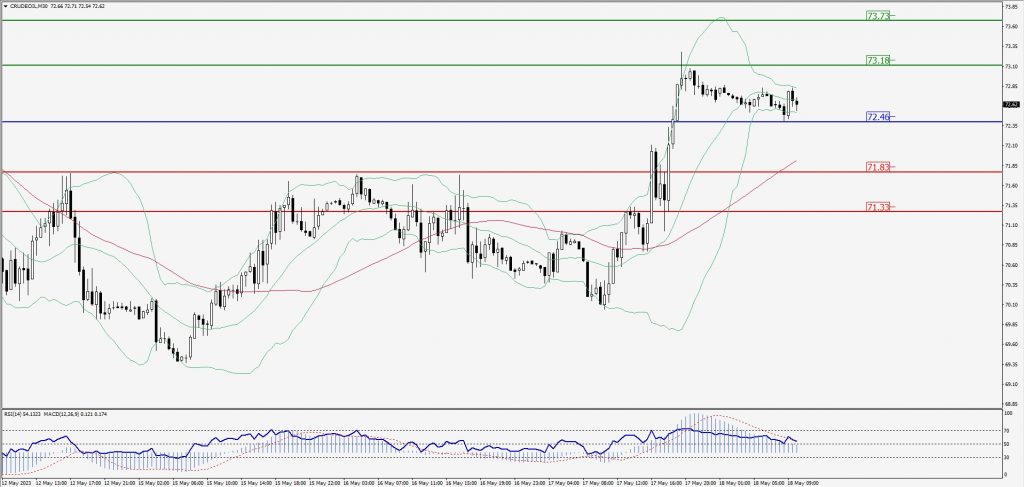
Green Lines Indicate Resistance Levels – Red Lines Indicate Support Levels
Light Blue is a Pivot Point – Black represents the price when the report was produced
XAU/USD Intraday: Resistance level at 1982.50
Our pivot point is 1982.50
Preferable Price Action: Further downside to 1970.70 and 1962.50
Alternative Price Action: If the price gives an upside breakout of a pivot, then the price extends to 1992.60 and 2000.80.
Comment: MACD is below 50 level and Pairs below its 20MA & 55MA.
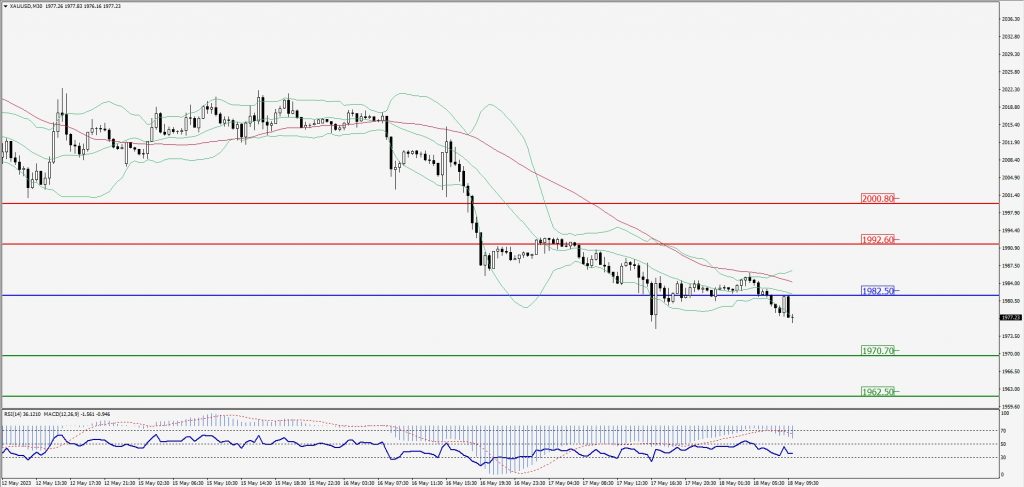
Green Lines Indicate Resistance Levels – Red Lines Indicate Support Levels
Light Blue is a Pivot Point – Black represents the price when the report was produced
Dow Jones Intraday: Trend on the upside
Our pivot point is 33,364.00
Preferable Price Action: Take buy positions above the pivot with targets at 33,440.00 & 33,496.00.
Alternative Price Action: Below 33,364.00 looks for further downside to 33,298.00 & 33,251.00.
Comment: RSI is above 50 levels and Pairs above 55MA.
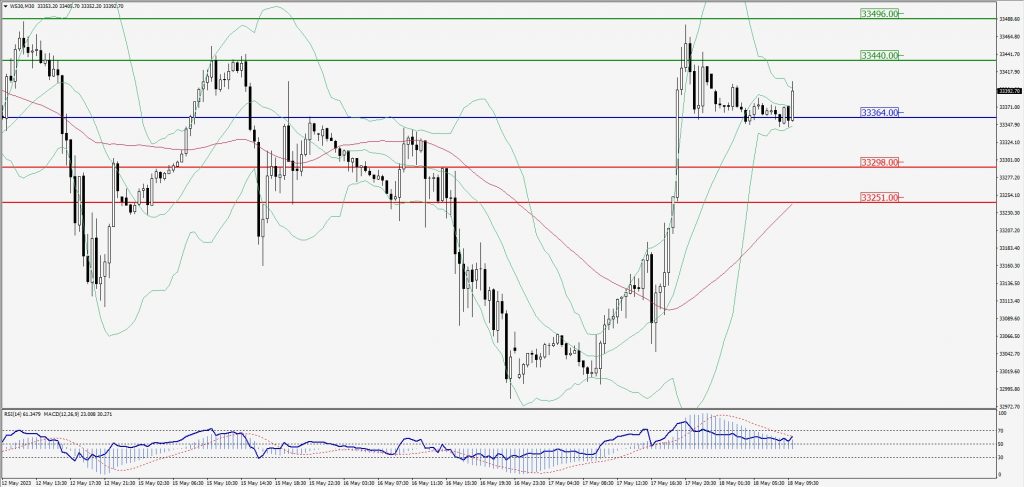
Green Lines Indicate Resistance Levels – Red Lines Indicate Support Levels
Light Blue is a Pivot Point – Black represents the price when the report was produced