Market Wrap: Stocks, Bonds, Commodities
Stock futures ticked downward Tuesday night as traders weighed the latest round of earnings.
The Dow Jones Industrial Average fell 10.55 points to 33,976.63, the S&P 500 gain 0.09% to 4,154.87 and the Nasdaq Composite subtarct 4.31 points to 12,153.41.
MSCI’s index of Asia-Pacific stocks outside Japan is decline 0.80% to 641.96 levels. The Australian index was higher by 0.07% to 7,365.50. Japanese Nikkei Index decline 0.18% today.
European stocks were negative on Wednesday, with the Stoxx Europe 50 Index fell 0.33% to 4,379.45, Germany’s DAX decline 0.29% to 15,837.65, and France’s CAC drop 0.09% to 7,526.29, and U.K.’s FTSE 100 subtract 0.31% to 7,885.15.
Benchmark 10-year U.S. Treasury fell as demand for safe assets ascend again, today 10-year bond yields are positive 1.22% to 3.6160.
Oil prices rose in early Asian trade on Wednesday as US crude inventories were seen falling and on strong Chinese economic data, signaling strengthening fuel demand.
Spot Brent crude oil drop 0.87% to $84.03 per barrel. US West Texas Intermediate crude is down 0.83% to $80.22 a barrel.
The yellow metal gold is advance 0.84% to 2,002.55 dollars per ounce.
Market Wrap: Forex
The U.S. dollar stabilized in early European trade Wednesday, with traders trying to work out the likely path of the Federal Reserve’s monetary policy by digesting economic data and comments from policy makers.
Today, the U.S. dollar index measures the Greenback against a trade-weighted basket of six major currencies, which surge 0.15% to 101.600.
The Euro US Dollar (EUR/USD) is a widely traded pair that is down 0.12% today. This left the pair trading around $1.09580.
The Japanese yen was negative against the U.S. dollar on Wednesday. Today USD/JPY is surged 0.50% to the 134.760 level.
Another commodity-related currency negative against the U.S dollar, AUD/USD fell 0.13% to 0.67130, and NZD/USD slipped 0.16% to 0.61970 level.
EUR/USD Intraday: Trend on the downside
Our pivot point is at 1.09700
Preferable Price Action: Take sell positions below pivot level with targets at 1.09370 & 1.09180 in extension.
Alternative Price Action: Above pivot looks for a further upside to 1.10000 & 1.10180.
Comment: RSI is below 50 levels and Pairs below its 20MA & 55MA.
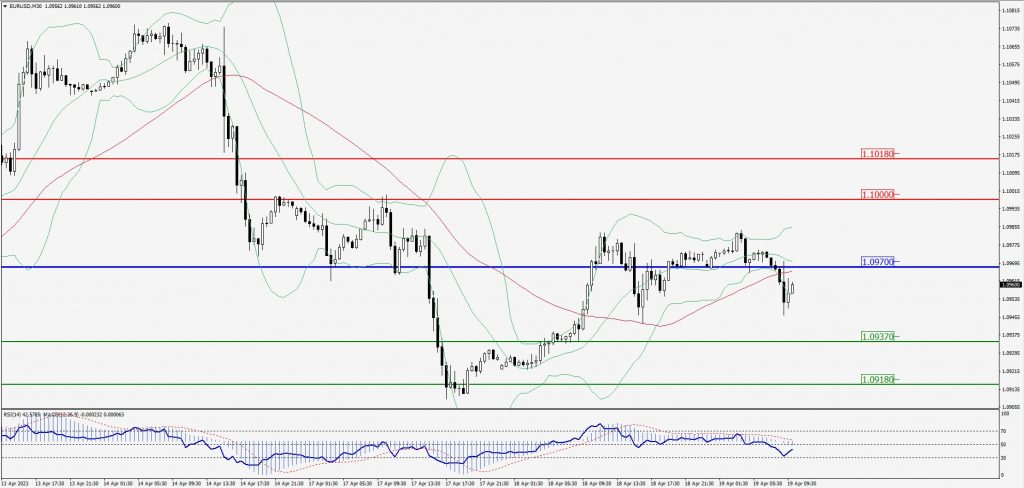
Green Lines Indicate Resistance Levels – Red Lines Indicate Support Levels
Light Blue is a Pivot Point – Black represents the price when the report was produced
GBP/USD Intraday: Major trend on the upside
Our pivot point is at 1.24350
Preferable Price Action: Buy positions above pivot with targets at 1.24790 & 1.25060 in extension.
Alternative Price Action: The price below pivot would call for further downside to 1.23980 & 1.23700.
Comment: RSI is above 50 levels and Pairs above its 20MA & 55MA.
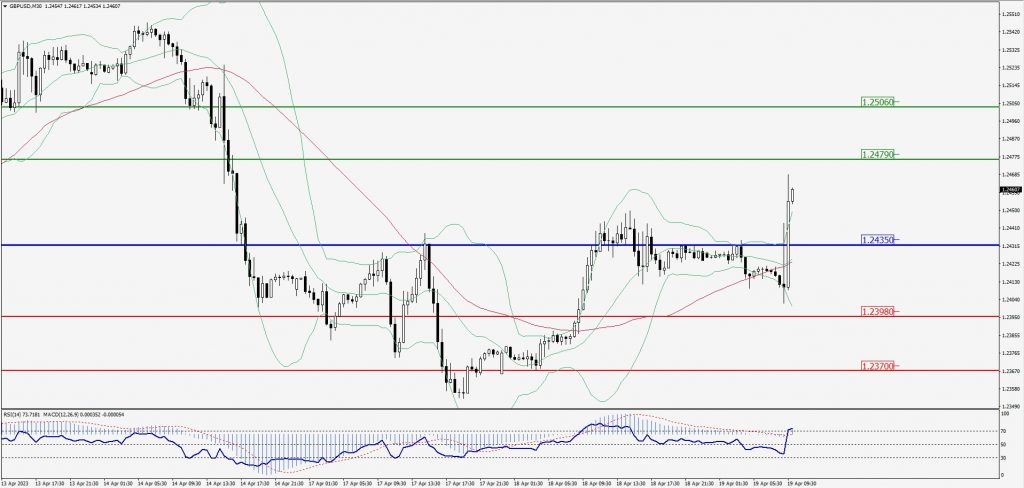
Green Lines Indicate Resistance Levels – Red Lines Indicate Support Levels
Light Blue is a Pivot Point – Black represents the price when the report was produced
USD/JPY Intraday: Trend on the upside
Our pivot point is at 134.490
Preferable Price Action: Buy position above pivot with the target at 134.950 and 135.260 in extension.
Alternative Price Action: The downside breakout of the pivot would call for 134.110 and 133.790.
Comment: MACD is above 50 level and Pairs above its 20MA & 55MA.
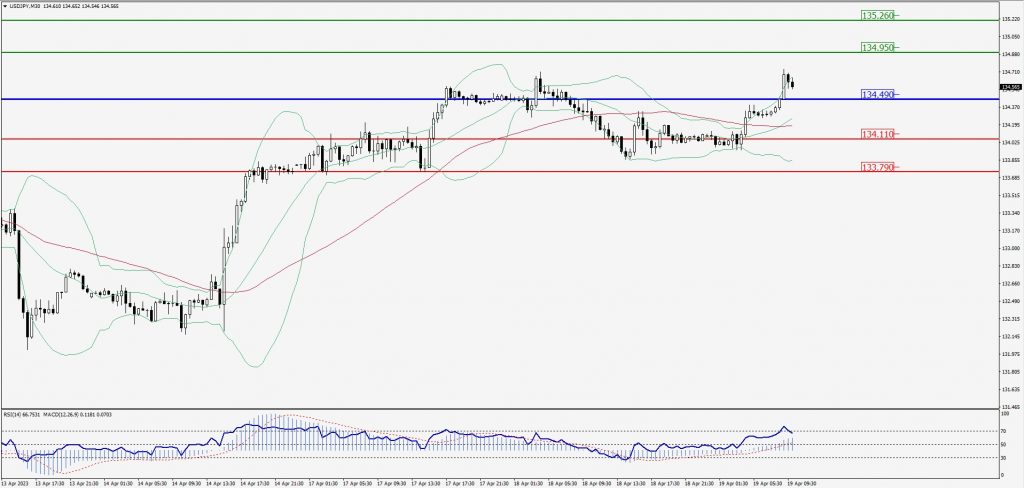
Green Lines Indicate Resistance Levels – Red Lines Indicate Support Levels
Light Blue is a Pivot Point – Black represents the price when the report was produced
AUD/USD Intraday: Resistance level at 0.67350
Our pivot point is at 0.67350
Preferable Price Action: Sell positions below pivot with targets at 0.67090 & 0.66940 in extension.
Alternative Price Action: Above pivot looks for a further upside with 0.67550 & 0.67700 as targets.
Comment: RSI is below 50 levels and Pairs below its 20MA & 55MA.
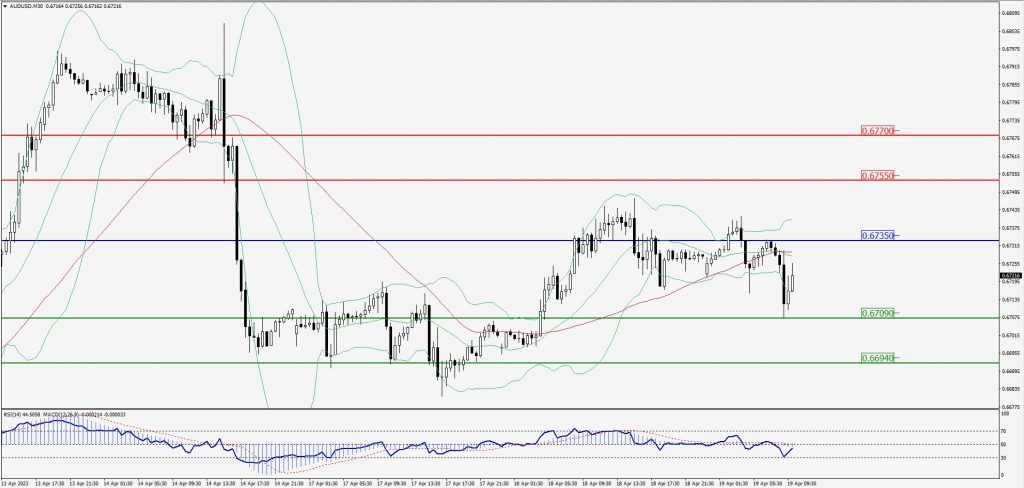
Green Lines Indicate Resistance Levels – Red Lines Indicate Support Levels
Light Blue is a Pivot Point – Black represents the price when the report was produced
CRUDEOIL Intraday: Trend on the downside
Our pivot point is at 80.61
Preferable Price Action: Below pivot sell oil with 80.09 & 79.75 as targets.
Alternative Price Action: Buy crude above pivot with targets at 81.09 and 81.47 in extension.
Comment: MACD is negative territory and Pairs below its 20MA & 55MA.
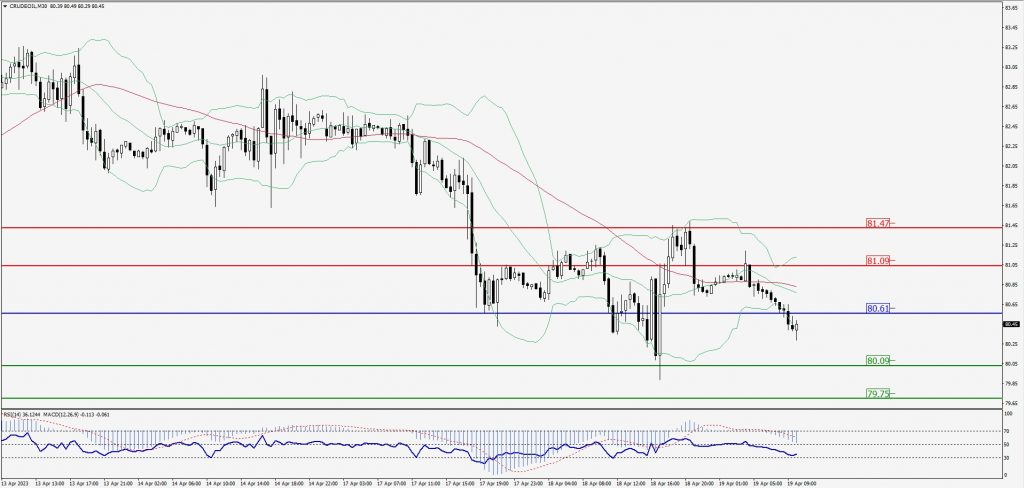
Green Lines Indicate Resistance Levels – Red Lines Indicate Support Levels
Light Blue is a Pivot Point – Black represents the price when the report was produced
XAU/USD Intraday: Trend on the downside
Our pivot point is 1999.20
Preferable Price Action: Further downside to 1987.20 and 1979.80
Alternative Price Action: If the price gives an upside breakout of a pivot, then the price extends to 2010.30 and 2017.80.
Comment: MACD is below 50 level and Pairs below its 20MA & 55MA.
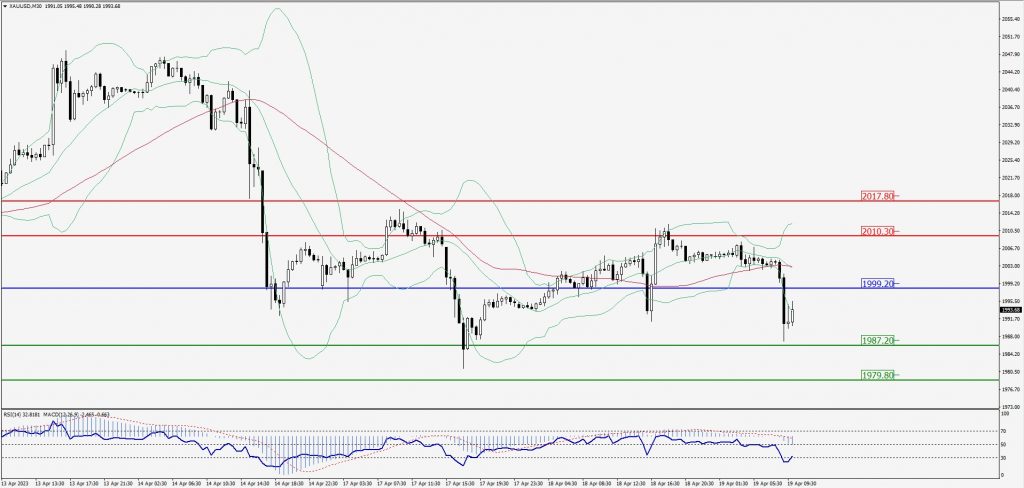
Green Lines Indicate Resistance Levels – Red Lines Indicate Support Levels
Light Blue is a Pivot Point – Black represents the price when the report was produced
Dow Jones Intraday: Trend on the downside
Our pivot point is 33,938.00
Preferable Price Action: Take sell positions below the pivot with targets at 33,850.00 & 33,798.00.
Alternative Price Action: Above 33,938.00 looks for further upside to 34,011.00 & 34,066.00.
Comment: RSI is below 50 levels and Pairs below its 20MA & 55MA.
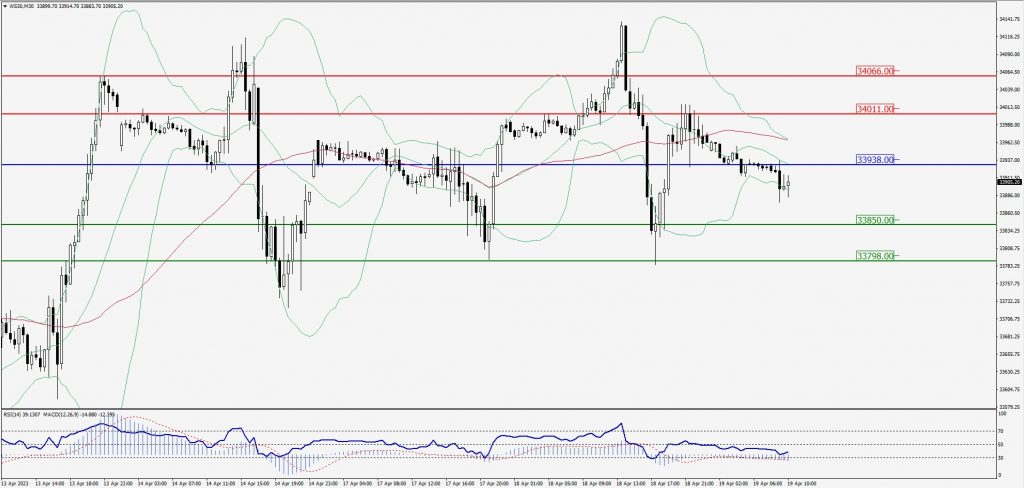
Green Lines Indicate Resistance Levels – Red Lines Indicate Support Levels
Light Blue is a Pivot Point – Black represents the price when the report was produced