Market Wrap: Stocks, Bonds, Commodities
US stock futures traded flat on Monday after the major averages rose to kick off a stacked week of corporate earnings. Dow Jones Industrial Average futures and S&P 500 futures were little changed.
The Dow Jones Industrial Average rose 100.71 points to 33,987.18, the S&P 500 gain 0.33% to 4,151.32 and the Nasdaq Composite add 34.26 points to 12,157.72.
MSCI’s index of Asia-Pacific stocks outside Japan is decline 0.53% to 645.66 levels. The Australian index was lower by 0.29% to 7,360.20. Japanese Nikkei Index advance 0.51% today.
European stocks were positive on Tuesday, with the Stoxx Europe 50 Index rose 0.44% to 4,386.75, Germany’s DAX advance 0.28% to 15,834.75, and France’s CAC ascend 0.40% to 7,528.47, and U.K.’s FTSE 100 add 0.22% to 7,897.05.
Benchmark 10-year U.S. Treasury fell as demand for safe assets ascend again, today 10-year bond yields are positive 0.26% to 3.6000.
Oil prices turned lower on Monday as the U.S. dollar strengthened and as investors mulled over a possible May interest rate hike by the U.S. Federal Reserve, which could dampen economic recovery hopes.
Spot Brent crude oil drop 0.40% to $84.42 per barrel. US West Texas Intermediate crude is down 0.35% to $80.47 a barrel.
The yellow metal gold is advance 0.42% to 2,015.50 dollars per ounce.
Market Wrap: Forex
The dollar slipped on Tuesday after better-than-forecast growth data from China, while upbeat pay data from Britain supported the pound.
Today, the U.S. dollar index measures the Greenback against a trade-weighted basket of six major currencies, which slipped 0.42% to 101.360.
The Euro US Dollar (EUR/USD) is a widely traded pair that is up 0.50% today. This left the pair trading around $1.09810.
The Japanese yen was negative against the U.S. dollar on Tuesday. Today USD/JPY is slipped 0.23% to the 134.140 level.
Another commodity-related currency negative against the U.S dollar, AUD/USD rose 0.54% to 0.67370, and NZD/USD surged 0.50% to 0.62110 level.
EUR/USD Intraday: Trend on the upside
Our pivot point is at 1.09530
Preferable Price Action: Take buy positions above pivot level with targets at 1.09870 & 1.10100 in extension.
Alternative Price Action: Below pivot looks for a further downside to 1.09180 & 1.08930.
Comment: RSI is above 50 levels and Pairs above its 20MA & 55MA.
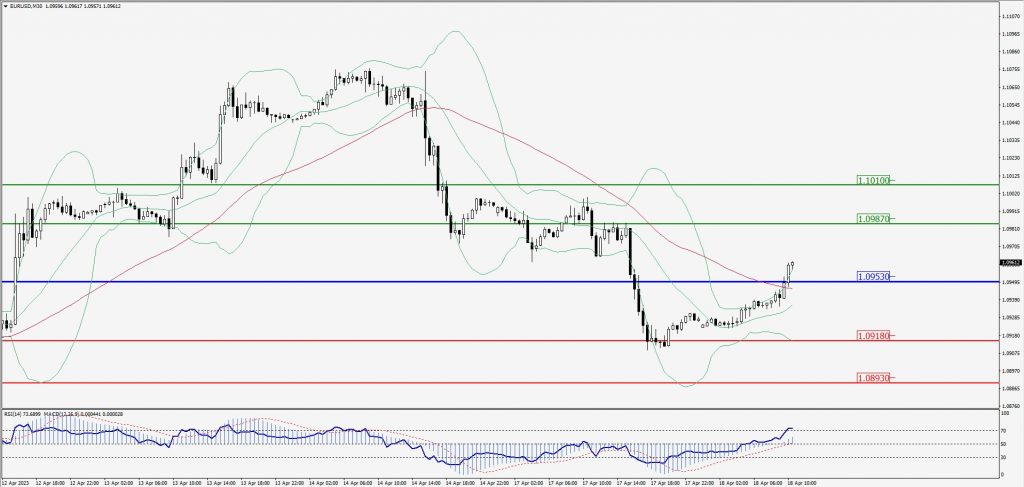
Green Lines Indicate Resistance Levels – Red Lines Indicate Support Levels
Light Blue is a Pivot Point – Black represents the price when the report was produced
GBP/USD Intraday: Major trend on the upside
Our pivot point is at 1.24050
Preferable Price Action: Buy positions above pivot with targets at 1.24390 & 1.24640 in extension.
Alternative Price Action: The price below pivot would call for further downside to 1.23760 & 1.23570.
Comment: RSI is above 50 levels and Pairs above its 20MA & 55MA.
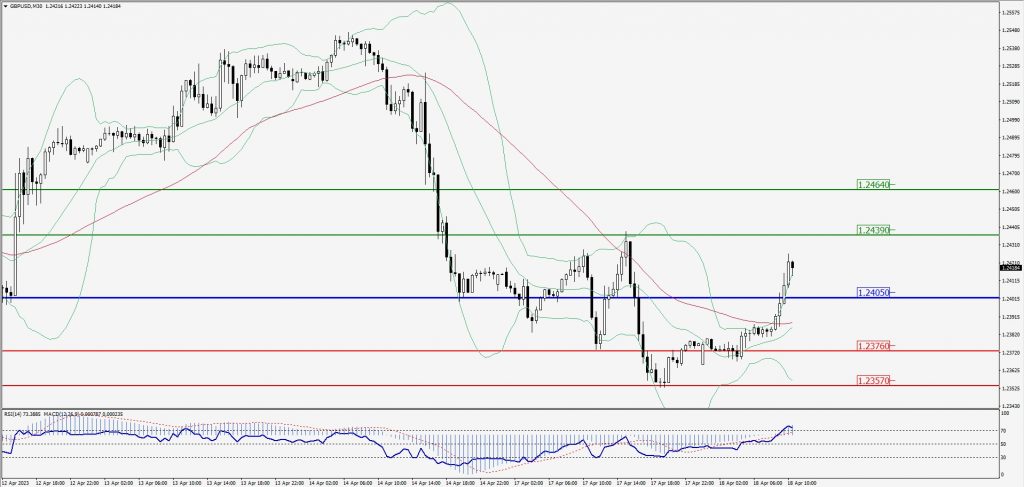
Green Lines Indicate Resistance Levels – Red Lines Indicate Support Levels
Light Blue is a Pivot Point – Black represents the price when the report was produced
USD/JPY Intraday: Trend on the downside
Our pivot point is at 134.470
Preferable Price Action: Sell position below pivot with the target at 134.070 and 133.830 in extension.
Alternative Price Action: The upside breakout of the pivot would call for 134.810 and 135.070.
Comment: MACD is below 50 level and Pairs below 20MA.
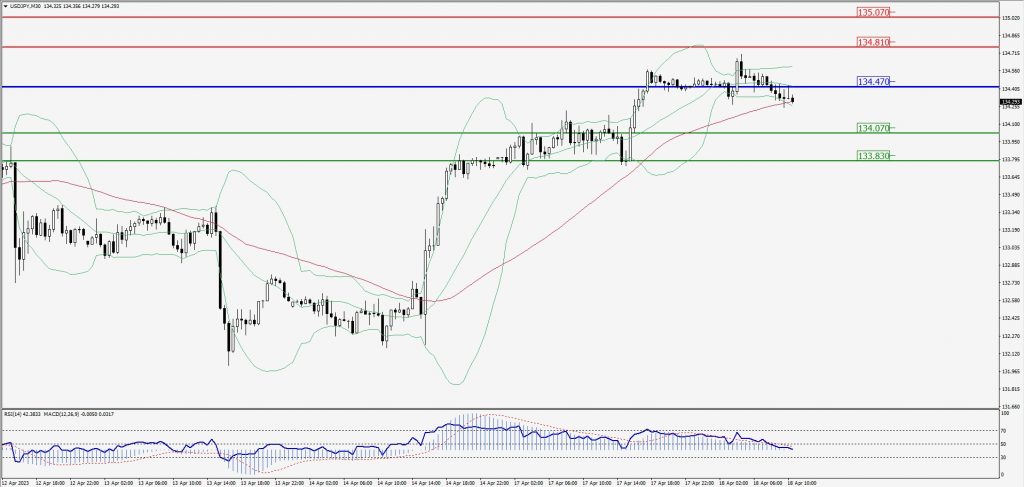
Green Lines Indicate Resistance Levels – Red Lines Indicate Support Levels
Light Blue is a Pivot Point – Black represents the price when the report was produced
AUD/USD Intraday: Trend on the upside
Our pivot point is at 0.67240
Preferable Price Action: Buy positions above pivot with targets at 0.67510 & 0.67740 in extension.
Alternative Price Action: Below pivot looks for a further downside with 0.66990 & 0.66800 as targets.
Comment: RSI is above 50 levels and Pairs above its 20MA & 55MA.
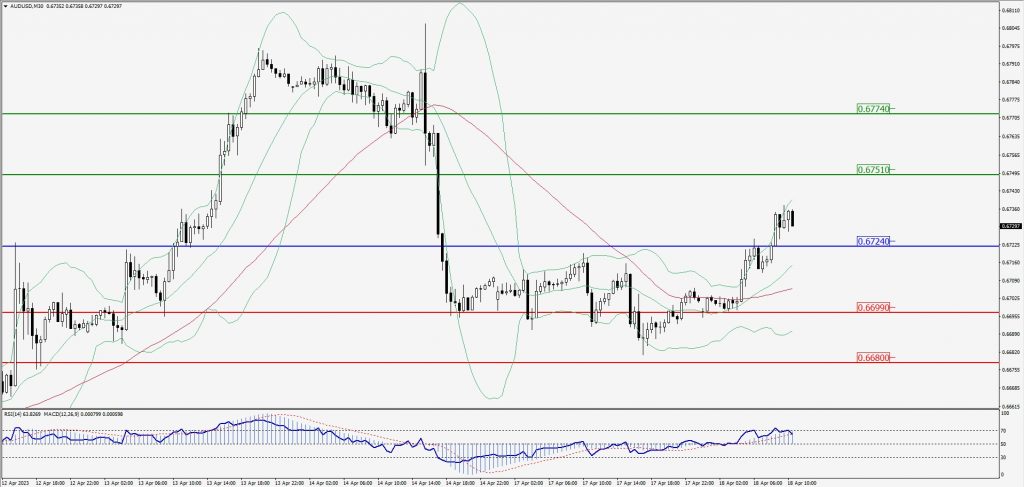
Green Lines Indicate Resistance Levels – Red Lines Indicate Support Levels
Light Blue is a Pivot Point – Black represents the price when the report was produced
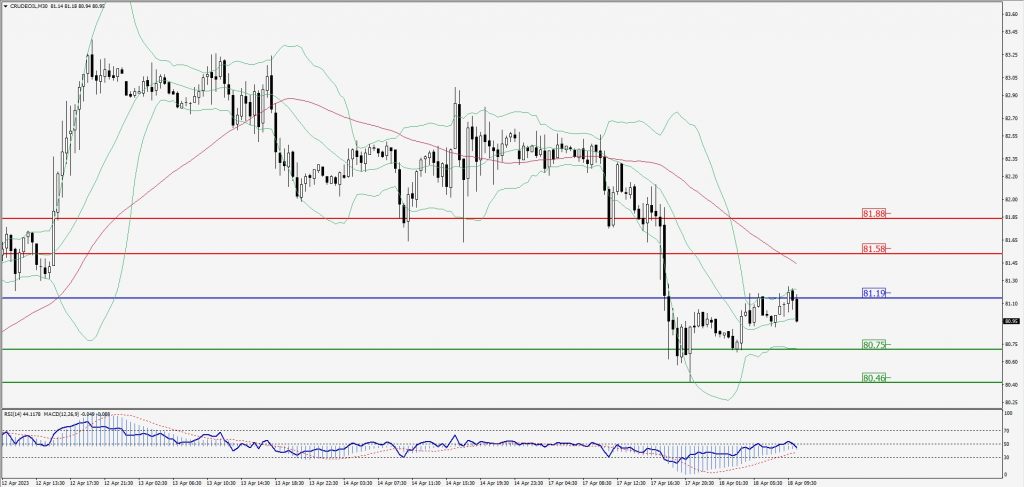
CRUDEOIL Intraday: Resistance level at 81.19
Our pivot point is at 81.19
Preferable Price Action: Below pivot sell oil with 80.75 & 80.46 as targets.
Alternative Price Action: Buy crude above pivot with targets at 81.58 and 81.88 in extension.
Comment: MACD is negative territory and Pairs below 55MA.
Green Lines Indicate Resistance Levels – Red Lines Indicate Support Levels
Light Blue is a Pivot Point – Black represents the price when the report was produced
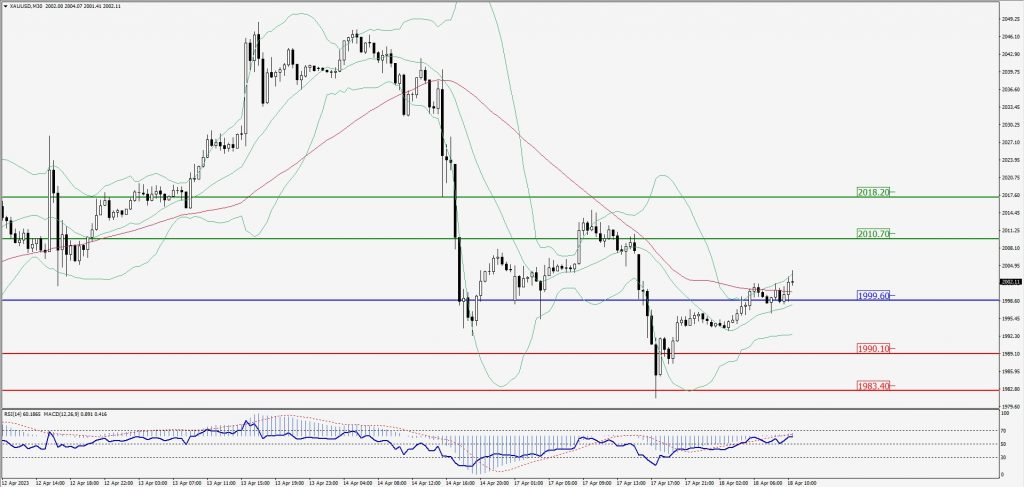
XAU/USD Intraday: Support level at 1999.60
Our pivot point is 1999.60
Preferable Price Action: Further upside to 2010.70 and 2018.20
Alternative Price Action: If the price gives a downside breakout of a pivot, then the price extends to 1990.10 and 1983.40.
Comment: MACD is above 50 level and Pairs above its 20MA & 55MA.
Green Lines Indicate Resistance Levels – Red Lines Indicate Support Levels
Light Blue is a Pivot Point – Black represents the price when the report was produced
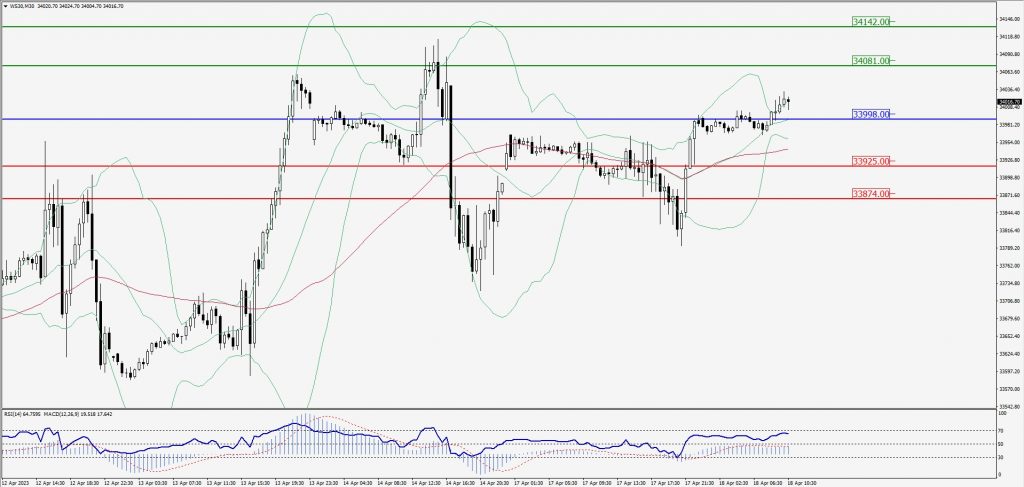
Dow Jones Intraday: Trend on the upside
Our pivot point is 33,998.00
Preferable Price Action: Take buy positions above the pivot with targets at 34,081.00 & 34,142.00.
Alternative Price Action: Below 33,998.00 looks for further downside to 33,925.00 & 33,874.00.
Comment: RSI is above 50 levels and Pairs above its 20MA & 55MA.
Green Lines Indicate Resistance Levels – Red Lines Indicate Support Levels
Light Blue is a Pivot Point – Black represents the price when the report was produced