Market Wrap: Stocks, Bonds, Commodities
U.S. safety authorities said on Friday they are investigating whether an advanced driver assistance system was in use when a Tesla struck a 17-year-old student that exited a school bus in North Carolina.
The Dow Jones Industrial Average rose 2.57 points to 33,485.29, the S&P 500 gain 0.36% to 4,105.02 and the Nasdaq Composite add 91.10 points to 12,087.96.
MSCI’s index of Asia-Pacific stocks outside Japan is advance 0.23% to 643.85 levels. The Australian index was lower by 0.25% to 7,219.00. Japanese Nikkei Index advance 0.42% today.
European stocks were negative on Monday, with the Stoxx Europe 50 Index rose 0.26% to 4,309.45, Germany’s DAX advance 0.50% to 15,597.89, and France’s CAC ascend 0.12% to 7,324.75, and U.K.’s FTSE 100 add 1.03% to 7,324.75.
Benchmark 10-year U.S. Treasury fell as demand for safe assets ascend again, today 10-year bond yields are negative 0.60% to 3.3630.
Oil steadied on Monday, after rising for three straight weeks, as looming supply cuts from Saudi Arabia and other OPEC+ producers balanced concern about weakening global growth that may dampen fuel demand.
Spot Brent crude oil ascend 0.15% to $85.25 per barrel. US West Texas Intermediate crude is up 0.24% to $80.88 a barrel.
The yellow metal gold is decline 0.68% to 2,012.65 dollars per ounce.
Market Wrap: Forex
The dollar strengthened on Friday after data showed an increase in jobs in the world’s largest economy last month, suggesting that the Federal Reserve may have to raise interest rates next month.
Today, the U.S. dollar index measures the Greenback against a trade-weighted basket of six major currencies, which slipped 0.02% to 101.720.
The Euro US Dollar (EUR/USD) is a widely traded pair that is up 0.11% today. This left the pair trading around $1.09090.
The Japanese yen was negative against the U.S. dollar on Monday. Today USD/JPY is slipped 0.01% to the 132.120 level.
Another commodity-related currency mixed against the U.S dollar, AUD/USD fell 0.03% to 0.66660, and NZD/USD surged 0.03% to 0.62450 level.
EUR/USD Intraday: Trend on the upside
Our pivot point is at 1.09060
Preferable Price Action: Take buy positions above pivot level with targets at 1.09340 & 1.09530 in extension.
Alternative Price Action: Below pivot looks for a further downside to 1.08800 & 1.08620.
Comment: RSI is above 50 levels and Pairs above its 20MA & 55MA.
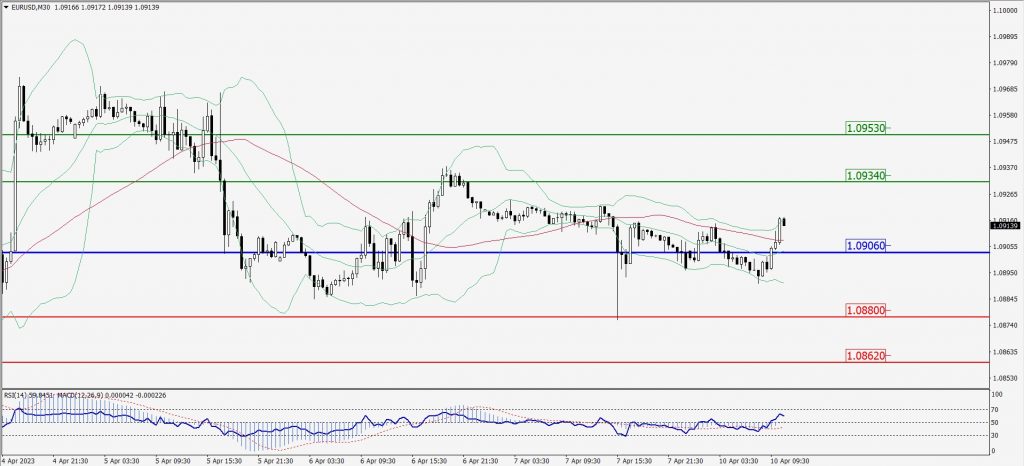
Green Lines Indicate Resistance Levels – Red Lines Indicate Support Levels
Light Blue is a Pivot Point – Black represents the price when the report was produced
GBP/USD Intraday: Support level at 1.24190
Our pivot point is at 1.24190
Preferable Price Action: Buy positions above pivot with targets at 1.24520 & 1.24770 in extension.
Alternative Price Action: The price below pivot would call for further downside to 1.23900 & 1.23690.
Comment: RSI is above 50 levels and Pairs above 20MA.
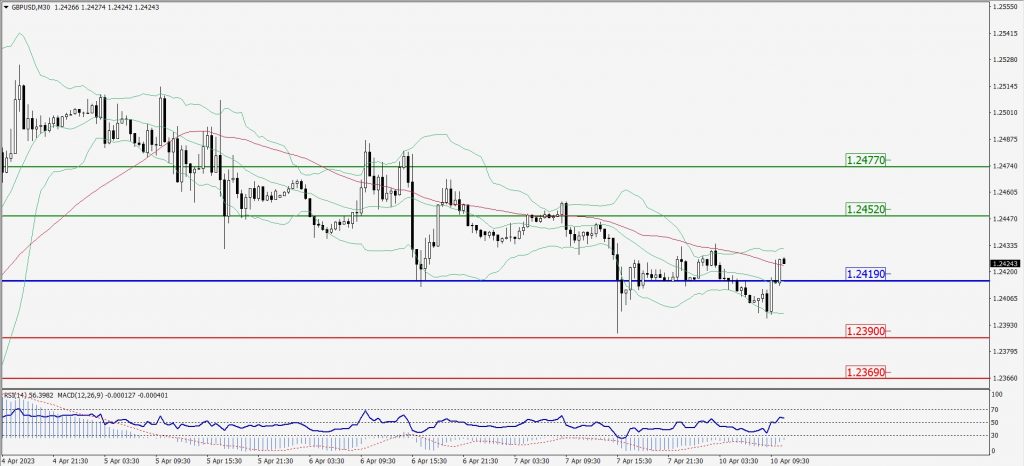
Green Lines Indicate Resistance Levels – Red Lines Indicate Support Levels
Light Blue is a Pivot Point – Black represents the price when the report was produced
USD/JPY Intraday: Trend on the downside
Our pivot point is at 132.280
Preferable Price Action: Sell position below pivot with the target at 131.780 and 131.460 in extension.
Alternative Price Action: The upside breakout of the pivot would call for 132.750 and 133.110.
Comment: MACD is below 50 level and Pairs below 20MA.
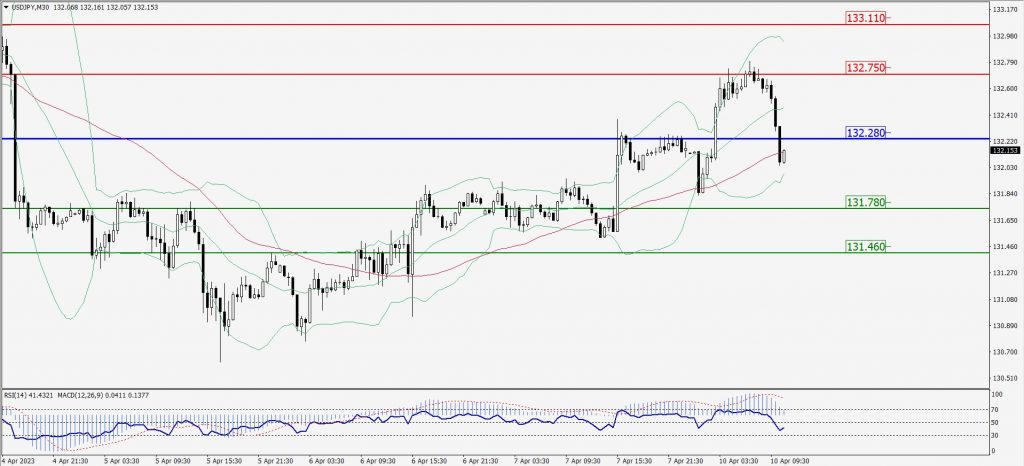
Green Lines Indicate Resistance Levels – Red Lines Indicate Support Levels
Light Blue is a Pivot Point – Black represents the price when the report was produced
AUD/USD Intraday: Major support level at 0.66600
Our pivot point is at 0.66600
Preferable Price Action: Buy positions above pivot with targets at 0.66960 & 0.67280 in extension.
Alternative Price Action: Below pivot looks for a further downside with 0.66220 & 0.65920 as targets.
Comment: RSI is above 50 levels and Pairs above 20MA.
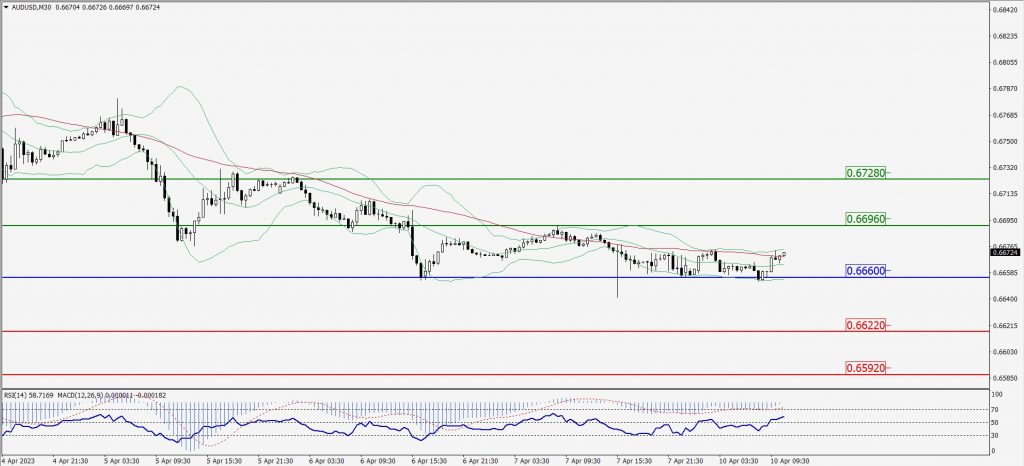
Green Lines Indicate Resistance Levels – Red Lines Indicate Support Levels
Light Blue is a Pivot Point – Black represents the price when the report was produced
CRUDEOIL Intraday: In a consolidation zone
Our pivot point is at 80.55
Preferable Price Action: Above pivot buy oil with 81.08 & 81.45 as targets.
Alternative Price Action: Sell crude below pivot with targets at 80.15 and 79.81 in extension.
Comment: MACD is positive territory and Pairs above 55MA.
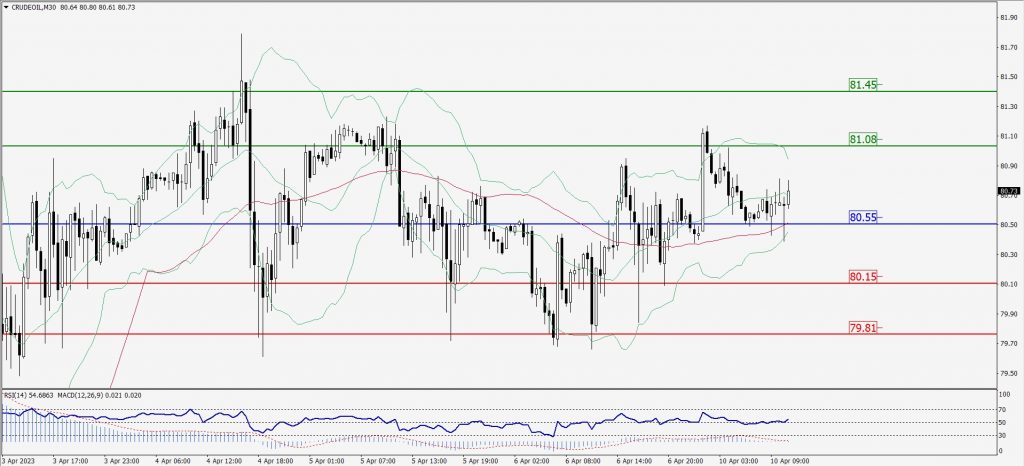
Green Lines Indicate Resistance Levels – Red Lines Indicate Support Levels
Light Blue is a Pivot Point – Black represents the price when the report was produced
XAU/USD Intraday: Trend on the downside
Our pivot point is 2003.00
Preferable Price Action: Further downside to 1989.90 and 1981.20
Alternative Price Action: If the price gives an upside breakout of a pivot, then the price extends to 2012.60 and 2021.20.
Comment: MACD is below 50 level and Pairs below 55MA.
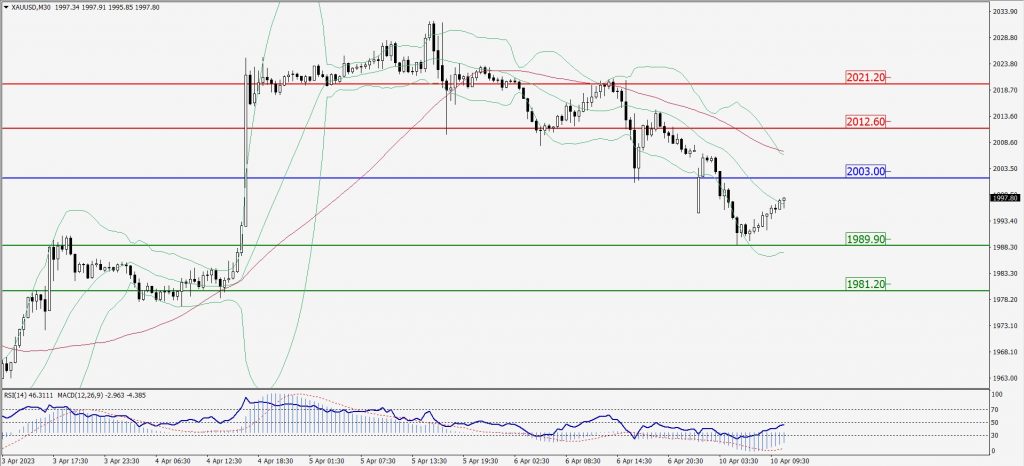
Green Lines Indicate Resistance Levels – Red Lines Indicate Support Levels
Light Blue is a Pivot Point – Black represents the price when the report was produced
Dow Jones Intraday: Trend on the downside
Our pivot point is 33,525.00
Preferable Price Action: Take sell positions below the pivot with targets at 33,450.00 & 33,396.00.
Alternative Price Action: Above 33,525.00 looks for further upside to 33,599.00 & 33,662.00.
Comment: RSI is below 50 levels and Pairs below 20MA.
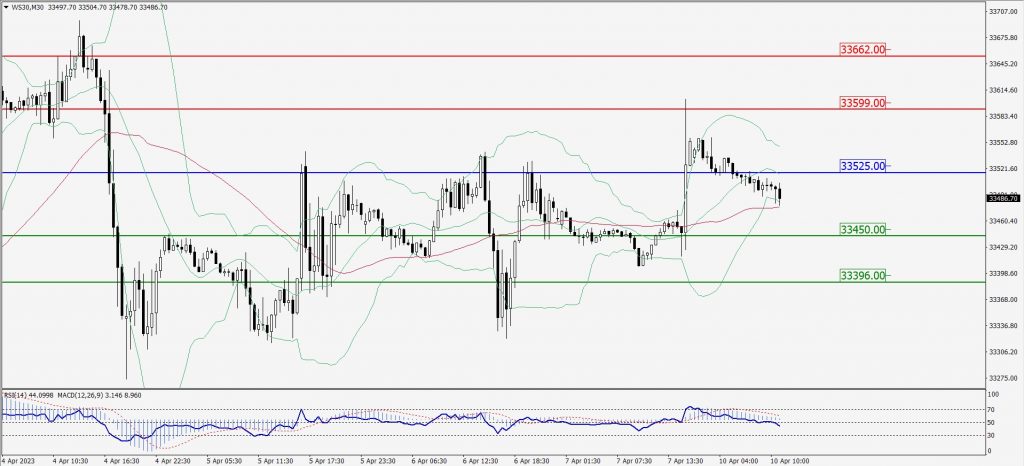
Green Lines Indicate Resistance Levels – Red Lines Indicate Support Levels
Light Blue is a Pivot Point – Black represents the price when the report was produced