Market Wrap: Stocks, Bonds, Commodities
US stocks snapped four day winning streak in the last trading session as investors look towards OPEC+ production cuts and inflation impact of the same with uncertainty still looming for the global economy.
The Dow Jones Industrial Average fell 198.77 points to 33,402.38, the S&P 500 lose 0.58% to 4,100.60 and the Nasdaq Composite subtract 63.13 points to 12,126.33.
MSCI’s index of Asia-Pacific stocks outside Japan is advance 0.25% to 642.97 levels. The Australian index was higher by 0.02% to 7,237.20. Japanese Nikkei Index delcine 1.68% today.
European stocks were negative on Wednesday, with the Stoxx Europe 50 Index fell 0.23% to 4,304.35, Germany’s DAX decline 0.36% to 15,549.05, and France’s CAC drop 0.22% to 7,328.64, and U.K.’s FTSE 100 add 0.41% to 7,665.64.
Benchmark 10-year U.S. Treasury fell as demand for safe assets ascend again, today 10-year bond yields are positive 0.88% to 3.3660.
Oil prices were stable on Wednesday, as the market weighed gloomy economic prospects against expectations of U.S. crude inventory declines and OPEC’s voluntary output cuts announcement.
Spot Brent crude oil drop 0.32% to $84.68 per barrel. US West Texas Intermediate crude is down 0.30% to $80.49 a barrel.
The yellow metal gold is advance 0.05% to 2,039.35 dollars per ounce.
Market Wrap: Forex
The dollar wallowed near two-month lows on Wednesday after weak data supported the view that the Federal Reserve may not need to raise rates much further, while the New Zealand dollar hit two-month highs after a larger-than expected rate hike.
Today, the U.S. dollar index measures the Greenback against a trade-weighted basket of six major currencies, which surged 0.10% to 101.370.
The Euro US Dollar (EUR/USD) is a widely traded pair that is down 0.05% today. This left the pair trading around $1.09460.
The Japanese yen was negative against the U.S. dollar on Wednesday. Today USD/JPY is slipped 0.02% to the 131.690 level.
Another commodity-related currency negative against the U.S dollar, AUD/USD fell 1.01% to 0.66830, and NZD/USD slipped 0.13% to 0.63020 level.
EUR/USD Intraday: Trend on the upside
Our pivot point is at 1.09470
Preferable Price Action: Take buy positions above pivot level with targets at 1.09920 & 1.10220 in extension.
Alternative Price Action: Below pivot looks for a further downside to 1.09040 & 1.08740.
Comment: RSI is above 50 levels and Pairs above 55MA.
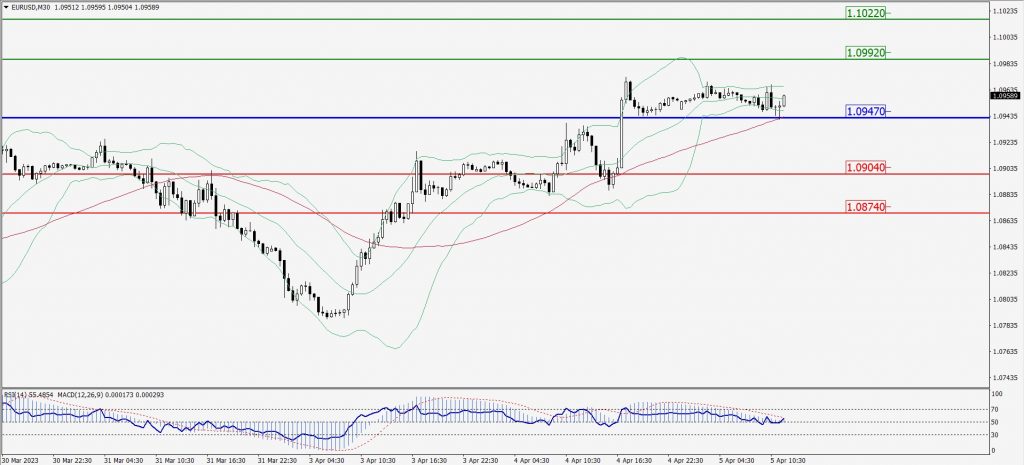
Green Lines Indicate Resistance Levels – Red Lines Indicate Support Levels
Light Blue is a Pivot Point – Black represents the price when the report was produced
GBP/USD Intraday: Resistance level at 1.25060
Our pivot point is at 1.25060
Preferable Price Action: Sell positions below pivot with targets at 1.24620 & 1.24330 in extension.
Alternative Price Action: The price above pivot would call for further upside to 1.25470 & 1.25790.
Comment: RSI is below 50 levels.
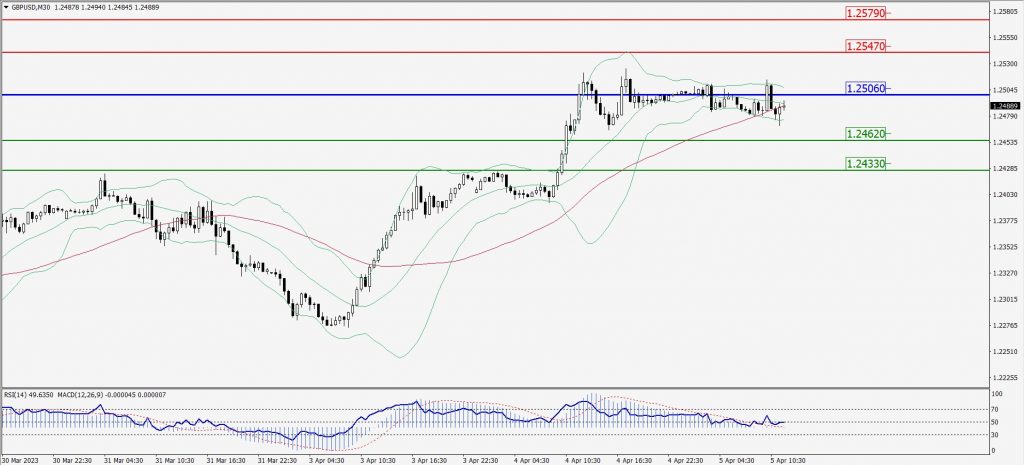
Green Lines Indicate Resistance Levels – Red Lines Indicate Support Levels
Light Blue is a Pivot Point – Black represents the price when the report was produced
USD/JPY Intraday: In a consolidation zone
Our pivot point is at 131.840
Preferable Price Action: Sell position below pivot with the target at 131.260 and 130.920 in extension.
Alternative Price Action: The upside breakout of the pivot would call for 132.300 and 132.640.
Comment: MACD is at 50 level and Pairs below 55MA.
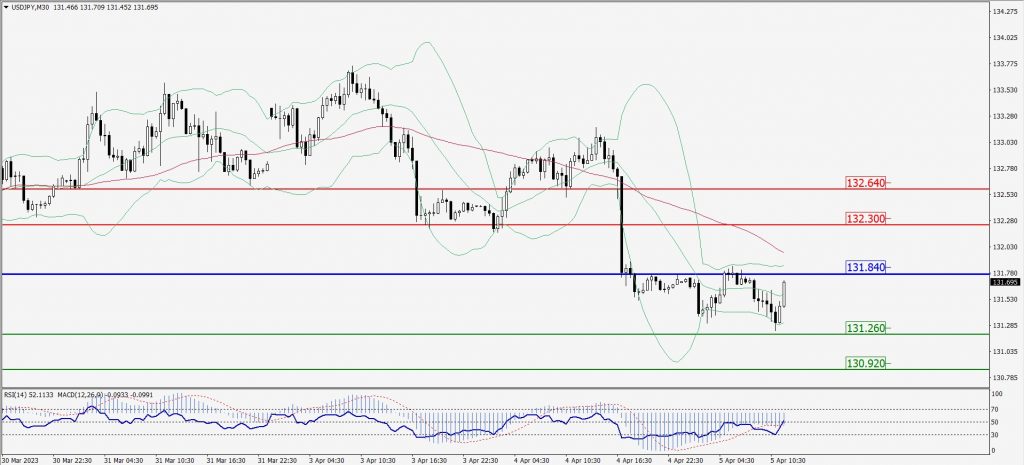
Green Lines Indicate Resistance Levels – Red Lines Indicate Support Levels
Light Blue is a Pivot Point – Black represents the price when the report was produced
AUD/USD Intraday: Major trend on the downside
Our pivot point is at 0.67160
Preferable Price Action: Sell positions below pivot with targets at 0.66760 & 0.66500 in extension.
Alternative Price Action: Above pivot looks for a further upside with 0.67480 & 0.67710 as targets.
Comment: RSI is below 50 levels and Pairs below its 20MA & 55MA.
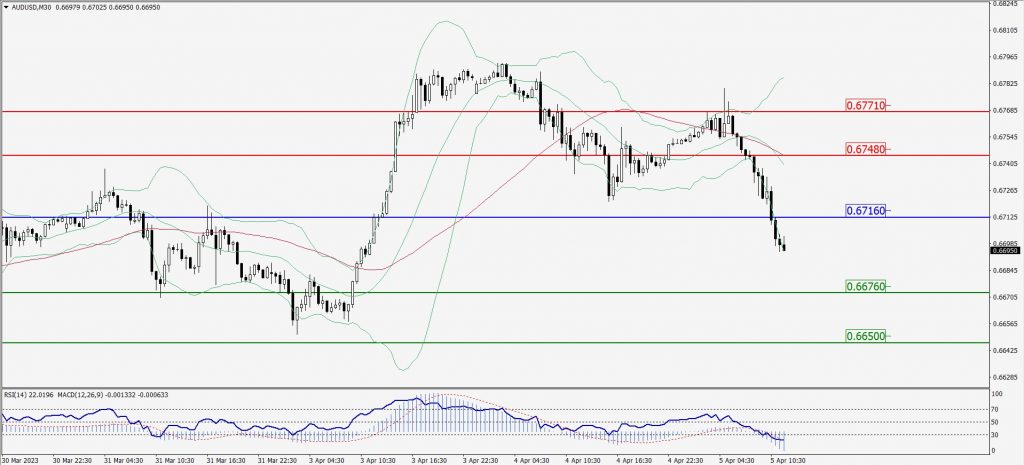
Green Lines Indicate Resistance Levels – Red Lines Indicate Support Levels
Light Blue is a Pivot Point – Black represents the price when the report was produced
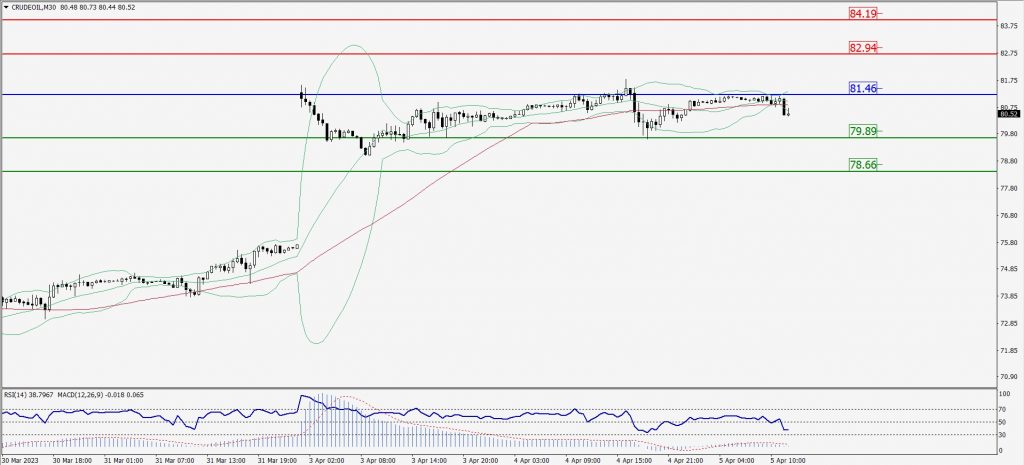
CRUDEOIL Intraday: Major resistance level at 81.46
Our pivot point is at 81.46
Preferable Price Action: Below pivot sell oil with 79.89 & 78.66 as targets.
Alternative Price Action: Buy crude above pivot with targets at 82.94 and 84.19 in extension.
Comment: MACD is negative territory and Pairs below its 20MA & 55MA.
Green Lines Indicate Resistance Levels – Red Lines Indicate Support Levels
Light Blue is a Pivot Point – Black represents the price when the report was produced
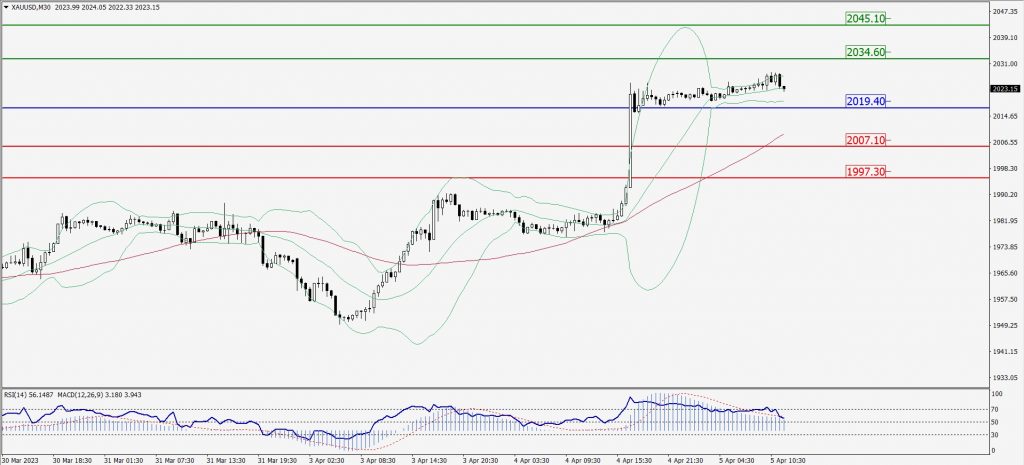
XAU/USD Intraday: Trend on the upside
Our pivot point is 2019.40
Preferable Price Action: Further upside to 2034.60 and 2045.10
Alternative Price Action: If the price gives a downside breakout of a pivot, then the price extends to 2007.10 and 1997.30.
Comment: MACD is above 50 level and Pairs above 55MA.
Green Lines Indicate Resistance Levels – Red Lines Indicate Support Levels
Light Blue is a Pivot Point – Black represents the price when the report was produced
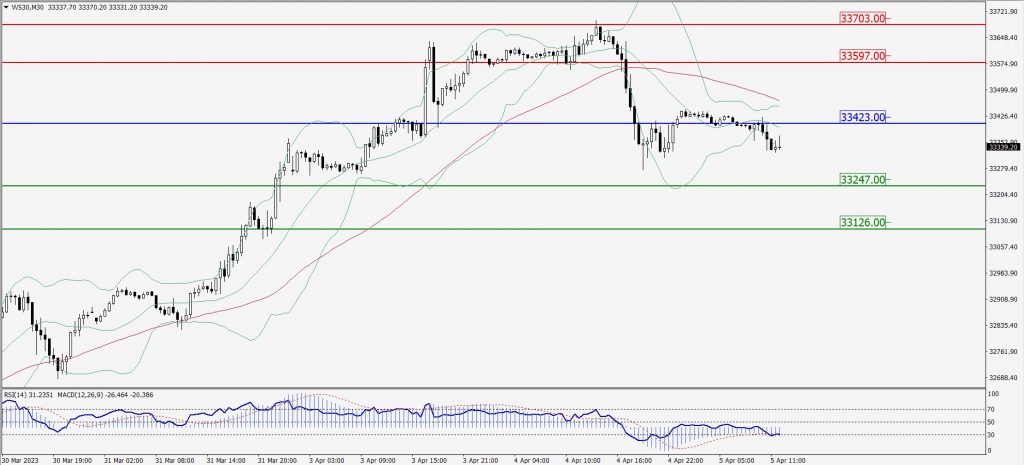
Dow Jones Intraday: Trend on the upside
Our pivot point is 33,423.00
Preferable Price Action: Take sell positions below the pivot with targets at 33,247.00 & 33,126.00.
Alternative Price Action: Above 33,423.00 looks for further upside to 33,597.00 & 33,703.00.
Comment: RSI is above 50 levels and Pairs above its 20MA & 55MA.
Green Lines Indicate Resistance Levels – Red Lines Indicate Support Levels
Light Blue is a Pivot Point – Black represents the price when the report was produced