Market Wrap: Stocks, Bonds, Commodities
US stock futures were little changed on Monday night as investors look toward the release of economic data later this week.
The Dow Jones Industrial Average rose 101.23 points to 33,586.52, the S&P 500 gain 0.10% to 4,109.11 and the Nasdaq Composite subtract 3.60 points to 12,084.36.
MSCI’s index of Asia-Pacific stocks outside Japan is advance 0.35% to 645.77 levels. The Australian index was higher by 1.26% to 7,309.90. Japanese Nikkei Index advance 1.05% today.
European stocks were negative on Tuesday, with the Stoxx Europe 50 Index rose 0.59% to 4,335.05, Germany’s DAX advance 0.57% to 15,687.05, and France’s CAC ascend 0.80% to 7,383.25, and U.K.’s FTSE 100 add 0.41% to 7,773.25.
Benchmark 10-year U.S. Treasury fell as demand for safe assets ascend again, today 10-year bond yields are negative 0.77% to 3.3890.
Oil prices edged higher on Tuesday as market participants weighed supply cuts from OPEC+ that would tighten the global market against concerns about further interest rate hikes potentially hurting demand.
Spot Brent crude oil ascend 0.55% to $84.66 per barrel. US West Texas Intermediate crude is up 0.65% to $80.26 a barrel.
The yellow metal gold is advance 0.84% to 2,020.60 dollars per ounce.
Market Wrap: Forex
The U.S. dollar slipped lower in early European trade Tuesday, handing back some of the previous session’s gains amid uncertainty over the future path of the Federal Reserve’s rate-hiking cycle.
Today, the U.S. dollar index measures the Greenback against a trade-weighted basket of six major currencies, which slipped 0.40% to 101.830.
The Euro US Dollar (EUR/USD) is a widely traded pair that is up 0.41% today. This left the pair trading around $1.09030.
The Japanese yen was negative against the U.S. dollar on Tuesday. Today USD/JPY is slipped 0.36% to the 133.120 level.
Another commodity-related currency positive against the U.S dollar, AUD/USD rose 0.50% to 0.66720, and NZD/USD surged 0.14% to 0.62240 level.
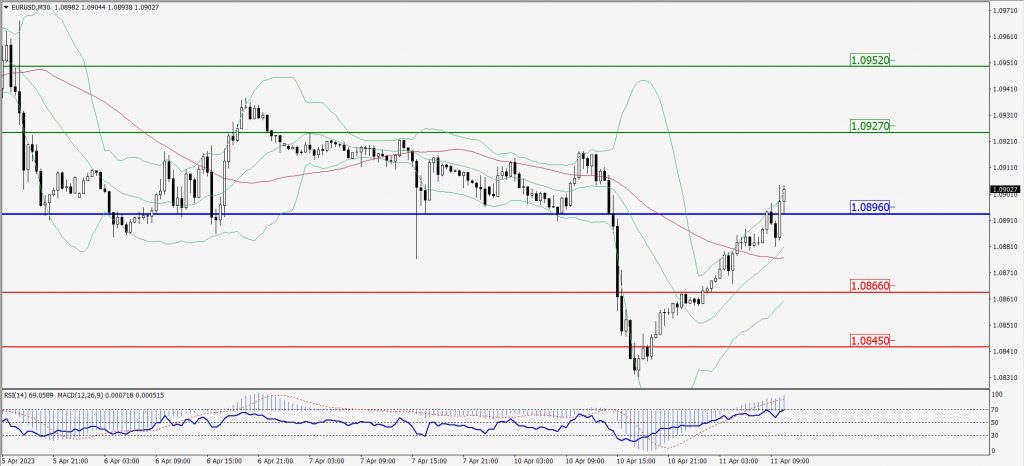
EUR/USD Intraday: Major trend on the upside
Our pivot point is at 1.08960
Preferable Price Action: Take buy positions above pivot level with targets at 1.09270 & 1.09520 in extension.
Alternative Price Action: Below pivot looks for a further downside to 1.08660 & 1.08450.
Comment: RSI is above 50 levels and Pairs above its 20MA & 55MA.
Green Lines Indicate Resistance Levels – Red Lines Indicate Support Levels
Light Blue is a Pivot Point – Black represents the price when the report was produced
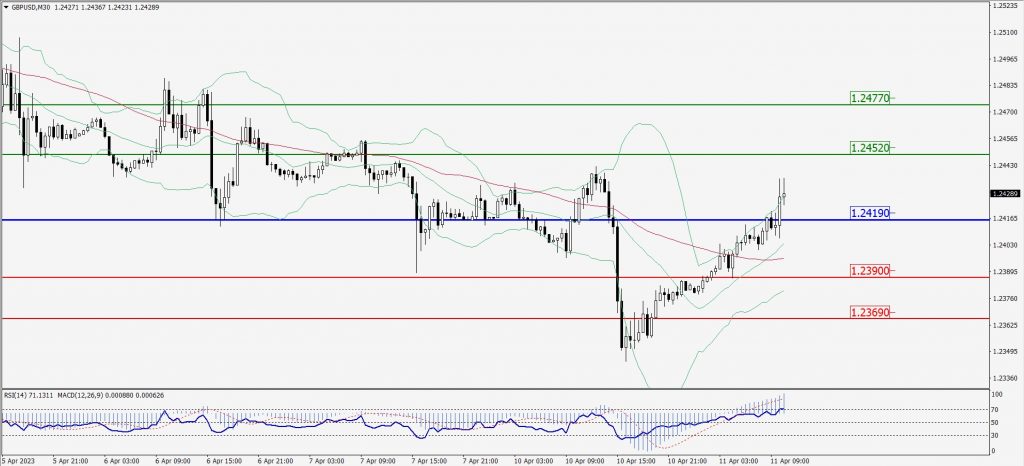
GBP/USD Intraday: Support level at 1.24190
Our pivot point is at 1.24190
Preferable Price Action: Buy positions above pivot with targets at 1.24520 & 1.24770 in extension.
Alternative Price Action: The price below pivot would call for further downside to 1.23900 & 1.23690.
Comment: RSI is above 50 levels and Pairs above its 20MA & 55MA.
Green Lines Indicate Resistance Levels – Red Lines Indicate Support Levels
Light Blue is a Pivot Point – Black represents the price when the report was produced
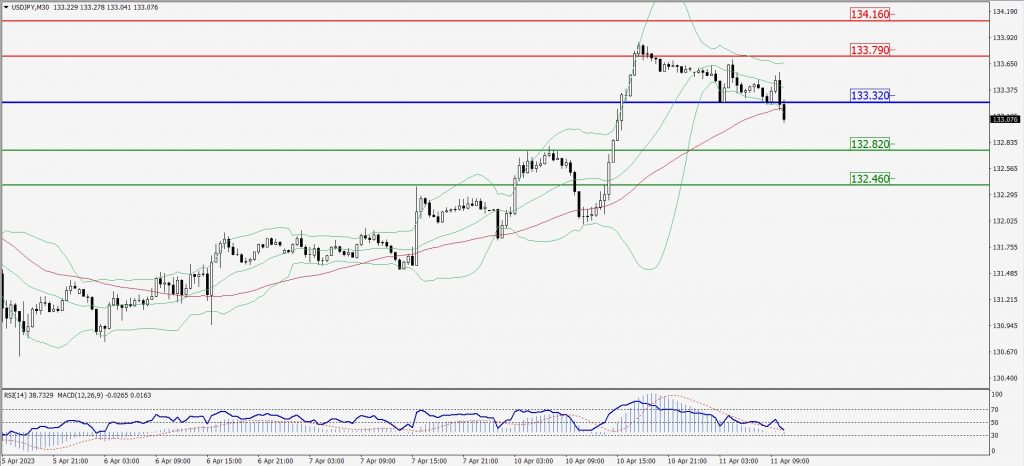
USD/JPY Intraday: Trend on the downside
Our pivot point is at 133.320
Preferable Price Action: Sell position below pivot with the target at 132.820 and 132.460 in extension.
Alternative Price Action: The upside breakout of the pivot would call for 133.790 and 134.160.
Comment: MACD is below 50 level and Pairs below 20MA.
Green Lines Indicate Resistance Levels – Red Lines Indicate Support Levels
Light Blue is a Pivot Point – Black represents the price when the report was produced
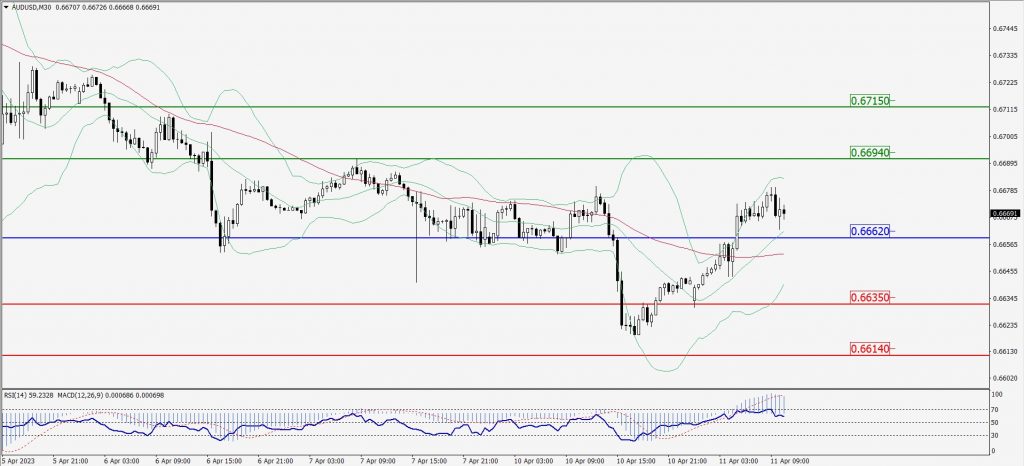
AUD/USD Intraday: Trend on the upside
Our pivot point is at 0.66620
Preferable Price Action: Buy positions above pivot with targets at 0.66940 & 0.67150 in extension.
Alternative Price Action: Below pivot looks for a further downside with 0.66350 & 0.66140 as targets.
Comment: RSI is above 50 levels and Pairs above its 20MA & 55MA.
Green Lines Indicate Resistance Levels – Red Lines Indicate Support Levels
Light Blue is a Pivot Point – Black represents the price when the report was produced
CRUDEOIL Intraday: Trend on the upside
Our pivot point is at 80.26
Preferable Price Action: Above pivot buy oil with 80.90 & 81.41 as targets.
Alternative Price Action: Sell crude below pivot with targets at 79.74 and 79.30 in extension.
Comment: MACD is positive territory and Pairs above 20MA.
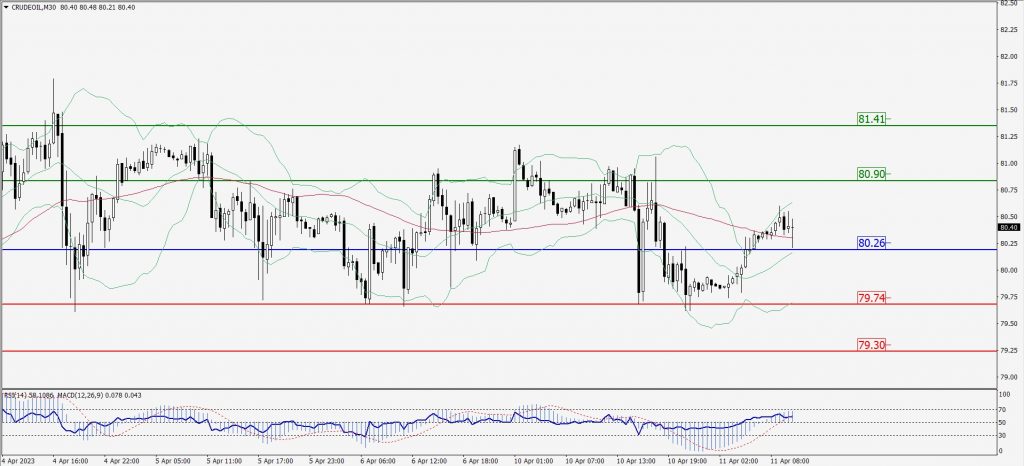
Green Lines Indicate Resistance Levels – Red Lines Indicate Support Levels
Light Blue is a Pivot Point – Black represents the price when the report was produced
XAU/USD Intraday: Trend on the upside
Our pivot point is 1998.30
Preferable Price Action: Further upside to 2008.50 and 2016.00
Alternative Price Action: If the price gives a downside breakout of a pivot, then the price extends to 1989.20 and 1980.50.
Comment: MACD is above 50 level and Pairs above its 20MA & 55MA.
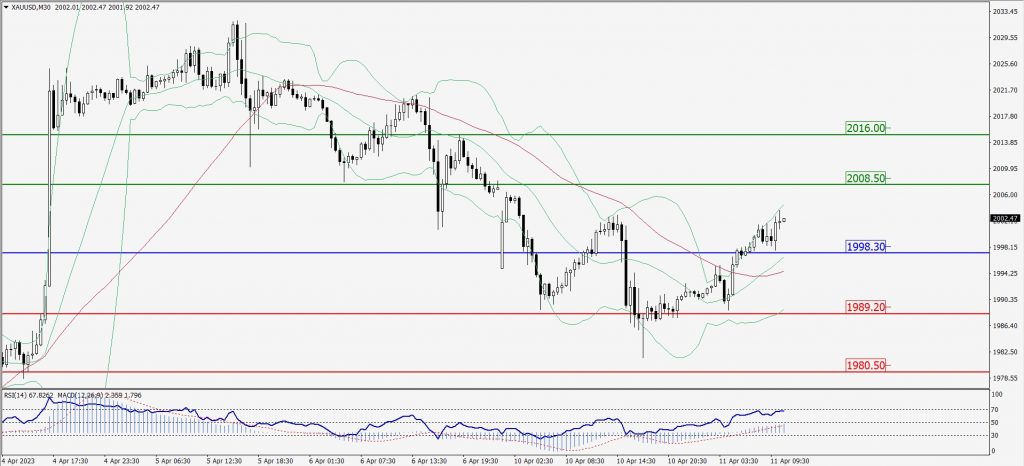
Green Lines Indicate Resistance Levels – Red Lines Indicate Support Levels
Light Blue is a Pivot Point – Black represents the price when the report was produced
Dow Jones Intraday: In a consolidation zone
Our pivot point is 33,565.00
Preferable Price Action: Take buy positions above the pivot with targets at 33,654.00 & 33,720.00.
Alternative Price Action: Below 33,565.00 looks for further downside to 33,491.00 & 33,435.00.
Comment: RSI is above 50 levels and Pairs above 55MA.
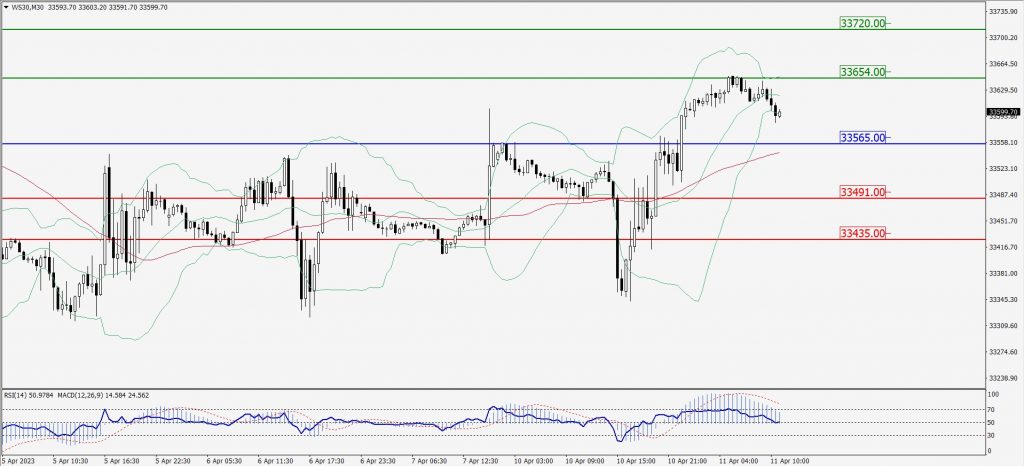
Green Lines Indicate Resistance Levels – Red Lines Indicate Support Levels
Light Blue is a Pivot Point – Black represents the price when the report was produced