Market Wrap: Stocks, Bonds, Commodities
Australia stocks were higher after the close on Tuesday, as gains in the Gold, Energy and IT sectors led shares higher.
The Dow Jones Industrial Average rose 327.00 points to 33,601.15, the S&P 500 gain 0.37% to 4,124.51 and the Nasdaq Composite subtract 32.45 points to 12,189.45.
MSCI’s index of Asia-Pacific stocks outside Japan is decline 0.23% to 641.59 levels. The Australian index was higher by 0.18% to 7,236.00. Japanese Nikkei Index advance 0.35% today.
European stocks were positive on Tuesday, with the Stoxx Europe 50 Index rose 0.43% to 4,329.65, Germany’s DAX advance 0.41% to 15,676.15, and France’s CAC ascend 0.42% to 7,376.63, and U.K.’s FTSE 100 add 0.17% to 7,688.12.
Benchmark 10-year U.S. Treasury fell as demand for safe assets ascend again, today 10-year bond yields are positive 0.33% to 3.4430.
Oil prices rose on Tuesday after OPEC+ plans to cut more production jolted markets the previous day, with investors’ attention shifting to demand trends and the impact of higher prices on the global economy.
Spot Brent crude oil ascend 0.64% to $85.48 per barrel. US West Texas Intermediate crude is up 0.71% to $80.97 a barrel.
The yellow metal gold is advance 0.02% to 2,000.65 dollars per ounce.
Market Wrap: Forex
The dollar was testing a two-month low against its major partners early on Tuesday, still under pressure after weak data from the manufacturing sector on Monday that encouraged hopes of an early ‘pivot’ from the Federal Reserve.
Today, the U.S. dollar index measures the Greenback against a trade-weighted basket of six major currencies, which slipped 0.18% to 101.590.
The Euro US Dollar (EUR/USD) is a widely traded pair that is up 0.28% today. This left the pair trading around $1.09240.
The Japanese yen was negative against the U.S. dollar on Tuesday. Today USD/JPY is surged 0.32% to the 132.850 level.
Another commodity-related currency mixed against the U.S dollar, AUD/USD fell 0.50% to 0.67510, and NZD/USD slipped 0.06% to 0.62920 level.
EUR/USD Intraday: Support level at 1.08930
Our pivot point is at 1.08930
Preferable Price Action: Take buy positions above pivot level with targets at 1.09390 & 1.09680 in extension.
Alternative Price Action: Below pivot looks for a further downside to 1.08560 & 1.08300.
Comment: RSI is above 50 levels and Pairs above its 20MA & 55MA.
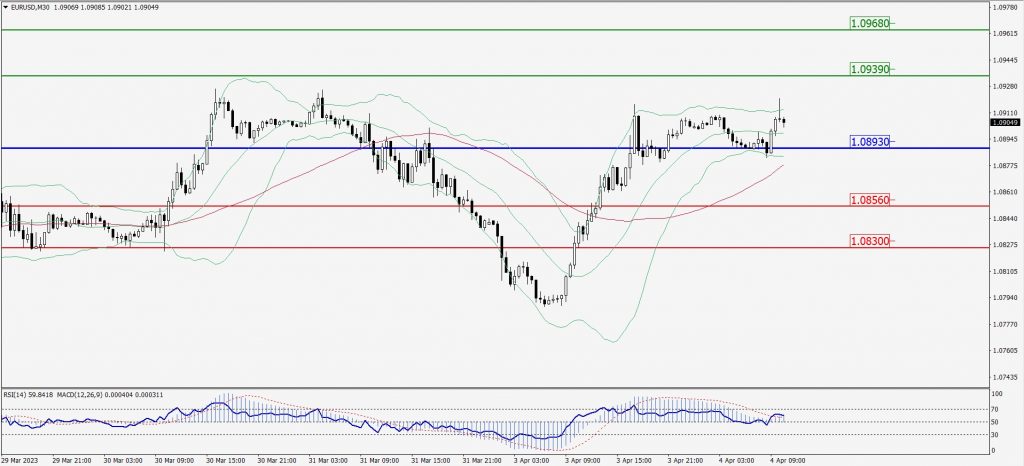
Green Lines Indicate Resistance Levels – Red Lines Indicate Support Levels
Light Blue is a Pivot Point – Black represents the price when the report was produced
GBP/USD Intraday: Trend on the upside
Our pivot point is at 1.24160
Preferable Price Action: Buy positions above pivot with targets at 1.24730 & 1.25080 in extension.
Alternative Price Action: The price below pivot would call for further downside to 1.23650 & 1.23280.
Comment: RSI is above 50 levels and Pairs above its 20MA & 55MA.
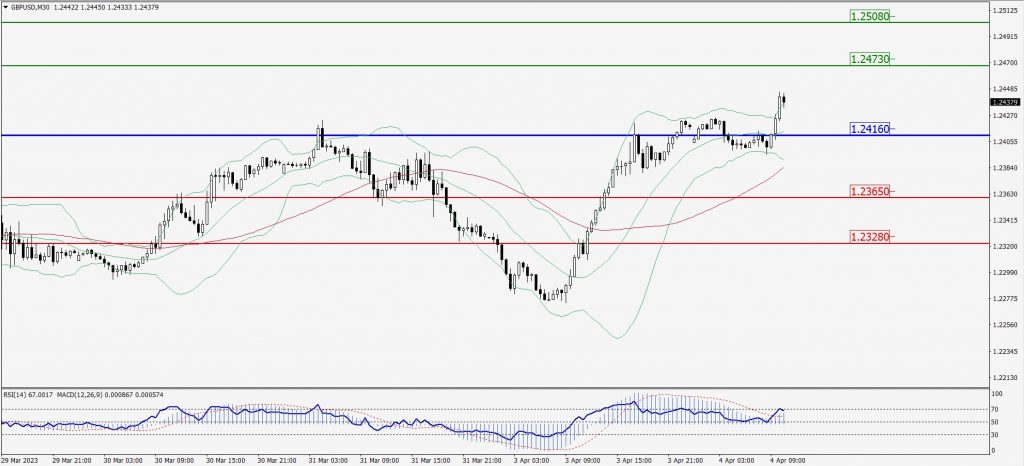
Green Lines Indicate Resistance Levels – Red Lines Indicate Support Levels
Light Blue is a Pivot Point – Black represents the price when the report was produced
USD/JPY Intraday: In a consolidation zone
Our pivot point is at 132.710
Preferable Price Action: Buy position above pivot with the target at 133.030 and 133.270 in extension.
Alternative Price Action: The downside breakout of the pivot would call for 132.420 and 132.230.
Comment: MACD is at 50 level and Pairs above 20MA.
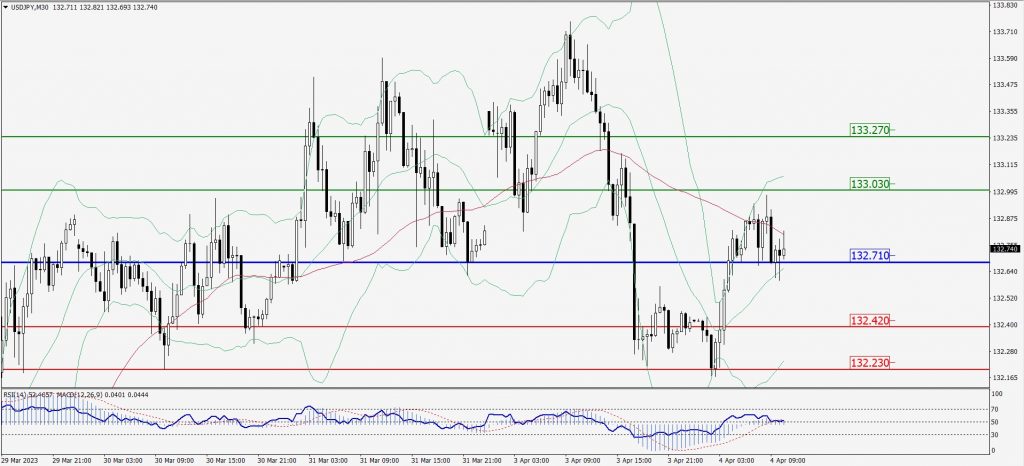
Green Lines Indicate Resistance Levels – Red Lines Indicate Support Levels
Light Blue is a Pivot Point – Black represents the price when the report was produced
AUD/USD Intraday: Trend on the downside
Our pivot point is at 0.67630
Preferable Price Action: Sell positions below pivot with targets at 0.67250 & 0.67030 in extension.
Alternative Price Action: Above pivot looks for a further upside with 0.68000 & 0.68250 as targets.
Comment: RSI is below 50 levels and Pairs below 20MA.
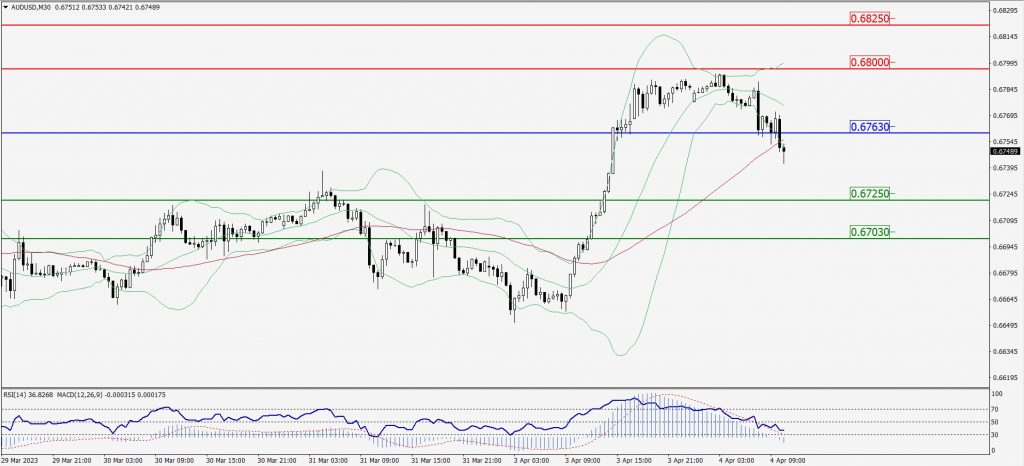
Green Lines Indicate Resistance Levels – Red Lines Indicate Support Levels
Light Blue is a Pivot Point – Black represents the price when the report was produced
CRUDEOIL Intraday: Major trend on the upside
Our pivot point is at 80.68
Preferable Price Action: Above pivot buy oil with 82.45 & 83.70 as targets.
Alternative Price Action: Sell crude below pivot with targets at 79.24 and 77.99 in extension.
Comment: MACD is positive territory and Pairs above its 20MA & 55MA.
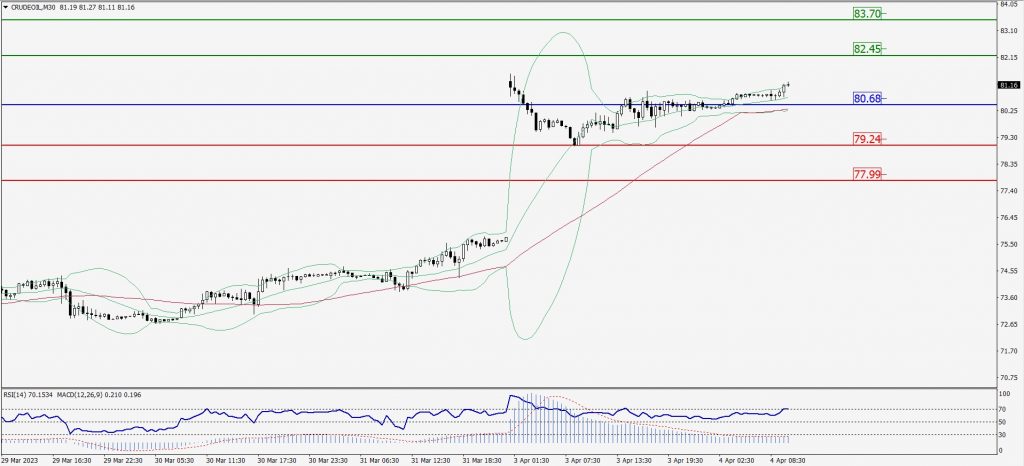
Green Lines Indicate Resistance Levels – Red Lines Indicate Support Levels
Light Blue is a Pivot Point – Black represents the price when the report was produced
XAU/USD Intraday: Trend on the upside
Our pivot point is 1978.50
Preferable Price Action: Further upside to 1989.00 and 1996.30
Alternative Price Action: If the price gives a downside breakout of a pivot, then the price extends to 1970.50 and 1964.10.
Comment: MACD is above 50 level and Pairs above 55MA.
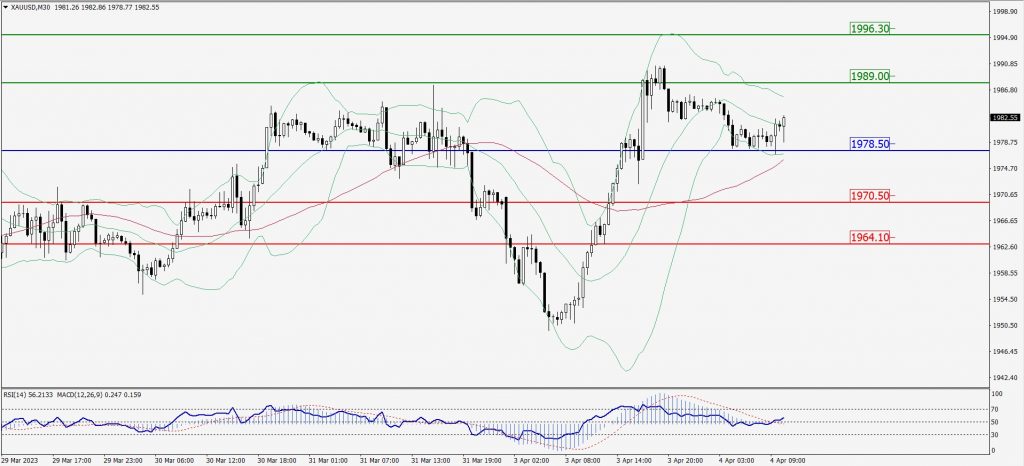
Green Lines Indicate Resistance Levels – Red Lines Indicate Support Levels
Light Blue is a Pivot Point – Black represents the price when the report was produced
Dow Jones Intraday: Trend on the upside
Our pivot point is 33,533.00
Preferable Price Action: Take buy positions above the pivot with targets at 33,731.00 & 33,864.00.
Alternative Price Action: Below 33,533.00 looks for further downside to 33,357.00 & 33,220.00.
Comment: RSI is above 50 levels and Pairs above 55MA.
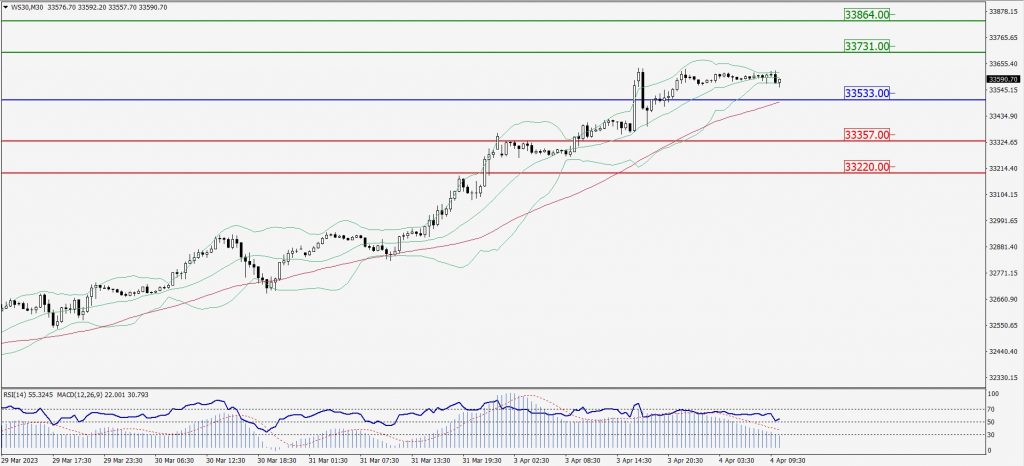
Green Lines Indicate Resistance Levels – Red Lines Indicate Support Levels
Light Blue is a Pivot Point – Black represents the price when the report was produced