Market Wrap: Stocks, Bonds, Commodities
The U.S. dollar was nursing steep losses on Tuesday, with the yen on the back foot after a sharp rise in the previous session as traders contend with the unwinding of popular carry trades and the prospect of deep rate cuts from the Federal Reserve.
The Dow Jones Industrial Average fail 1033.99 points to 38,703.27, the S&P 500 loss 3.00% to 5,186.33 and the Nasdaq Composite descend 576.08 points to 16,200.08.
MSCI’s index of Asia-Pacific stocks outside Japan is up 1.44% to 658.90 levels. The Australian index was higher by 0.41% to 7,680.60. Japanese Nikkei Index increase 10.24% today.
European stocks were positive on Tuesday, with the Stoxx Europe 50 Index increase 0.47% to 4,593.05, Germany’s DAX ascend 0.76% to 17,449.15, and France’s CAC higher 0.10% to 7,156.15 and U.K.’s FTSE 100 gain 0.40% to 8,039.92.
Benchmark 10-year U.S. Treasury rose as demand for safe assets slipped again, today 10-year bond yields increase 2.18% to 3.8620.
Oil prices rebounded by 1% on Tuesday, paring the previous session’s loss, on supply concern amid an escalating Middle East conflict, stronger U.S. services sector data and a cut in production at Libya’s Sharara oilfield.
Spot Brent crude oil increase 0.54% to $76.71 per barrel. US West Texas Intermediate crude is increase 0.81% to $73.53 a barrel.
The yellow metal gold is up 0.12% to 2,447.45 dollars per ounce.
Market Wrap: Forex
Most Asian currencies weakened slightly on Tuesday as the dollar steadied from a recent rout, with the Japanese yen falling from seven-month peaks.
Today, the U.S. dollar index measures the Greenback against a trade-weighted basket of six major currencies, which increase 0.26% to 102.752.
The Euro US Dollar (EUR/USD) is a widely traded pair that is decrease 0.12% today. This left the pair trading around $1.09390.
The Japanese yen was will move negative against the U.S. dollar on Tuesday. Today USD/JPY is trades pair that decrease 1.03% to the 145.660 level.
Another commodity-related currency mixed against the U.S dollar, AUD/USD gain 0.16% to 0.65050, and NZD/USD decrease 0.19% to 0.59290 level.
EUR/USD Intraday: Trend on the downside
Our pivot point is at 1.09510
Preferable Price Action: Take sell positions below pivot level with targets at 1.09220 & 1.08960 in extension.
Alternative Price Action: Buy pivot looks for a further upside to 1.09820 & 1.10090.
Comment: RSI is below 50 levels and Pairs below its 55MA & 20MA.
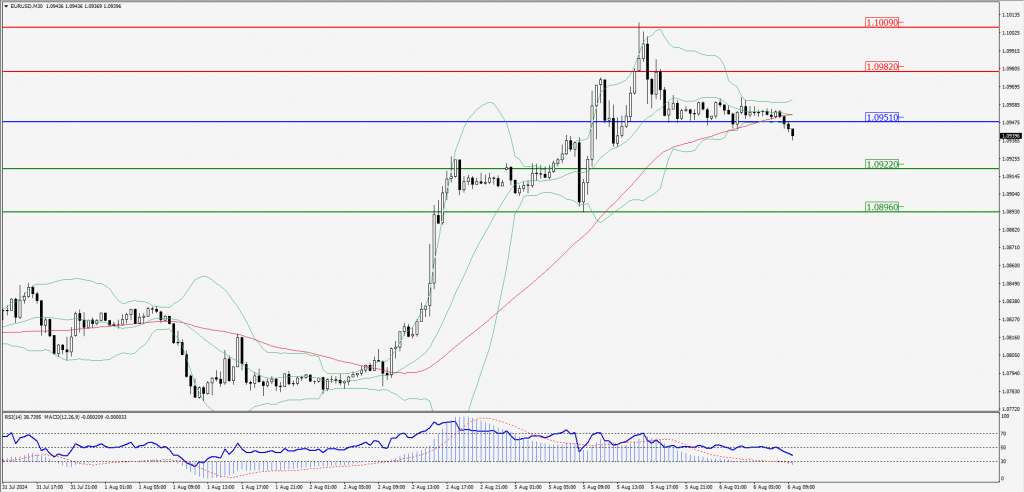
Green Lines Indicate Resistance Levels – Red Lines Indicate Support Levels
Light Blue is a Pivot Point – Black represents the price when the report was produced
GBP/USD Intraday: Trend on the downside
Our pivot point is at 1.27640
Preferable Price Action: Sell positions below pivot with targets at 1.27430 & 1.27240 in extension.
Alternative Price Action: The price above pivot would call for further upside to 1.27850 & 1.28040.
Comment: RSI is below 50 levels and Pairs below its 55MA & 20MA.
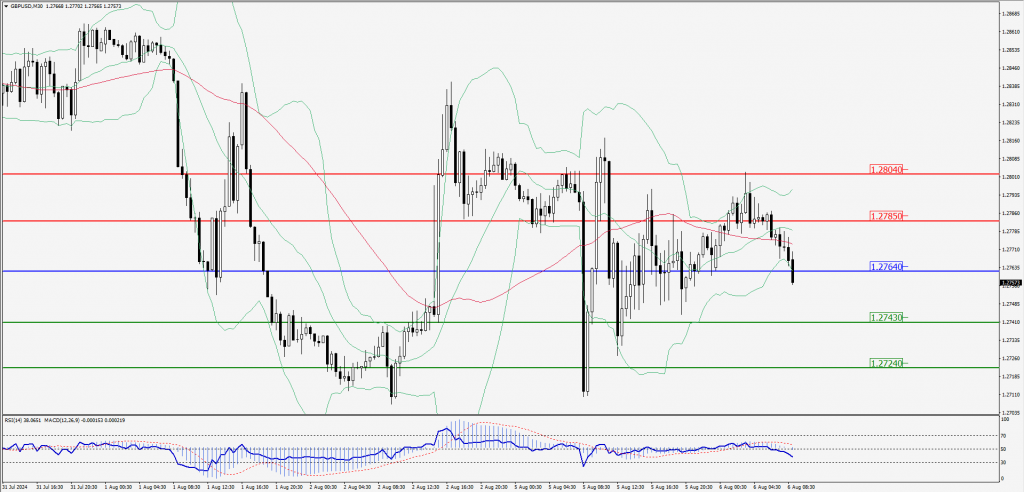
Green Lines Indicate Resistance Levels – Red Lines Indicate Support Levels
Light Blue is a Pivot Point – Black represents the price when the report was produced
USD/JPY Intraday: Trend on the upside
Our pivot point is at 145.280
Preferable Price Action: Buy position above pivot with the target at 146.570 and 147.850 in extension.
Alternative Price Action: The down side breakout of the pivot would call for 143.970 and 142.620.
Comment: MACD is above 50 levels and Pairs above its 20MA & 55MA.
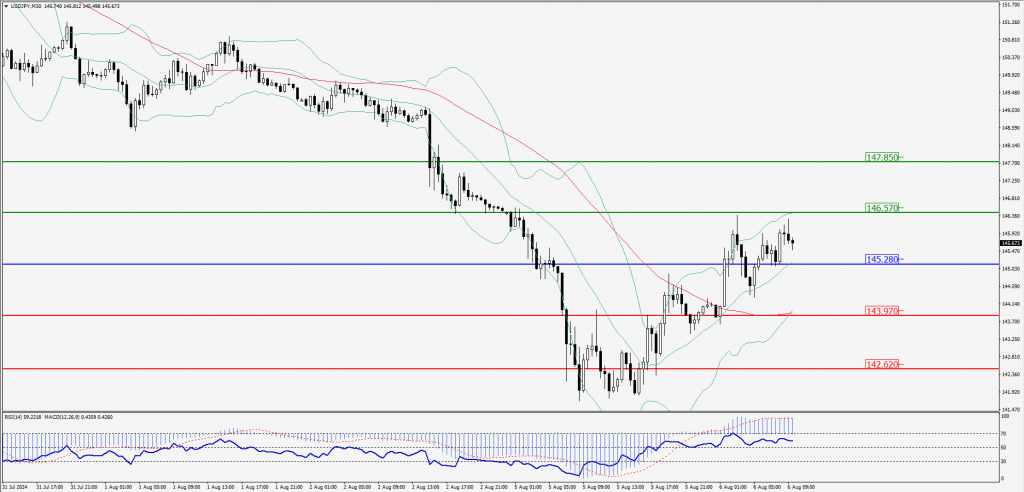
Green Lines Indicate Resistance Levels – Red Lines Indicate Support Levels
Light Blue is a Pivot Point – Black represents the price when the report was produced
AUD/USD Intraday: Trend on the upside
Our pivot point is at 0.65120
Preferable Price Action: Buy positions above pivot with targets at 0.65400 & 0.65650 in extension.
Alternative Price Action: Below pivot a further downside with 0.64830 & 0.64590 as targets.
Comment: RSI is above 50 levels and Pairs above its 55MA.
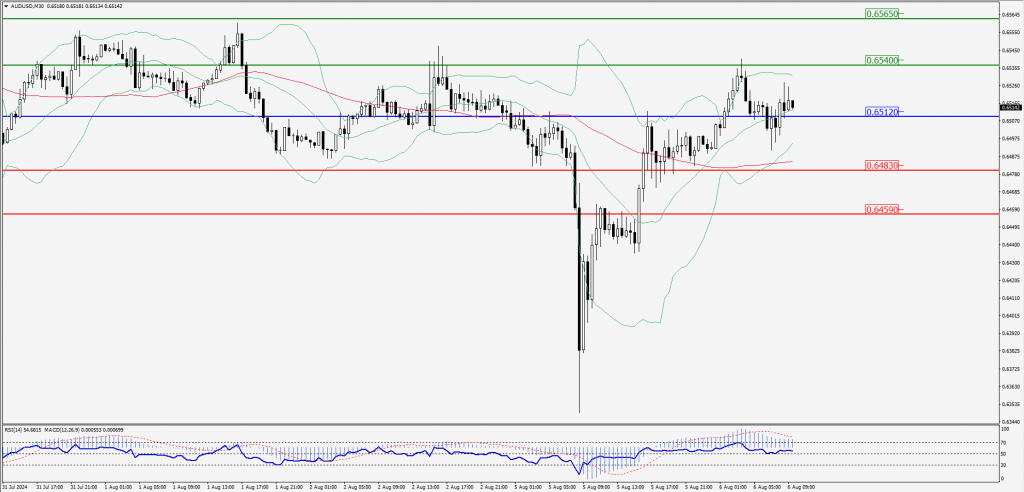
Green Lines Indicate Resistance Levels – Red Lines Indicate Support Levels
Light Blue is a Pivot Point – Black represents the price when the report was produced
CRUDEOIL Intraday: Trend on the downside
Our pivot point is at 73.54
Preferable Price Action: Below pivot sell oil with 72.52 & 71.72 as targets.
Alternative Price Action: Buy crude above pivot with targets at 74.53 and 75.45 in extension.
Comment: RSI is below 50 levels and Pairs below its 20MA.
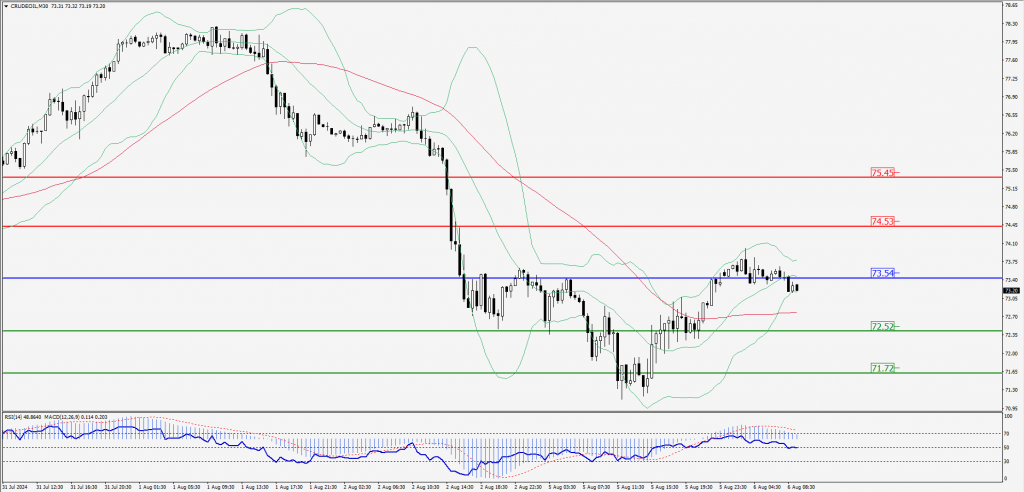
Green Lines Indicate Resistance Levels – Red Lines Indicate Support Levels
Light Blue is a Pivot Point – Black represents the price when the report was produced
XAU/USD Intraday: Trend on the downside
Our pivot point is at 2408.60
Preferable Price Action: Further downside to 2393.30 and 2377.60.
Alternative Price Action: If the price gives an upside breakout of a pivot, then the price extends to 2423.80 and 2438.90.
Comment: MACD is below 50 levels and pairs below its 55MA & 20MA.
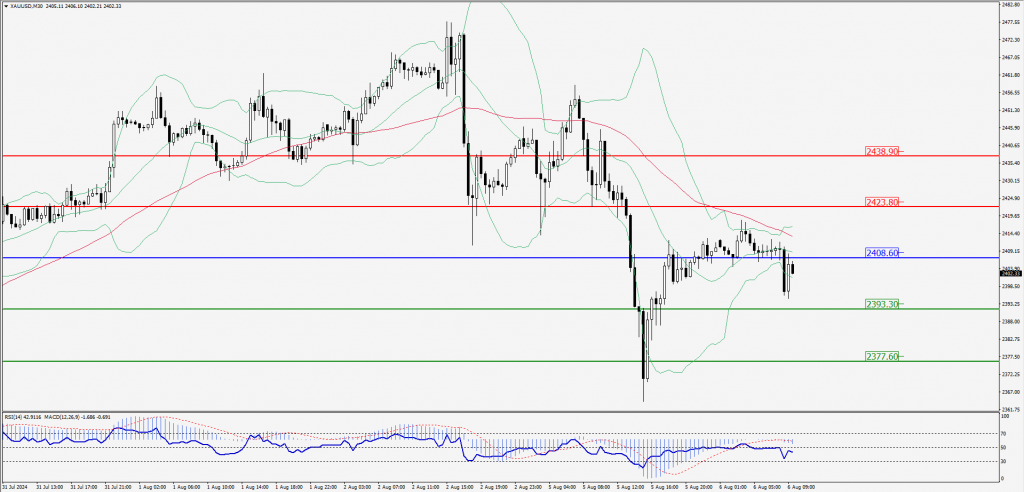
Green Lines Indicate Resistance Levels – Red Lines Indicate Support Levels
Light Blue is a Pivot Point – Black represents the price when the report was produced
Dow Jones Intraday: Trend on the downside
Our pivot point is 39,107.40
Preferable Price Action: Take sell positions below the pivot with targets at 38,748.10 & 38,436.20.
Alternative Price Action: Above 39,107.40 looks for further upside to 39,462.70 & 39,802.20.
Comment: RSI is below 50 levels.
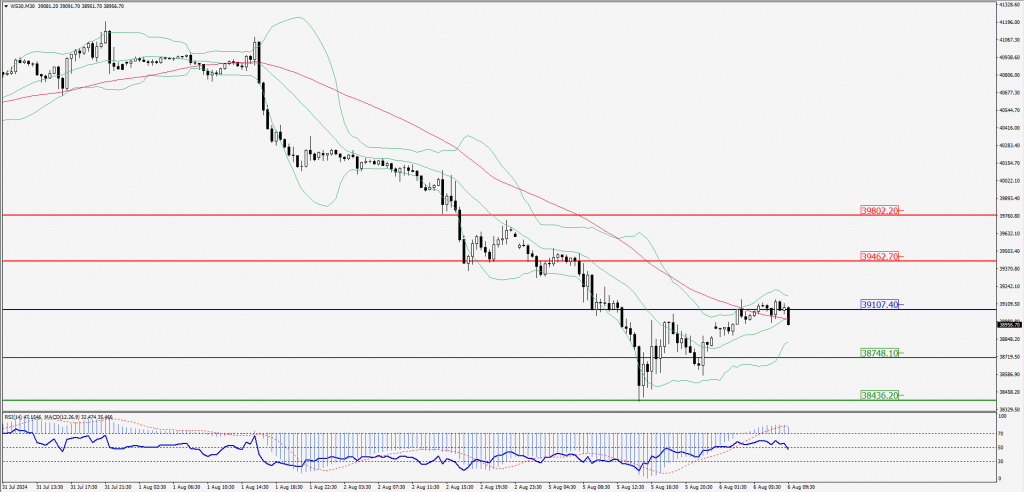
Green Lines Indicate Resistance Levels – Red Lines Indicate Support Levels
Light Blue is a Pivot Point – Black represents the price when the report was produced