Market Wrap: Stocks, Bonds, Commodities
The U.S. dollar retreated in early European trade Monday ahead of the key monthly jobs report, while sterling edged higher after the result of the U.K general election.
The Dow Jones Industrial Average rose 67.87 points to 39,375.87, the S&P 500 gain 0.54% to 5,567.19 and the Nasdaq Composite ascend 163.04 points to 18,351.34.
MSCI’s index of Asia-Pacific stocks outside Japan is up 0.06% to 709.29 levels. The Australian index was lower by 0.76% to 7,763.20. Japanese Nikkei Index decrease 0.06% today.
European stocks were positive on Monday, with the Stoxx Europe 50 Index increase 0.93% to 5,025.75, Germany’s DAX ascend 0.83% to 18,613.85, and France’s CAC higher 0.89% to 7,743.59 and U.K.’s FTSE 100 gain 0.17% to 8,218.25.
Benchmark 10-year U.S. Treasury rose as demand for safe assets slipped again, today 10-year bond yields increase 0.78% to 4.3010.
Oil prices slid on Monday after rising for four weeks, as the prospect of a ceasefire deal in Gaza eased geopolitical tensions in the Middle East, while investors assessed potential disruption to U.S. energy supplies from Tropical Storm Beryl.
Spot Brent crude oil decrease 0.60% to $86.02 per barrel. US West Texas Intermediate crude is decrease 0.79% to $82.50 a barrel.
The yellow metal gold is down 0.67% to 2,381.75 dollars per ounce.
Market Wrap: Forex
Most Asian currencies moved little on Monday, while the dollar nursed steep losses amid growing expectations of interest rate cuts, while the Japanese yen firmed on data showing a pick-up in average wages.
Today, the U.S. dollar index measures the Greenback against a trade-weighted basket of six major currencies, which either up or down 0.00% to 104.552.
The Euro US Dollar (EUR/USD) is a widely traded pair that is increase 0.15% today. This left the pair trading around $1.08410.
The Japanese yen was positive against the U.S. dollar on Monday. Today USD/JPY is trades pair that increases 0.15% to the 160.970 level.
Another commodity-related currency negative against the U.S dollar, AUD/USD decrease 0.07% to 0.67440, and NZD/USD decrease 0.11% to 0.61380 level.
EUR/USD Intraday: Trend on the downside
Our pivot point is at 1.08380
Preferable Price Action: Take sell positions below pivot level with targets at 1.08180 & 1.08000 in extension.
Alternative Price Action: Buy pivot looks for a further upside to 1.08580 & 1.08760.
Comment: RSI is below 50 levels.
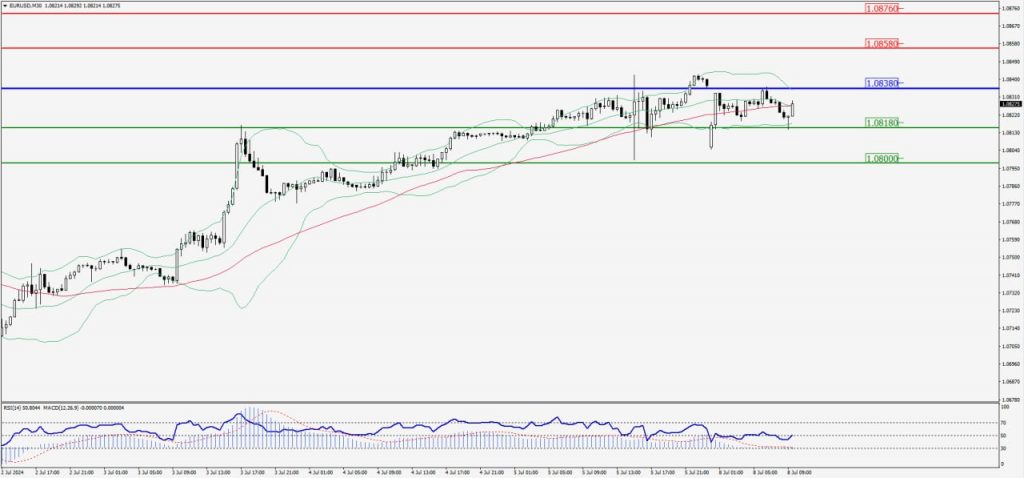
Green Lines Indicate Resistance Levels – Red Lines Indicate Support Levels
Light Blue is a Pivot Point – Black represents the price when the report was produced
GBP/USD Intraday: Trend on the downside
Our pivot point is at 1.28160
Preferable Price Action: Sell positions below pivot with targets at 1.27900 & 1.27660 in extension.
Alternative Price Action: The price above pivot would call for further upside to 1.28410 & 1.28620.
Comment: RSI is below 50 levels.
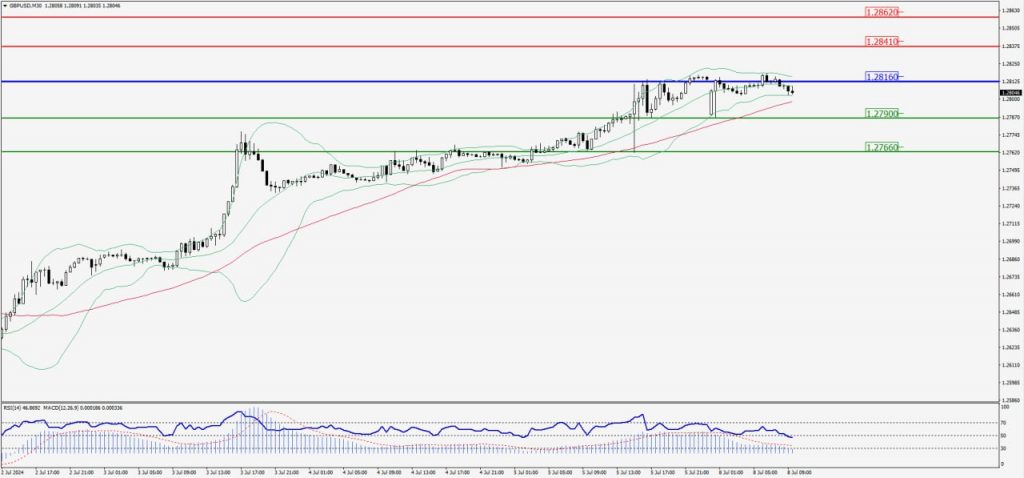
Green Lines Indicate Resistance Levels – Red Lines Indicate Support Levels
Light Blue is a Pivot Point – Black represents the price when the report was produced
USD/JPY Intraday: Registrant level at 160.750
Our pivot point is at 160.750
Preferable Price Action: Buy position above pivot with the target at 160.980 and 161.180 in extension.
Alternative Price Action: The downside breakout of the pivot would call for 160.540 and 160.330.
Comment: MACD is above 50 levels and Pairs above its 20MA & 55MA.
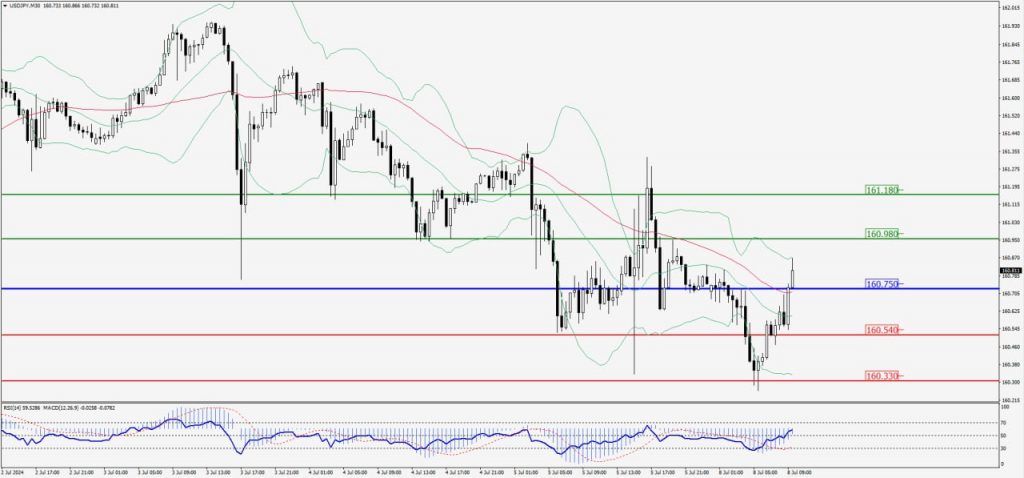
Green Lines Indicate Resistance Levels – Red Lines Indicate Support Levels
Light Blue is a Pivot Point – Black represents the price when the report was produced
AUD/USD Intraday: Trend on the downside
Our pivot point is at 0.67460
Preferable Price Action: Sell positions below pivot with targets at 0.67320 & 0.67190 in extension.
Alternative Price Action: Above pivot a further upside with 0.67610 & 0.67730 as targets.
Comment: RSI is below 50 levels.
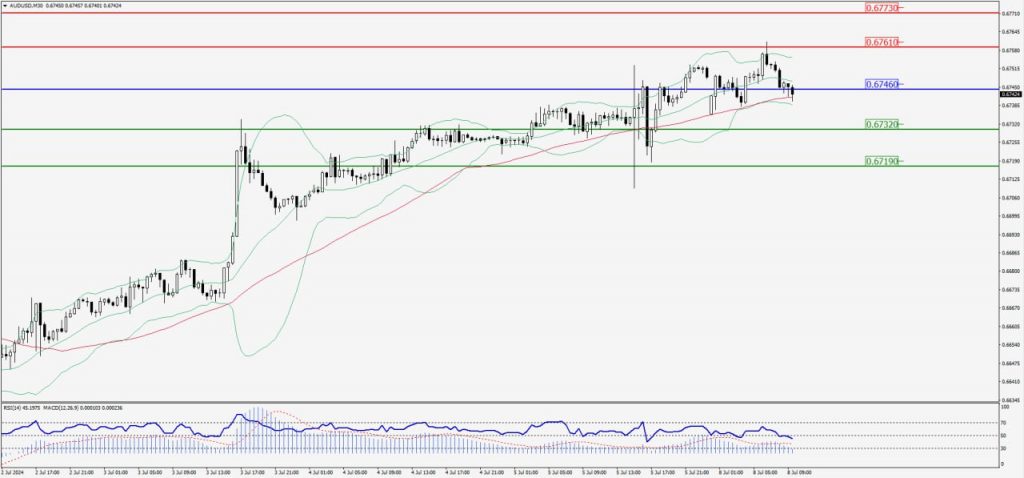
Green Lines Indicate Resistance Levels – Red Lines Indicate Support Levels
Light Blue is a Pivot Point – Black represents the price when the report was produced
CRUDEOIL Intraday: Trend on the downside
Our pivot point is at 82.15
Preferable Price Action: Below pivot sell oil with 81.78 & 81.49 as targets.
Alternative Price Action: Buy crude above pivot with targets at 82.53 and 82.85 in extension.
Comment: RSI is below 50 levels and pairs below its 20MA & 55MA.
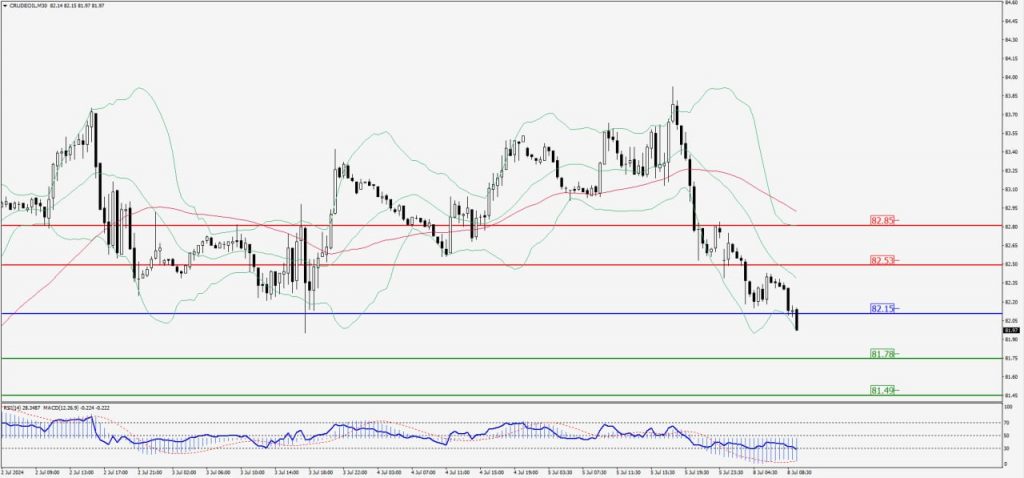
Green Lines Indicate Resistance Levels – Red Lines Indicate Support Levels
Light Blue is a Pivot Point – Black represents the price when the report was produced
XAU/USD Intraday: Trend on the downside
Our pivot point is 2382.80
Preferable Price Action: Further downside to 2373.70 and 2364.90.
Alternative Price Action: If the price gives an upside breakout of a pivot, then the price extends to 2392.10 and 2399.30.
Comment: MACD is below 50 levels and Pairs below its 20MA.
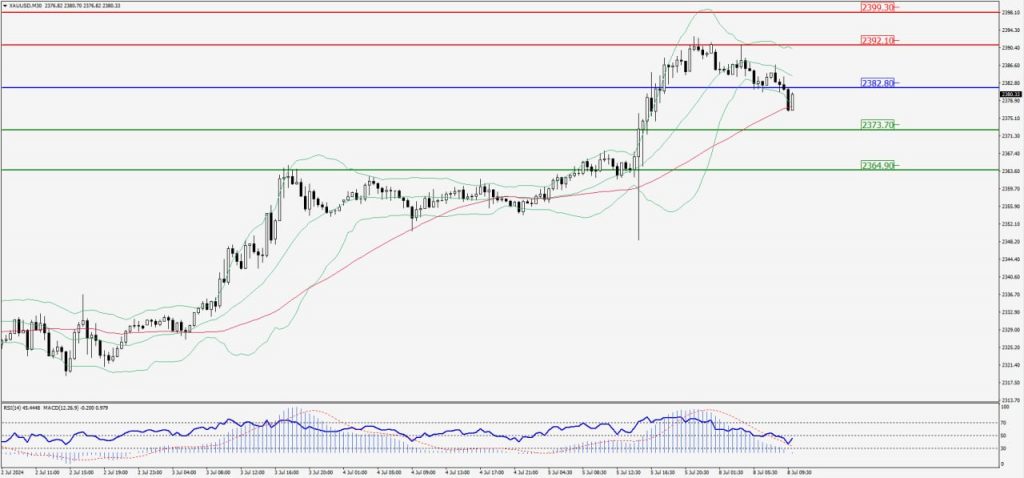
Green Lines Indicate Resistance Levels – Red Lines Indicate Support Levels
Light Blue is a Pivot Point – Black represents the price when the report was produced
Dow Jones Intraday: Trend on the upside
Our pivot point is 39,303.10
Preferable Price Action: Take buy positions above the pivot with targets at 39,358.50 & 39,409.30.
Alternative Price Action: Below 39,303.10 looks for further downside to 39,245.10 & 39,192.90.
Comment: RSI is above 50 levels.
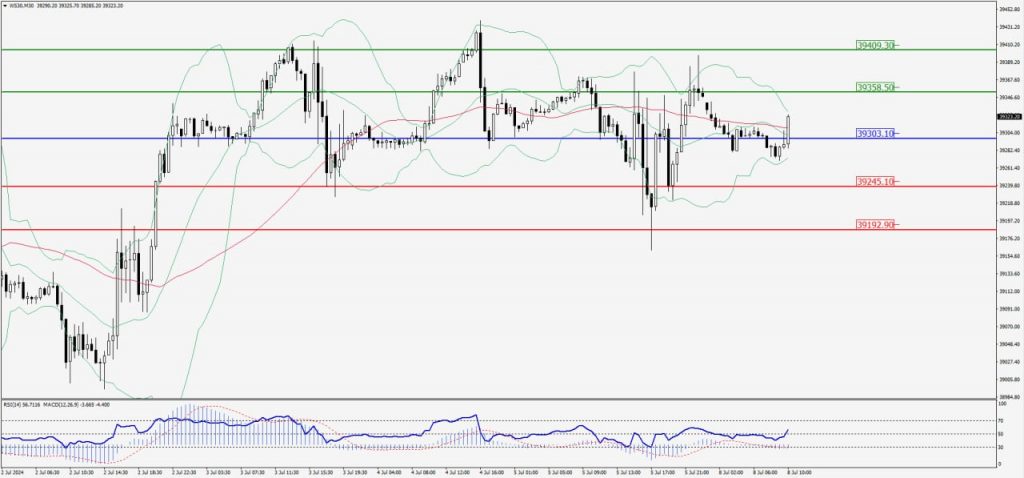
Green Lines Indicate Resistance Levels – Red Lines Indicate Support Levels
Light Blue is a Pivot Point – Black represents the price when the report was produced