EURO DAILY MARKET ANALYSIS REPORT
📊 Daily Technical & Fundamental Analysis – EUR/USD (February 6, 2025)
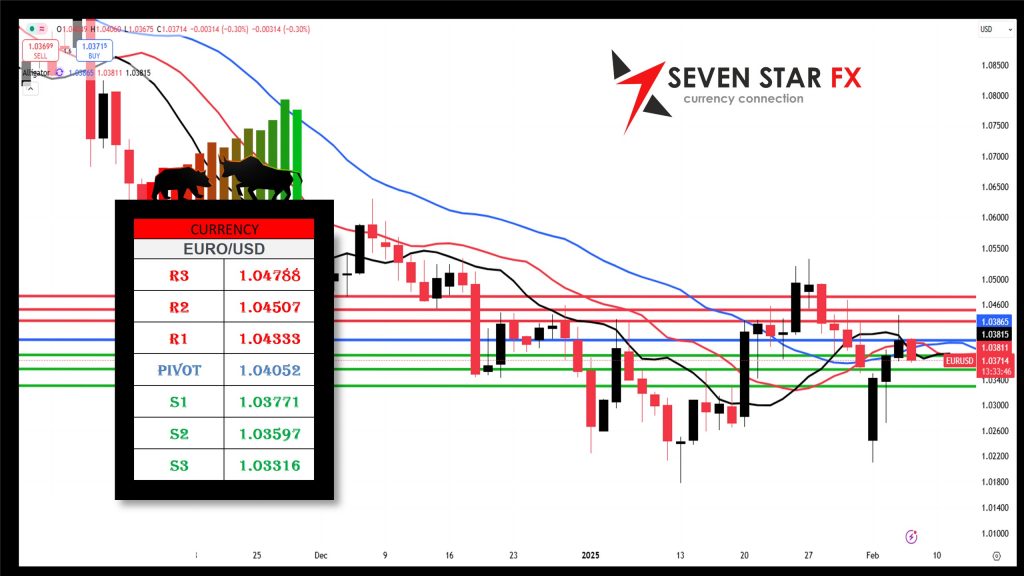
🔹 Pivot Points for EUR/USD
📌 Resistance Levels:
🔺 R3: 1.04788
🔺 R2: 1.04507
🔺 R1: 1.04333
📌 Pivot Point: 1.04052
📌 Support Levels:
🔻 S1: 1.03771
🔻 S2: 1.03597
🔻 S3: 1.03316
👉 Market Implication:
- If EUR/USD trades above the pivot (1.04052), it may challenge resistance levels, with 1.04333 (R1) as the first key zone.
- A drop below the pivot suggests downside potential, with support levels (S1-S3) acting as key price zones.
📈 Fibonacci Retracement Analysis
Using a recent high of 1.0485 and a low of 1.0340, the Fibonacci retracement levels are:
🔸 38.2% Retracement: 1.0398 (Support zone)
🔸 50% Retracement: 1.0412 (Psychological level, near pivot)
🔸 61.8% Retracement: 1.0426 (Resistance zone, close to R1)
📍 These levels align with pivot points, making them crucial areas for breakouts or reversals.
📊 MACD & Momentum Indicators
📈 MACD Value: 0.0019 – Early signs of a bullish crossover.
✔️ If the MACD line crosses above the signal line, a buy signal could emerge.
❌ If the MACD turns negative, the bearish trend may continue.
📍 RSI (Relative Strength Index): 50.2 – Neutral territory, indicating no extreme overbought or oversold conditions.
🌍 Fundamental Analysis
📌 ECB Policy & Eurozone Growth Concerns
- The European Central Bank (ECB) held rates at 2.75%, emphasizing data dependence.
- Eurozone Inflation: January CPI held at 2.5%, above the 2% ECB target, delaying rate cut expectations.
📌 US Dollar Strength & Federal Reserve Policy
- Speculation of a Fed rate cut in Q2 2025 has pressured the USD.
- However, strong U.S. labor market data and resilient GDP growth may keep the Fed cautious, limiting dollar weakness.
📌 Key Economic Developments
- Germany & France GDP contractions raise concerns over Eurozone stagnation.
- U.S. ADP Non-Farm Employment data (later today) could drive short-term EUR/USD volatility.
📈 Outlook for EUR/USD
📊 Bullish Scenario:
A break above 1.0426 (61.8% Fibonacci level) could push EUR/USD toward 1.04333 (R1) and 1.04507 (R2) if bullish momentum continues.
📉 Bearish Scenario:
A drop below 1.03771 (S1) could accelerate selling toward 1.03597 (S2), with 1.03316 (S3) acting as a strong support zone.
📍 Neutral/Balanced View:
Given Eurozone growth concerns but persistent inflation, EUR/USD may consolidate between 1.0370 – 1.0430 until key economic data or central bank decisions provide further direction.
✅ Final Thoughts & Key Takeaways
🔹 Key Levels to Watch:
✔️ Bullish breakout: 1.0426 (61.8% Fibonacci)
❌ Bearish breakdown: 1.03771 (S1)
🔹 Fundamental Drivers:
- ECB’s stance on inflation vs. growth
- U.S. economic data & Fed policy tone
- Eurozone GDP weakness impacting sentiment
🔹 Technical Indicators Suggest:
- MACD is slightly bullish, awaiting confirmation.
- RSI is neutral, signaling consolidation potential.
📌 Strategy: Monitor breakouts at resistance/support levels and key economic data for confirmation. 🚀
Disclaimer
This analysis is for educational purposes only. Forex trading is highly volatile and carries significant risks. Always use proper risk and money management strategies as trading without them can lead to substantial financial loss.
GBP/USD DAILY MARKET ANALYSIS REPORT
📊 Daily Technical & Fundamental Analysis – GBP/USD (February 6, 2025)
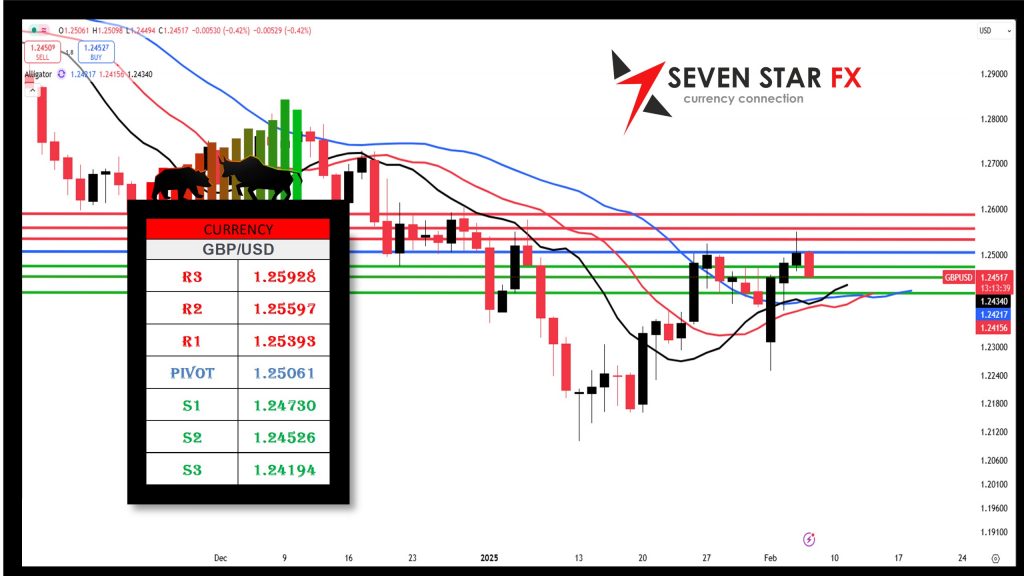
🔹 Pivot Points for GBP/USD
📌 Resistance Levels:
🔺 R3: 1.25928
🔺 R2: 1.25597
🔺 R1: 1.25393
📌 Pivot Point: 1.25061
📌 Support Levels:
🔻 S1: 1.24730
🔻 S2: 1.24526
🔻 S3: 1.24194
👉 Market Implication:
- If GBP/USD trades above the pivot (1.25061), it may test resistance levels, with 1.25393 (R1) as the first key level.
- A drop below the pivot suggests downside risk, with S1-S3 acting as key support levels.
📈 Fibonacci Retracement Analysis
Using a recent high of 1.2575 and a low of 1.2430, the Fibonacci retracement levels are:
🔸 38.2% Retracement: 1.2498 (Support zone, near pivot)
🔸 50% Retracement: 1.2502 (Psychological level)
🔸 61.8% Retracement: 1.2526 (Resistance zone, close to R1)
📍 These levels align with pivot points, making them important areas for potential breakouts or reversals.
📊 MACD & Momentum Indicators
📈 MACD Value: 0.0015 – Signs of a potential bullish crossover.
✔️ If the MACD line crosses above the signal line, it could signal a buy opportunity.
❌ If the MACD turns negative, the bearish trend may persist.
📍 RSI (Relative Strength Index): 51.3 – Neutral territory, suggesting no extreme overbought or oversold conditions.
🌍 Fundamental Analysis
📌 Bank of England (BoE) Rate Decision & UK Economic Outlook
- The BoE is expected to hold interest rates at 5.25%, but traders will closely monitor its guidance.
- UK inflation remains above target, which could delay rate cuts.
- Recent UK GDP figures suggest sluggish growth, raising concerns over a potential slowdown.
📌 US Dollar Strength & Federal Reserve Policy
- Fed rate cut expectations for Q2 2025 have pressured the USD.
- However, resilient U.S. labor data and strong economic indicators may limit USD weakness.
📌 Key Economic Developments
- UK Services PMI showed moderate expansion, supporting GBP.
- U.S. Jobless Claims data (later today) could drive GBP/USD volatility.
📈 Outlook for GBP/USD
📊 Bullish Scenario:
A break above 1.2526 (61.8% Fibonacci level) could push GBP/USD toward 1.25393 (R1) and 1.25597 (R2) if bullish momentum strengthens.
📉 Bearish Scenario:
A drop below 1.24730 (S1) could accelerate selling toward 1.24526 (S2), with 1.24194 (S3) acting as strong support.
📍 Neutral/Balanced View:
Given BoE’s cautious stance and Fed uncertainty, GBP/USD may consolidate between 1.2470 – 1.2530 until clearer economic signals emerge.
✅ Final Thoughts & Key Takeaways
🔹 Key Levels to Watch:
✔️ Bullish breakout: 1.2526 (61.8% Fibonacci)
❌ Bearish breakdown: 1.24730 (S1)
🔹 Fundamental Drivers:
- BoE’s stance on inflation & rate cuts
- U.S. economic data & Fed policy tone
- UK economic slowdown concerns
🔹 Technical Indicators Suggest:
- MACD is slightly bullish, awaiting confirmation.
- RSI is neutral, signaling potential consolidation.
📌 Strategy: Watch for breakouts at key resistance/support levels and monitor BoE & Fed developments for directional confirmation. 🚀
Disclaimer
This analysis is for educational purposes only. Forex trading is highly volatile and carries significant risks. Always use proper risk and money management strategies as trading without them can lead to substantial financial loss.
USD/JPY DAILY MARKET ANALYSIS REPORT

📊 Daily Technical & Fundamental Analysis – USD/JPY (February 6, 2025)
🔹 Pivot Points for USD/JPY
📌 Resistance Levels:
🔺 R3: 155.082
🔺 R2: 154.232
🔺 R1: 153.707
📌 Pivot Point: 152.857
📌 Support Levels:
🔻 S1: 152.007
🔻 S2: 151.482
🔻 S3: 150.632
👉 Market Implication:
- If USD/JPY trades above the pivot (152.857), it may test resistance levels, with 153.707 (R1) as the first key zone.
- A drop below the pivot suggests downside potential, with S1-S3 acting as strong support zones.
📈 Fibonacci Retracement Analysis
Using a recent high of 155.20 and a low of 150.50, the Fibonacci retracement levels are:
🔸 38.2% Retracement: 152.98 (Support zone, near pivot)
🔸 50% Retracement: 152.85 (Psychological level, at pivot)
🔸 61.8% Retracement: 153.45 (Resistance zone, close to R1)
📍 These levels align with pivot points, making them important areas for potential breakouts or reversals.
📊 MACD & Momentum Indicators
📈 MACD Value: 0.0028 – Early signs of a bullish crossover.
✔️ If the MACD line crosses above the signal line, it could indicate a buy opportunity.
❌ If the MACD turns negative, bearish momentum may strengthen.
📍 RSI (Relative Strength Index): 53.7 – Slightly bullish, but not overbought.
🌍 Fundamental Analysis
📌 Bank of Japan (BoJ) Policy & Yen Outlook
- The Bank of Japan (BoJ) maintains its ultra-loose policy, keeping rates near zero.
- Speculation is rising over a possible BoJ rate hike later in 2025, but no immediate action is expected.
📌 US Dollar Strength & Federal Reserve Policy
- Expectations of a Fed rate cut in Q2 2025 have pressured the USD, but strong U.S. economic data has provided support.
- U.S. Treasury yields remain elevated, limiting yen strength.
📌 Key Economic Developments
- Japan’s Services PMI showed contraction, raising concerns over domestic growth.
- U.S. ADP Non-Farm Employment (due later today) could drive USD/JPY volatility.
📈 Outlook for USD/JPY
📊 Bullish Scenario:
A break above 153.45 (61.8% Fibonacci level) could push USD/JPY toward 153.707 (R1) and 154.232 (R2) if bullish momentum continues.
📉 Bearish Scenario:
A drop below 152.007 (S1) could accelerate selling toward 151.482 (S2), with 150.632 (S3) acting as strong support.
📍 Neutral/Balanced View:
Given BoJ’s dovish stance but U.S. economic resilience, USD/JPY may consolidate between 152.50 – 153.70 until key economic data provides a clearer direction.
✅ Final Thoughts & Key Takeaways
🔹 Key Levels to Watch:
✔️ Bullish breakout: 153.45 (61.8% Fibonacci)
❌ Bearish breakdown: 152.007 (S1)
🔹 Fundamental Drivers:
- BoJ’s stance on interest rates
- U.S. economic data & Fed policy outlook
- Japanese economic slowdown concerns
🔹 Technical Indicators Suggest:
- MACD is slightly bullish, awaiting confirmation.
- RSI is slightly bullish, but no overbought signals yet.
📌 Strategy: Watch for breakouts at key resistance/support levels and monitor BoJ & Fed developments for trend confirmation. 🚀
Disclaimer
This analysis is for educational purposes only. Forex trading is highly volatile and carries significant risks. Always use proper risk and money management strategies, as trading without them can result in substantial financial loss.
AUSTRALIAN DOLLAR DAILY MARKET ANALYSIS REPORT

📊 Daily Technical & Fundamental Analysis – AUD/USD (February 6, 2025)
🔹 Pivot Points for AUD/USD
📌 Resistance Levels:
🔺 R3: 0.63308
🔺 R2: 0.63091
🔺 R1: 0.62958
📌 Pivot Point: 0.62741
📌 Support Levels:
🔻 S1: 0.62524
🔻 S2: 0.62391
🔻 S3: 0.62174
👉 Market Implication:
- If AUD/USD trades above the pivot (0.62741), it may test resistance levels, with 0.62958 (R1) as the first key zone.
- A drop below the pivot suggests downside potential, with S1-S3 acting as key support zones.
📈 Fibonacci Retracement Analysis
Using a recent high of 0.6340 and a low of 0.6210, the Fibonacci retracement levels are:
🔸 38.2% Retracement: 0.6268 (Support zone, near pivot)
🔸 50% Retracement: 0.6275 (Psychological level, near pivot)
🔸 61.8% Retracement: 0.6288 (Resistance zone, near R1)
📍 These levels align with pivot points, making them crucial areas for potential breakouts or reversals.
📊 MACD & Momentum Indicators
📈 MACD Value: 0.0004 – Early signs of a bullish crossover.
✔️ If the MACD line crosses above the signal line, a buy signal could emerge.
❌ If the MACD turns negative, the bearish trend may continue.
📍 RSI (Relative Strength Index): 49.2 – Neutral territory, indicating no extreme overbought or oversold conditions.
🌍 Fundamental Analysis
📌 Reserve Bank of Australia (RBA) Policy & Australian Economic Outlook
- The RBA’s monetary policy is under scrutiny, as growth concerns persist in Australia, particularly regarding the retail sector.
- Recent Australian employment data suggests a soft labor market, raising doubts about future rate hikes.
📌 US Dollar Strength & Federal Reserve Policy
- Fed rate cut expectations for Q2 2025 have pressured the USD, but resilient U.S. economic data keeps the dollar supported.
- Strong U.S. GDP growth may limit further downside for USD.
📌 Key Economic Developments
- Australian retail sales missed expectations, adding pressure to the AUD.
- U.S. ADP Non-Farm Employment data (due later today) could drive volatility in AUD/USD.
📈 Outlook for AUD/USD
📊 Bullish Scenario:
A break above 0.6288 (61.8% Fibonacci level) could push AUD/USD toward 0.62958 (R1) and 0.63091 (R2) if bullish momentum continues.
📉 Bearish Scenario:
A drop below 0.62524 (S1) could accelerate selling toward 0.62391 (S2), with 0.62174 (S3) acting as strong support.
📍 Neutral/Balanced View:
Given retail sector weakness in Australia and Fed uncertainty, AUD/USD may consolidate between 0.6250 – 0.6290 until further data or central bank decisions provide clearer direction.
✅ Final Thoughts & Key Takeaways
🔹 Key Levels to Watch:
✔️ Bullish breakout: 0.6288 (61.8% Fibonacci)
❌ Bearish breakdown: 0.62524 (S1)
🔹 Fundamental Drivers:
- RBA’s stance on inflation and growth
- U.S. economic data & Fed policy outlook
- Weakness in Australian retail sales
🔹 Technical Indicators Suggest:
- MACD is slightly bullish, awaiting confirmation.
- RSI is neutral, suggesting potential consolidation.
📌 Strategy: Watch for breakouts at key resistance/support levels and monitor economic data for trend confirmation. 🚀
Disclaimer
This analysis is for educational purposes only. Trading Crude Oil is highly volatile and carries significant risks. Always use proper risk and money management strategies, as trading without them can result in substantial financial loss.
CRUDE OIL DAILY MARKET ANALYSIS REPORT

📊 Daily Technical & Fundamental Analysis – Crude Oil (February 6, 2025)
🔹 Pivot Points for Crude Oil
📌 Resistance Levels:
🔺 R3: 73.62
🔺 R2: 72.88
🔺 R1: 72.42
📌 Pivot Point: 71.68
📌 Support Levels:
🔻 S1: 70.94
🔻 S2: 70.48
🔻 S3: 69.74
👉 Market Implication:
- If Crude Oil trades above the pivot (71.68), it may test resistance levels, with 72.42 (R1) as the first key level.
- A drop below the pivot suggests downside potential, with S1-S3 acting as key support levels.
📈 Fibonacci Retracement Analysis
Using a recent high of 74.00 and a low of 69.50, the Fibonacci retracement levels are:
🔸 38.2% Retracement: 71.77 (Support zone, near pivot)
🔸 50% Retracement: 71.75 (Psychological level, near pivot)
🔸 61.8% Retracement: 72.20 (Resistance zone, near R1)
📍 These levels align with pivot points, making them crucial for potential breakouts or reversals.
📊 MACD & Momentum Indicators
📈 MACD Value: 0.12 – Neutral-to-bullish crossover.
✔️ If the MACD line crosses above the signal line, it could signal a buy opportunity.
❌ If the MACD turns negative, the bearish trend may persist.
📍 RSI (Relative Strength Index): 54.1 – Neutral, but slightly above 50, indicating a mild bullish sentiment.
🌍 Fundamental Analysis
📌 Global Demand Concerns & OPEC+ Outlook
- Crude oil prices are under pressure due to fears about slowing global demand, especially in China and emerging markets.
- OPEC+ production cuts are supporting prices, but the market remains cautious about the impact of potential economic slowdowns.
📌 U.S. Economic Outlook & Dollar Impact
- The strong U.S. dollar is weighing on crude oil prices, as commodity prices are often inversely correlated with the greenback.
- U.S. GDP growth remains resilient, limiting further downside for crude oil.
📌 Geopolitical Developments & Supply Issues
- Geopolitical tensions, especially in the Middle East, could lead to supply disruptions, adding volatility to crude oil prices.
- Crude oil inventories (due later today) could trigger short-term price fluctuations.
📈 Outlook for Crude Oil
📊 Bullish Scenario:
A break above 72.42 (R1) could push crude oil prices toward 72.88 (R2) and 73.62 (R3) if bullish momentum strengthens.
📉 Bearish Scenario:
A drop below 70.94 (S1) could accelerate selling toward 70.48 (S2), with 69.74 (S3) acting as strong support.
📍 Neutral/Balanced View:
Given demand concerns and OPEC+ cuts, crude oil may consolidate between 70.50 – 72.50 until further data or geopolitical developments provide clearer direction.
✅ Final Thoughts & Key Takeaways
🔹 Key Levels to Watch:
✔️ Bullish breakout: 72.42 (R1)
❌ Bearish breakdown: 70.94 (S1)
🔹 Fundamental Drivers:
- Global demand concerns & OPEC+ policies
- U.S. economic resilience & strong dollar
- Geopolitical risks affecting supply
🔹 Technical Indicators Suggest:
- MACD is neutral-to-bullish, awaiting further confirmation.
- RSI is neutral, signaling a balanced market sentiment.
📌 Strategy: Watch for breakouts at key resistance/support levels and monitor geopolitical developments for trend confirmation. 🚀
Disclaimer
This analysis is for educational purposes only. Trading Crude Oil is highly volatile and carries significant risks. Always use proper risk and money management strategies, as trading without them can result in substantial financial loss.
XAU/USD DAILY MARKET ANALYSIS REPORT

📊 Daily Technical & Fundamental Analysis – XAU/USD (Gold) (February 6, 2025)
🔹 Pivot Points for XAU/USD (Gold)
📌 Resistance Levels:
🔺 R3: 2905.72
🔺 R2: 2889.44
🔺 R1: 2879.38
📌 Pivot Point: 2863.10
📌 Support Levels:
🔻 S1: 2846.82
🔻 S2: 2836.76
🔻 S3: 2820.48
👉 Market Implication:
- If XAU/USD trades above the pivot (2863.10), it may test resistance levels, with 2879.38 (R1) and 2889.44 (R2) acting as key zones.
- A drop below the pivot suggests downside potential, with S1-S3 acting as strong support levels.
📈 Fibonacci Retracement Analysis
Using a recent high of 2905.00 and a low of 2820.00, the Fibonacci retracement levels are:
🔸 38.2% Retracement: 2869.52 (Near pivot)
🔸 50% Retracement: 2862.50 (Psychological level, near pivot)
🔸 61.8% Retracement: 2855.23 (Support zone, near S1)
📍 These levels align with pivot points, making them crucial for potential breakouts or reversals.
📊 MACD & Momentum Indicators
📈 MACD Value: 0.68 – Bullish crossover in place.
✔️ If the MACD line stays above the signal line, bullish momentum is likely to continue, with buy signals emerging.
❌ If the MACD turns negative, the bearish trend may resurface.
📍 RSI (Relative Strength Index): 55.3 – Neutral, but above 50, indicating a slight bullish sentiment.
🌍 Fundamental Analysis
📌 Gold as a Safe-Haven Asset
- Gold remains a key safe-haven asset amidst global economic uncertainty and Fed policy expectations.
- Gold prices are likely to rise if Fed rate cuts materialize, as investors seek alternative investments due to weaker U.S. dollar expectations.
📌 U.S. Dollar & Federal Reserve Policy
- Speculation over Fed rate cuts continues to put pressure on the U.S. dollar, helping to support gold prices.
- Gold’s demand tends to rise when interest rates are expected to fall, and this trend has intensified due to speculation for 2025.
📌 Geopolitical Concerns & Inflation
- Geopolitical risks, particularly in the Middle East and Asia, continue to provide support for gold as investors seek to hedge against uncertainty.
- Inflation data remains critical as higher inflation typically leads to increased gold demand for portfolio protection.
📈 Outlook for XAU/USD (Gold)
📊 Bullish Scenario:
A break above 2879.38 (R1) could push XAU/USD toward 2889.44 (R2) and 2905.72 (R3) if bullish momentum continues.
📉 Bearish Scenario:
A drop below 2846.82 (S1) could accelerate selling toward 2836.76 (S2) and 2820.48 (S3) if the market turns bearish.
📍 Neutral/Balanced View:
Given speculation over Fed policy and global uncertainties, gold may consolidate between 2846.00 – 2879.00 until further data or geopolitical shifts provide clearer direction.
✅ Final Thoughts & Key Takeaways
🔹 Key Levels to Watch:
✔️ Bullish breakout: 2879.38 (R1)
❌ Bearish breakdown: 2846.82 (S1)
🔹 Fundamental Drivers:
- Fed rate cut expectations boosting gold
- U.S. dollar weakness and inflation concerns
- Geopolitical instability supporting gold’s safe-haven demand
🔹 Technical Indicators Suggest:
- MACD is bullish, signaling momentum may continue.
- RSI is neutral, but with a slight tilt towards bullish sentiment.
📌 Strategy: Watch for breakouts at key resistance/support levels and monitor geopolitical events for further trend confirmation. 🚀
Disclaimer
This analysis is for educational purposes only. Gold trading is highly volatile and carries significant risks. Always use proper risk and money management strategies, as trading without them can result in substantial financial loss.
DOW JONES DAILY MARKET ANALYSIS REPORT

📊 Daily Technical & Fundamental Analysis – Dow Jones (February 6, 2025)
🔹 Pivot Points for Dow Jones (DJIA)
📌 Resistance Levels:
🔺 R3: 44763.28
🔺 R2: 44660.45
🔺 R1: 44596.92
📌 Pivot Point: 44494.09
📌 Support Levels:
🔻 S1: 44391.26
🔻 S2: 44327.73
🔻 S3: 44224.90
👉 Market Implication:
- If Dow Jones trades above the pivot (44494.09), it may test resistance levels, with 44596.92 (R1) and 44660.45 (R2) as key zones.
- A drop below the pivot suggests downside potential, with S1-S3 acting as strong support levels.
📈 Fibonacci Retracement Analysis
Using a recent high of 44750.00 and a low of 44200.00, the Fibonacci retracement levels are:
🔸 38.2% Retracement: 44456.20 (Near pivot)
🔸 50% Retracement: 44425.00 (Psychological level, near pivot)
🔸 61.8% Retracement: 44395.00 (Support zone, near S1)
📍 These levels align with pivot points, making them crucial for potential breakouts or reversals.
📊 MACD & Momentum Indicators
📈 MACD Value: 0.124 – Neutral-to-bullish crossover in place.
✔️ If the MACD line stays above the signal line, bullish momentum is likely to continue, with buy signals emerging.
❌ If the MACD turns negative, the bearish trend may resume.
📍 RSI (Relative Strength Index): 53.5 – Neutral, with a slight tilt towards bullish sentiment.
🌍 Fundamental Analysis
📌 Tech Sector Weakness Impacting Dow
- Dow Jones remains under pressure from tech sector weakness following disappointing earnings reports from major players like Alphabet and AMD.
- Concerns over slowing earnings growth in the tech sector are contributing to increased volatility in the index.
📌 U.S. Economic Data & Fed Policy Expectations
- U.S. economic resilience continues to support equity markets, although expectations for Fed rate cuts in Q2 2025 are contributing to market uncertainty.
- U.S. labor data (ADP non-farm employment) due later today could offer clues on future Fed actions, influencing the Dow’s direction.
📌 Global Geopolitical Concerns & Supply Chain Issues
- Geopolitical risks, especially in the Middle East and Asia, could add volatility to U.S. equities.
- Supply chain disruptions and inflation concerns could weigh on corporate profits, leading to downside risks in the stock market.
📈 Outlook for Dow Jones (DJIA)
📊 Bullish Scenario:
A break above 44596.92 (R1) could push Dow Jones toward 44660.45 (R2) and 44763.28 (R3) if bullish momentum remains strong.
📉 Bearish Scenario:
A drop below 44391.26 (S1) could accelerate selling toward 44327.73 (S2) and 44224.90 (S3) if the market turns bearish.
📍 Neutral/Balanced View:
Given tech sector weakness and Fed uncertainty, the Dow may consolidate between 44350.00 – 44500.00 until economic data or central bank decisions provide further direction.
✅ Final Thoughts & Key Takeaways
🔹 Key Levels to Watch:
✔️ Bullish breakout: 44596.92 (R1)
❌ Bearish breakdown: 44391.26 (S1)
🔹 Fundamental Drivers:
- Weakness in tech stocks affecting overall sentiment
- Fed rate cut expectations and U.S. economic data
- Geopolitical risks and supply chain issues
🔹 Technical Indicators Suggest:
- MACD is neutral-to-bullish, signaling potential for continued upside.
- RSI is neutral, but with a slight bullish bias.
📌 Strategy: Watch for breakouts at key resistance/support levels and monitor economic and geopolitical developments for trend confirmation. 🚀
Disclaimer
This analysis is for educational purposes only. Bitcoin trading is highly volatile and carries significant risks. Always use proper risk and money management strategies, as trading without them can result in substantial financial loss.
BITCOIN DAILY MARKET ANALYSIS REPORT

📊 Daily Technical & Fundamental Analysis – Bitcoin (BTC/USD) (February 6, 2025)
🔹 Pivot Points for Bitcoin (BTC/USD)
📌 Resistance Levels:
🔺 R3: 100357.62
🔺 R2: 99217.23
🔺 R1: 98512.69
📌 Pivot Point: 97372.3
📌 Support Levels:
🔻 S1: 96231.91
🔻 S2: 95527.37
🔻 S3: 94386.98
👉 Market Implication:
- If Bitcoin trades above the pivot (97372.3), it may test resistance levels, with 98512.69 (R1) and 99217.23 (R2) as potential price zones.
- A drop below the pivot suggests downside potential, with S1-S3 acting as critical support levels.
📈 Fibonacci Retracement Analysis
Using a recent high of 100000.00 and a low of 94300.00, the Fibonacci retracement levels are:
🔸 38.2% Retracement: 97376.25 (Near pivot)
🔸 50% Retracement: 97150.00 (Psychological level, near pivot)
🔸 61.8% Retracement: 96800.00 (Support zone, near S1)
📍 These Fibonacci levels align with pivot points, making them critical for potential breakouts or reversals.
📊 MACD & Momentum Indicators
📈 MACD Value: 356.10 – Bullish crossover confirmed.
✔️ If the MACD line continues above the signal line, bullish momentum is likely to persist, with buy signals confirmed.
❌ If the MACD turns negative, the bearish trend may resurface.
📍 RSI (Relative Strength Index): 59.2 – Neutral, but above 50, indicating a slight bullish sentiment.
🌍 Fundamental Analysis
📌 Bitcoin’s Safe-Haven Appeal
- Bitcoin continues to perform well amid global uncertainty, attracting attention from both retail and institutional investors.
- As traditional markets face volatility, Bitcoin’s appeal as a safe-haven asset grows.
📌 U.S. Dollar Weakness & Fed Policy
- Growing expectations of Federal Reserve rate cuts have put pressure on the U.S. dollar, which is beneficial for Bitcoin as investors seek alternative assets.
- If the Fed cuts rates in the coming months, it could further bolster Bitcoin prices.
📌 Institutional Interest
- Institutional investments into Bitcoin have continued to rise, with increasing adoption by major financial institutions, pushing Bitcoin higher.
- Increased mainstream adoption is expected to continue, which could push prices to new highs.
📈 Outlook for Bitcoin (BTC/USD)
📊 Bullish Scenario:
A break above 98512.69 (R1) could push Bitcoin toward 99217.23 (R2) and 100357.62 (R3) if bullish momentum remains strong.
📉 Bearish Scenario:
A drop below 96231.91 (S1) could accelerate selling toward 95527.37 (S2) and 94386.98 (S3) if the market turns bearish.
📍 Neutral/Balanced View:
Given strong institutional interest and Fed rate cut speculation, Bitcoin may consolidate between 96200.00 – 98500.00 until economic data or policy decisions provide clearer direction.
✅ Final Thoughts & Key Takeaways
🔹 Key Levels to Watch:
✔️ Bullish breakout: 98512.69 (R1)
❌ Bearish breakdown: 96231.91 (S1)
🔹 Fundamental Drivers:
- Fed policy expectations and U.S. dollar weakness
- Increasing institutional interest in Bitcoin
- Geopolitical instability and Bitcoin’s role as a safe haven
🔹 Technical Indicators Suggest:
- MACD is bullish, confirming the potential for continued upside.
- RSI is neutral, indicating the potential for consolidation but with a slight bullish bias.
📌 Strategy: Watch for breakouts at key resistance/support levels and monitor macroeconomic trends for further trend confirmation. 🚀
Disclaimer
This analysis is for educational purposes only. Bitcoin trading is highly volatile and carries significant risks. Always use proper risk and money management strategies, as trading without them can result in substantial financial loss.
————————————————————————————————————————————————————————————————————————————-
Notice: The data presented is derived from technical analysis and does not constitute financial advice. For those trading in forex, consulting a qualified financial advisor prior to making investment decisions is strongly recommended.
Caution: The information above reflects ongoing technical analysis and should not be interpreted as financial advice. Forex trading involves high volatility, and without proper knowledge, you risk losing all your capital. It is essential to consult with a financial advisor before investing.
Advisory: The insights shared are the result of technical analysis and are not intended as financial advice. Forex traders should seek advice from professional financial advisors before making any investment decisions. Remember, the forex market is highly volatile, and trading without adequate knowledge can lead to significant losses.
Important: The analysis provided is for informational purposes only and should not be seen as financial advice. Forex trading carries substantial risks, and it is advisable to consult financial advisors before proceeding with any investments. This content is intended solely for Wealth Management Education purposes.