Market Wrap: Stocks, Bonds, Commodities
Most Asian currencies drifted higher on Thursday as traders maintained bets on a December interest rate cut by the U.S. Federal Reserve, while the South Korean won weakened further amid heightened political uncertainty in the country.
The Dow Jones Industrial Average rose 308.51 points to 45,014.04, the S&P 500 gain 0.61% to 6,086.49 and the Nasdaq Composite up 254.21 points to 19,735.12.
MSCI’s index of Asia-Pacific stocks outside Japan is down 0.20% to 716.00 levels. The Australian index was higher by 0.15% to 8,474.90. Japanese Nikkei Index increase 0.38% today.
European stocks were mixed on Thursday, with the Stoxx Europe 50 Index increase 0.83% to 4,919.15 Germany’s DAX ascend 1.08% to 20,232.14, and France’s CAC higher 0.66% to 7,303.28 and U.K.’s FTSE 100 loss 0.28% to 8,335.81.
Benchmark 10-year U.S. Treasury rose as demand for safe assets slipped again, today 10-year bond yields 0.26% to 4.1930.
Oil prices were mostly stable on Thursday ahead of an OPEC+ meeting later in the day, with investors waiting to see what the producer group would do next on supply cuts while also monitoring geopolitical tension in the Middle East.
Spot Brent crude oil increase 0.12% to $72.40 per barrel. US West Texas Intermediate crude is increase 0.19% to $68.67 a barrel.
The yellow metal gold is down 0.19% to 2,671.10 dollars per ounce.
Market Wrap: Forex
Malaysia said on Thursday any attempt by the incoming Trump administration to impose tariffs on BRICS countries for trying to create a new currency or use alternatives to the dollar could cause global semiconductor supply chain disruptions.
Today, the U.S. dollar index measures the Greenback against a trade-weighted basket of six major currencies, which either descend 0.13% to 106.154.
The Euro US Dollar (EUR/USD) is a widely traded is up 0.16% today. This left the pair trading around $1.05260.
The Japanese yen was will move negative against the U.S. dollar on Thursday. Today USD/JPY is trades pair that decrease 0.52% to the 149.81 level.
Another commodity-related currency positive against the U.S dollar, AUD/USD gain 0.21% to 0.64420, and NZD/USD increase 0.38% to 0.58730 level.
EUR/USD Intraday: Support level at 1.05230
Our pivot point is at 1.05230
Preferable Price Action: Take buy positions above pivot level with targets at 1.05380 & 1.05530 in extension.
Alternative Price Action: Sell pivot looks for a further downside to 1.05080 & 1.04940.
Comment: RSI is above 50 levels and pairs above its 20MA & 55MA.
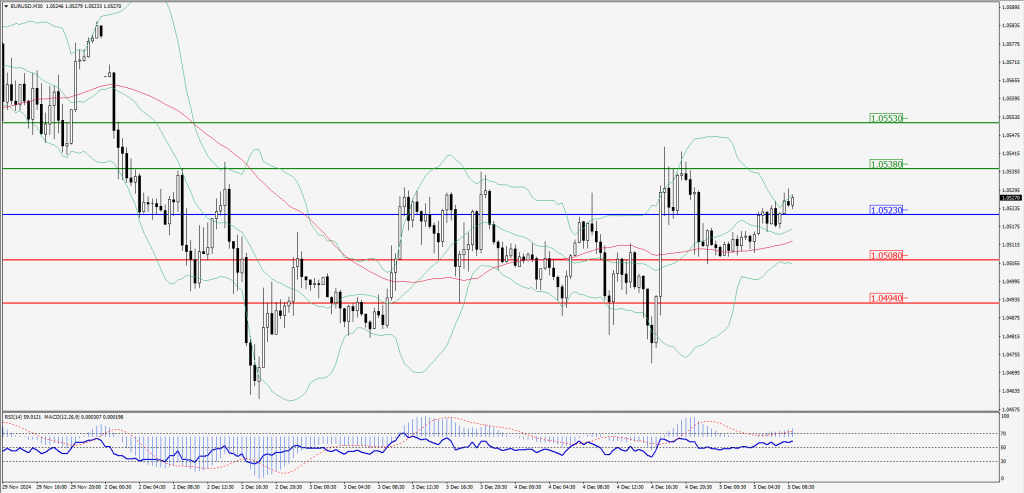
Green Lines Indicate Resistance Levels – Red Lines Indicate Support Levels
Light Blue is a Pivot Point – Black represents the price when the report was produced
GBP/USD Intraday: Trend on the upside
Our pivot point is at 1.27150
Preferable Price Action: Buy positions above pivot with targets at 1.27320 & 1.27460 in extension.
Alternative Price Action: The price below pivot would call for further downside to 1.26980 & 1.26830.
Comment: RSI is above 50 levels and pairs above its 55MA & 20MA.
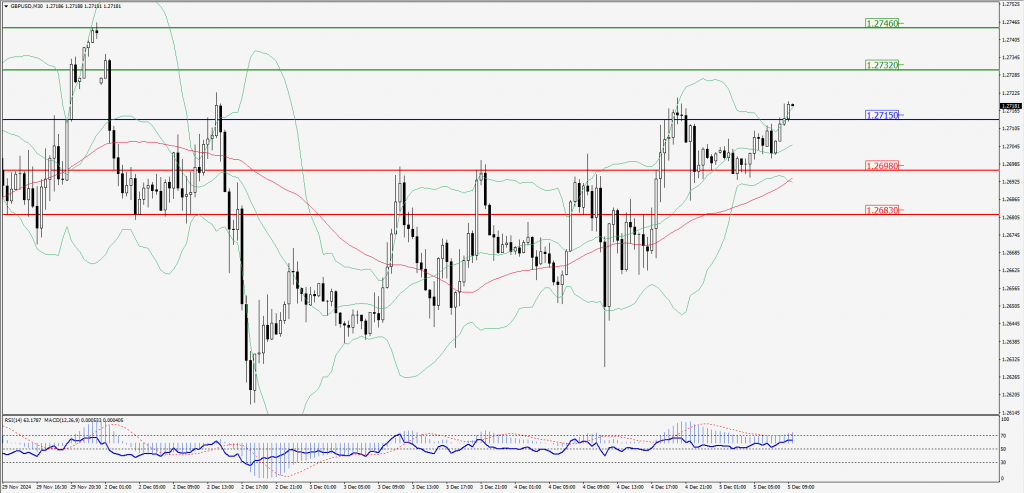
Green Lines Indicate Resistance Levels – Red Lines Indicate Support Levels
Light Blue is a Pivot Point – Black represents the price when the report was produced
USD/JPY Intraday: Trend on the downside
Our pivot point is at 149.930
Preferable Price Action: Sell position below pivot with the target at 149.610 and 149.300 in extension.
Alternative Price Action: The upside breakout of the pivot would call for 150.250 and 150.550.
Comment: MACD is below 50 levels and pairs below its 55MA & 20MA.
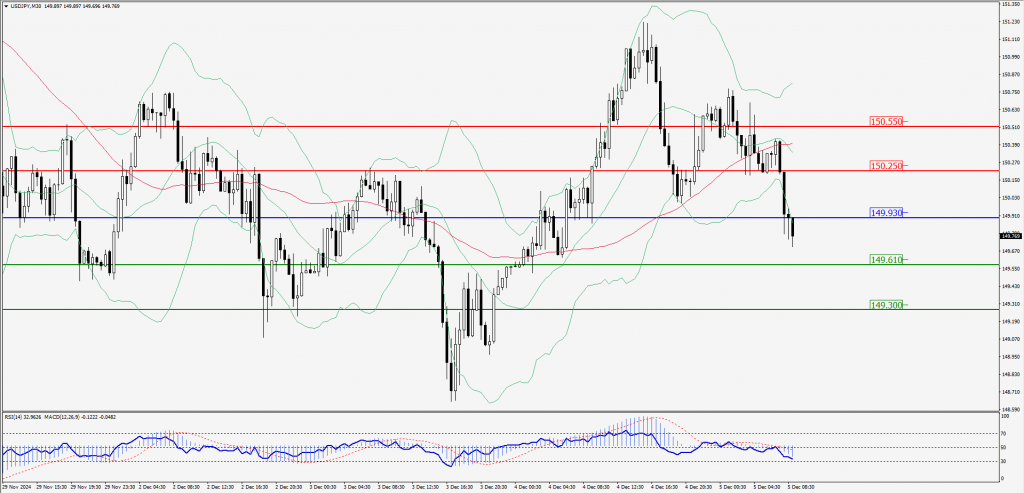
Green Lines Indicate Resistance Levels – Red Lines Indicate Support Levels
Light Blue is a Pivot Point – Black represents the price when the report was produced
AUD/USD Intraday: Trend on the upside
Our pivot point is at 0.64340
Preferable Price Action: Buy positions above pivot with targets at 0.64500 & 0.64650 in extension.
Alternative Price Action: Below pivot a further downside with 0.64180 & 0.64030 as targets.
Comment: RSI is above 50 levels and pairs above its 55MA & 20MA.
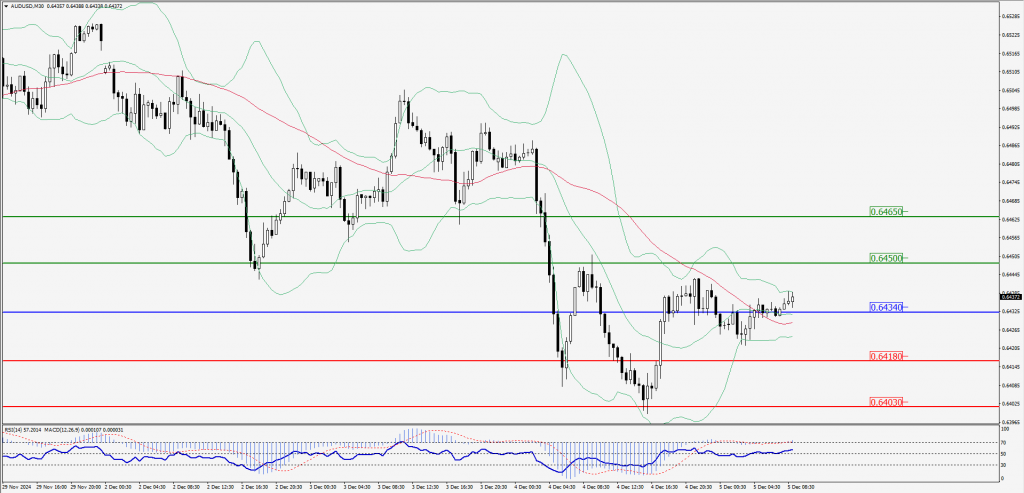
Green Lines Indicate Resistance Levels – Red Lines Indicate Support Levels
Light Blue is a Pivot Point – Black represents the price when the report was produced
CRUDEOIL Intraday: Trend on the downside
Our pivot point is at 68.44
Preferable Price Action: Below pivot sell oil with 68.09 & 67.79 as targets.
Alternative Price Action: Buy crude above pivot with targets at 68.81 & 69.12 in extension.
Comment: RSI is at below 50 levels and pairs below its 20MA & 55MA.
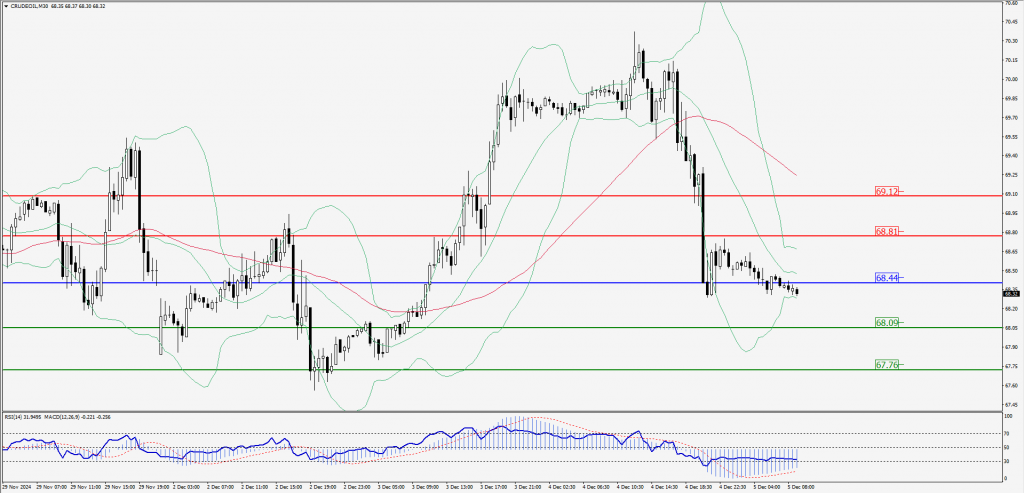
Green Lines Indicate Resistance Levels – Red Lines Indicate Support Levels
Light Blue is a Pivot Point – Black represents the price when the report was produced
XAU/USD Intraday: Trend on the downside
Our pivot point is at 2650.00
Preferable Price Action: Further downside to 2644.50 and 2639.30.
Alternative Price Action: If the price gives an upside breakout of a pivot, then the price extends to 2655.90 and 2660.90.
Comment: MACD is below 50 levels and pairs below its 20MA.
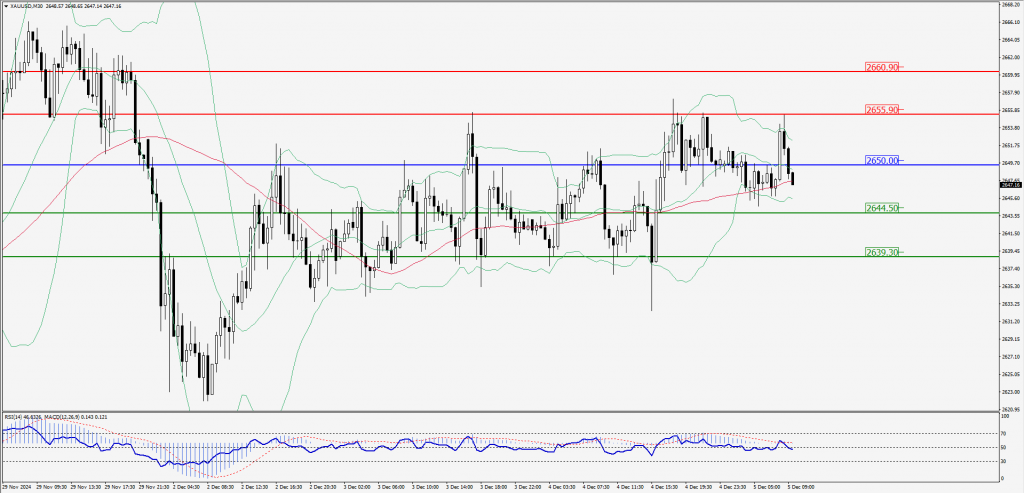
Green Lines Indicate Resistance Levels – Red Lines Indicate Support Levels
Light Blue is a Pivot Point – Black represents the price when the report was produced
Dow Jones Intraday: Trend on the upside
Our pivot point is 45,010.20
Preferable Price Action: Take buy positions above the pivot with targets at 45,073.80 & 45,129.20.
Alternative Price Action: Below 45,010.20 looks for further downside to 44,946.60 & 44,888.80.
Comment: RSI is above 50 levels and pairs above its 20MA & 55MA.
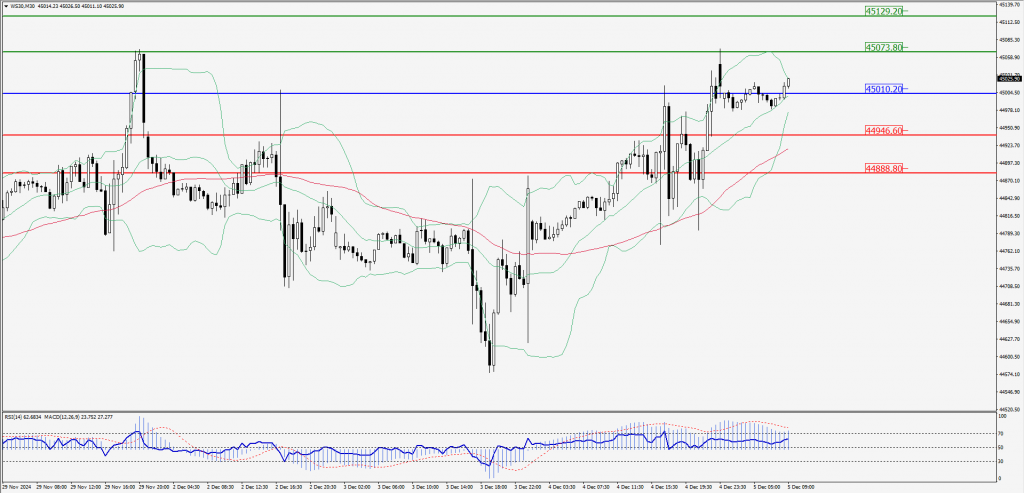
Green Lines Indicate Resistance Levels – Red Lines Indicate Support Levels
Light Blue is a Pivot Point – Black represents the price when the report was produced