DAILY MARKET ANALYSIS: EUR/USD – MARCH 4, 2025
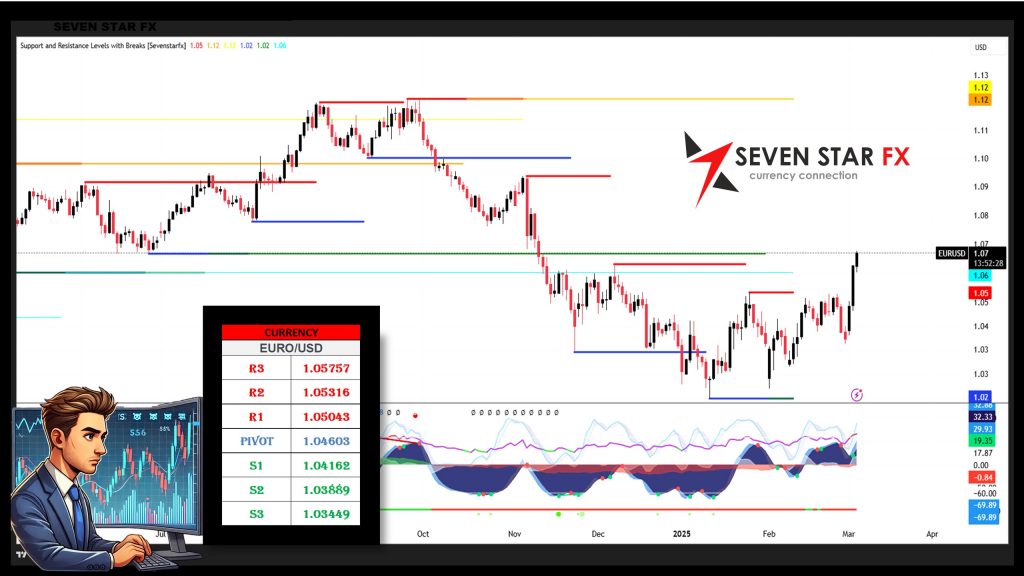
EUR/USD TECHNICAL & FUNDAMENTAL OUTLOOK
📊 KEY TECHNICAL LEVELS
Resistance Levels:
🔺 R3: 1.05757 🔺 R2: 1.05316 🔺 R1: 1.05043
Pivot Level:
📌 1.04603
Support Levels:
🔻 S1: 1.04162 🔻 S2: 1.03889 🔻 S3: 1.03449
These levels serve as significant market markers. Trading above the pivot level (1.04603) indicates bullish momentum, while a break below S1 (1.04162) could signal further downside movement.
🔍 FUNDAMENTAL ANALYSIS
⚖️ ECB MONETARY POLICY & ECONOMIC OUTLOOK
- The European Central Bank (ECB) maintains a cautious stance on monetary policy, holding off on rate cuts due to persistent inflationary pressures.
- Eurozone economic data suggests moderate growth, but inflation concerns continue to create mixed market sentiment.
💰 US FEDERAL RESERVE & USD DYNAMICS
- The Federal Reserve remains cautious on interest rate adjustments, supporting continued USD strength.
- Despite weaker U.S. economic data, the safe-haven demand for the dollar remains strong, applying additional pressure on the Euro.
🌐 GEOPOLITICAL & MARKET SENTIMENT
- Ongoing U.S.-EU trade negotiations and global economic uncertainties contribute to market volatility.
- Risk sentiment remains mixed, with traders exercising caution in their EUR/USD positions.
🛠️ TECHNICAL ANALYSIS TOOLS
🌟 Fibonacci Retracement
Implication:
✅ Trading above Pivot (1.04603) could lead to a retest of higher resistance levels (R1-R3). ✅ A break below S1 (1.04162) may intensify the downside move toward S2 and S3.
🔄 Bollinger Bands
Setup:
📌 The price is currently trading near the middle band, suggesting a neutral to slightly bullish trend. 📌 The upper band serves as resistance, while the lower band provides support.
Implication:
✅ A breakout above the upper band could confirm strong bullish momentum. ✅ A move below the lower band might indicate increasing selling pressure.
🔄 Elliott Wave Analysis
Insight:
📌 The pair appears to be in a corrective phase (Wave 4). 📌 Holding above the pivot could set the stage for a bullish Wave 5 targeting R1-R3. 📌 A break below S1 may indicate an extended bearish correction.
⚠️ FINAL THOUGHTS & DISCLAIMER
This report integrates technical and fundamental analysis to provide a comprehensive outlook on the EUR/USD market. Given the volatile nature of forex trading, market participants should exercise caution and implement robust risk management strategies.
📢 Disclaimer: Forex trading carries a high level of risk and may not be suitable for all investors. This analysis is for informational purposes only. Traders should conduct their own research and risk assessments before making any trading decisions.
🚀 STAY INFORMED AND TRADE WISELY!
DAILY MARKET ANALYSIS: GBP/USD – MARCH 4, 2025
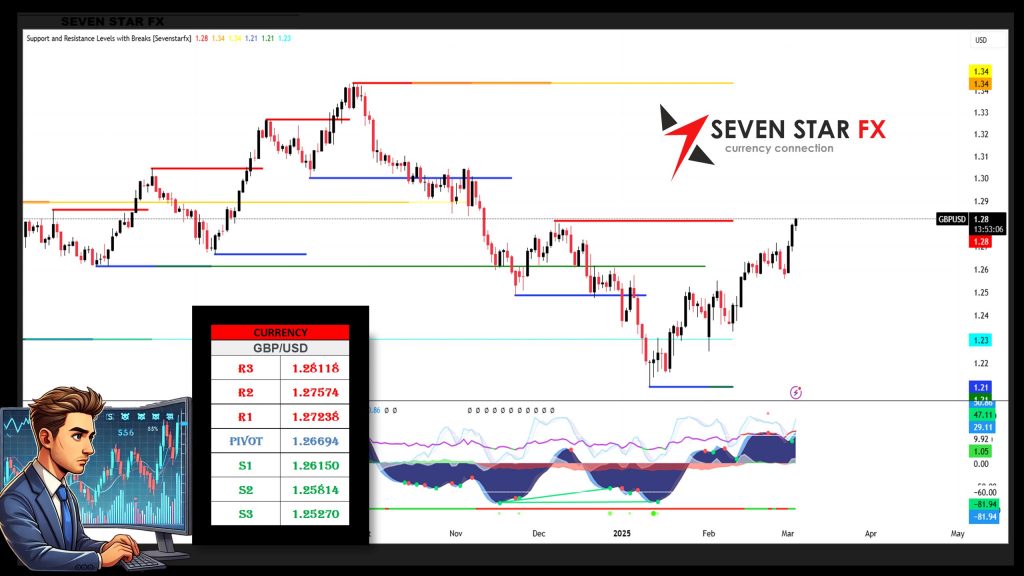
GBP/USD TECHNICAL & FUNDAMENTAL OUTLOOK
📊 KEY TECHNICAL LEVELS
Resistance Levels:
🔺 R3: 1.28118 🔺 R2: 1.27574 🔺 R1: 1.27238
Pivot Level:
📌 1.26694
Support Levels:
🔻 S1: 1.26150 🔻 S2: 1.25814 🔻 S3: 1.25270
These levels serve as significant market markers. Trading above the pivot level (1.26694) indicates bullish momentum, while a break below S1 (1.26150) could signal further downside movement.
🔍 FUNDAMENTAL ANALYSIS
⚖️ BOE MONETARY POLICY & ECONOMIC OUTLOOK
- The Bank of England (BOE) remains cautious on interest rate adjustments, balancing inflationary pressures against economic growth concerns.
- UK economic data suggests modest expansion, but concerns over inflation persistence and consumer spending slowdowns continue to weigh on sentiment.
💰 US FEDERAL RESERVE & USD DYNAMICS
- The Federal Reserve maintains a hawkish stance, supporting continued USD strength.
- US economic uncertainties and safe-haven demand for the dollar contribute to GBP weakness.
🌐 GEOPOLITICAL & MARKET SENTIMENT
- UK-EU trade negotiations and global economic conditions influence market sentiment.
- Traders remain cautious, monitoring shifts in monetary policy and macroeconomic trends.
🛠️ TECHNICAL ANALYSIS TOOLS
🌟 Fibonacci Retracement
Implication:
✅ Trading above Pivot (1.26694) could lead to a retest of higher resistance levels (R1-R3). ✅ A break below S1 (1.26150) may intensify the downside move toward S2 and S3.
🔄 Bollinger Bands
Setup:
📌 The price is currently trading near the middle band, suggesting a neutral to slightly bullish trend. 📌 The upper band serves as resistance, while the lower band provides support.
Implication:
✅ A breakout above the upper band could confirm strong bullish momentum. ✅ A move below the lower band might indicate increasing selling pressure.
🔄 Elliott Wave Analysis
Insight:
📌 The pair appears to be in a corrective phase (Wave 4). 📌 Holding above the pivot could set the stage for a bullish Wave 5 targeting R1-R3. 📌 A break below S1 may indicate an extended bearish correction.
⚠️ FINAL THOUGHTS & DISCLAIMER
This report integrates technical and fundamental analysis to provide a comprehensive outlook on the GBP/USD market. Given the volatile nature of forex trading, market participants should exercise caution and implement robust risk management strategies.
📢 Disclaimer: Forex trading carries a high level of risk and may not be suitable for all investors. This analysis is for informational purposes only. Traders should conduct their own research and risk assessments before making any trading decisions.
🚀 STAY INFORMED AND TRADE WISELY!
DAILY MARKET ANALYSIS: USD/JPY – MARCH 4, 2025
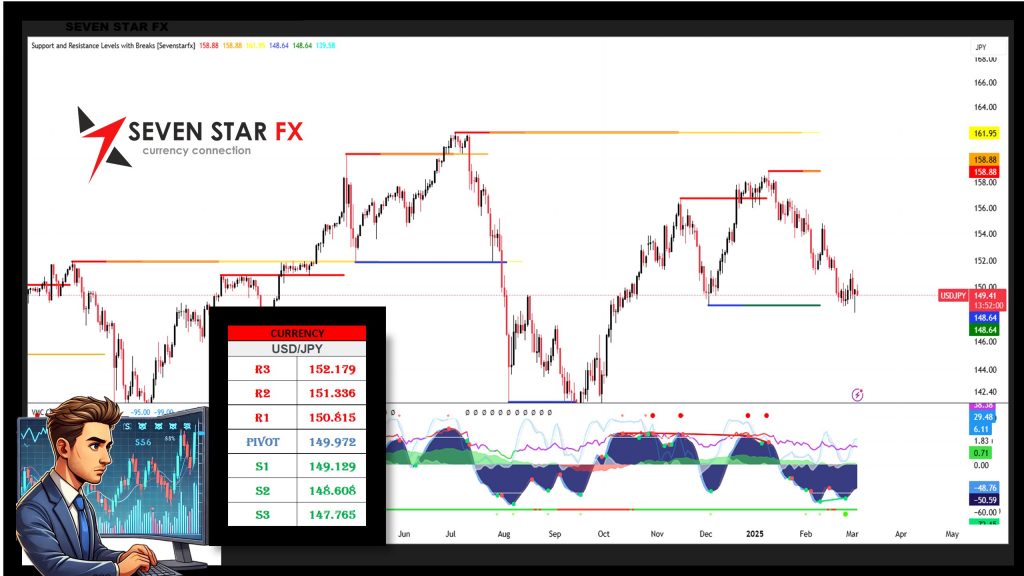
USD/JPY TECHNICAL & FUNDAMENTAL OUTLOOK
📊 KEY TECHNICAL LEVELS
Resistance Levels:
🔺 R3: 152.179 🔺 R2: 151.336 🔺 R1: 150.815
Pivot Level:
📌 149.972
Support Levels:
🔻 S1: 149.129 🔻 S2: 148.608 🔻 S3: 147.765
These levels serve as significant market markers. Trading above the pivot level (149.972) indicates bullish momentum, while a break below S1 (149.129) could signal further downside movement.
🔍 FUNDAMENTAL ANALYSIS
⚖️ BOJ MONETARY POLICY & ECONOMIC OUTLOOK
- The Bank of Japan (BOJ) maintains its ultra-loose monetary policy, continuing low interest rates to support economic growth.
- Japanese economic data suggests moderate recovery, but inflation concerns and wage growth trends remain key factors.
💰 US FEDERAL RESERVE & USD DYNAMICS
- The Federal Reserve maintains a hawkish stance, supporting continued USD strength.
- US economic uncertainties and safe-haven demand for the dollar contribute to JPY weakness.
🌐 GEOPOLITICAL & MARKET SENTIMENT
- US-Japan trade relations and global economic conditions influence market sentiment.
- Traders remain cautious, monitoring shifts in monetary policy and macroeconomic trends.
🛠️ TECHNICAL ANALYSIS TOOLS
🌟 Fibonacci Retracement
Implication:
✅ Trading above Pivot (149.972) could lead to a retest of higher resistance levels (R1-R3). ✅ A break below S1 (149.129) may intensify the downside move toward S2 and S3.
🔄 Bollinger Bands
Setup:
📌 The price is currently trading near the middle band, suggesting a neutral to slightly bullish trend. 📌 The upper band serves as resistance, while the lower band provides support.
Implication:
✅ A breakout above the upper band could confirm strong bullish momentum. ✅ A move below the lower band might indicate increasing selling pressure.
🔄 Elliott Wave Analysis
Insight:
📌 The pair appears to be in a corrective phase (Wave 4). 📌 Holding above the pivot could set the stage for a bullish Wave 5 targeting R1-R3. 📌 A break below S1 may indicate an extended bearish correction.
⚠️ FINAL THOUGHTS & DISCLAIMER
This report integrates technical and fundamental analysis to provide a comprehensive outlook on the USD/JPY market. Given the volatile nature of forex trading, market participants should exercise caution and implement robust risk management strategies.
📢 Disclaimer: Forex trading carries a high level of risk and may not be suitable for all investors. This analysis is for informational purposes only. Traders should conduct their own research and risk assessments before making any trading decisions.
🚀 STAY INFORMED AND TRADE WISELY!
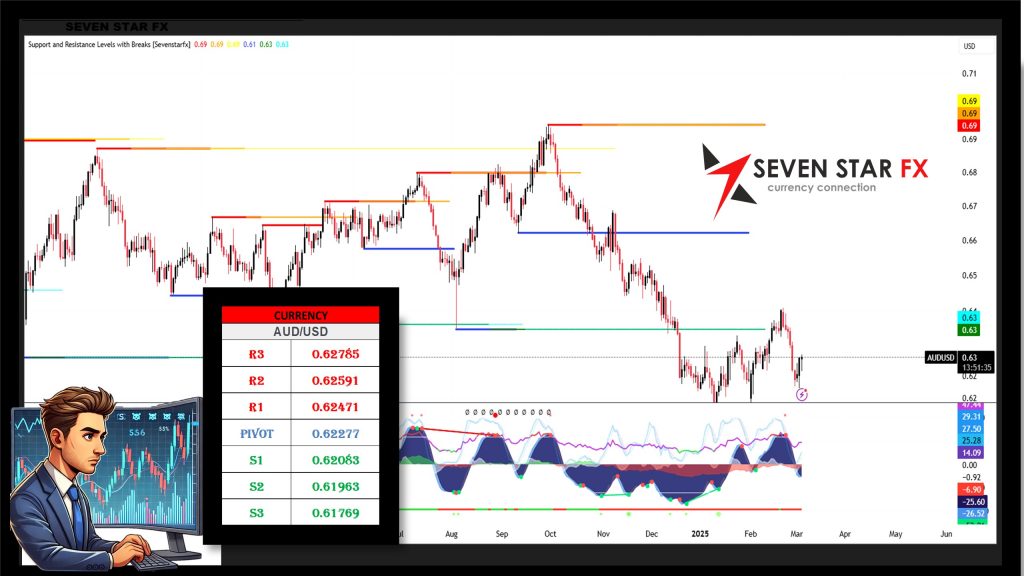
DAILY MARKET ANALYSIS: AUD/USD – MARCH 4, 2025

AUD/USD TECHNICAL & FUNDAMENTAL OUTLOOK
📊 KEY TECHNICAL LEVELS
Resistance Levels:
🔺 R3: 0.62785 🔺 R2: 0.62591 🔺 R1: 0.62471
Pivot Level:
📌 0.62277
Support Levels:
🔻 S1: 0.62083 🔻 S2: 0.61963 🔻 S3: 0.61769
These levels serve as significant market markers. Trading above the pivot level (0.62277) indicates bullish momentum, while a break below S1 (0.62083) could signal further downside movement.
🔍 FUNDAMENTAL ANALYSIS
⚖️ RBA MONETARY POLICY & ECONOMIC OUTLOOK
- The Reserve Bank of Australia (RBA) remains cautious on interest rate adjustments, weighing inflation risks against economic growth.
- Australian economic data suggests moderate expansion, but uncertainty around commodity demand and global trade affects sentiment.
💰 US FEDERAL RESERVE & USD DYNAMICS
- The Federal Reserve continues to maintain a hawkish stance, keeping the USD strong.
- US economic resilience and safe-haven demand contribute to AUD weakness.
🌐 GEOPOLITICAL & MARKET SENTIMENT
- China-Australia trade relations and global commodity demand impact AUD performance.
- Traders remain cautious, monitoring shifts in monetary policy and macroeconomic trends.
🛠️ TECHNICAL ANALYSIS TOOLS
🌟 Fibonacci Retracement
Implication:
✅ Trading above Pivot (0.62277) could lead to a retest of higher resistance levels (R1-R3). ✅ A break below S1 (0.62083) may intensify the downside move toward S2 and S3.
🔄 Bollinger Bands
Setup:
📌 The price is currently trading near the middle band, suggesting a neutral to slightly bullish trend. 📌 The upper band serves as resistance, while the lower band provides support.
Implication:
✅ A breakout above the upper band could confirm strong bullish momentum. ✅ A move below the lower band might indicate increasing selling pressure.
🔄 Elliott Wave Analysis
Insight:
📌 The pair appears to be in a corrective phase (Wave 4). 📌 Holding above the pivot could set the stage for a bullish Wave 5 targeting R1-R3. 📌 A break below S1 may indicate an extended bearish correction.
⚠️ FINAL THOUGHTS & DISCLAIMER
This report integrates technical and fundamental analysis to provide a comprehensive outlook on the AUD/USD market. Given the volatile nature of forex trading, market participants should exercise caution and implement robust risk management strategies.
📢 Disclaimer: Forex trading carries a high level of risk and may not be suitable for all investors. This analysis is for informational purposes only. Traders should conduct their own research and risk assessments before making any trading decisions.
🚀 STAY INFORMED AND TRADE WISELY!
DAILY MARKET ANALYSIS: Crude Oil– MARCH 4, 2025
CRUDE OIL TECHNICAL & FUNDAMENTAL OUTLOOK
📊 KEY TECHNICAL LEVELS
Resistance Levels:
🔺 R3: 71.06 🔺 R2: 70.05 🔺 R1: 69.43
Pivot Level:
📌 68.42
Support Levels:
🔻 S1: 67.41 🔻 S2: 66.79 🔻 S3: 65.78
These levels serve as significant market markers. Trading above the pivot level (68.42) indicates bullish momentum, while a break below S1 (67.41) could signal further downside movement.
🔍 FUNDAMENTAL ANALYSIS
⚖️ OPEC+ POLICY & GLOBAL SUPPLY OUTLOOK
- The Organization of the Petroleum Exporting Countries (OPEC+) continues to manage output levels, influencing global supply.
- Recent production cuts have helped stabilize prices, but demand concerns persist due to global economic uncertainty.
💰 US FEDERAL RESERVE & DOLLAR IMPACT
- The Federal Reserve’s monetary policy impacts crude oil prices by influencing the strength of the US dollar.
- A stronger USD generally pressures oil prices lower, while a weaker USD supports higher crude prices.
🌐 GEOPOLITICAL & MARKET SENTIMENT
- Middle East tensions, US-China trade relations, and global economic conditions remain key drivers of crude oil volatility.
- Supply chain disruptions and inventory levels continue to affect short-term price movements.
🛠️ TECHNICAL ANALYSIS TOOLS
🌟 Fibonacci Retracement
Implication:
✅ Trading above Pivot (68.42) could lead to a retest of higher resistance levels (R1-R3). ✅ A break below S1 (67.41) may intensify the downside move toward S2 and S3.
🔄 Bollinger Bands
Setup:
📌 The price is currently trading near the middle band, suggesting a neutral to slightly bullish trend. 📌 The upper band serves as resistance, while the lower band provides support.
Implication:
✅ A breakout above the upper band could confirm strong bullish momentum. ✅ A move below the lower band might indicate increasing selling pressure.
🔄 Elliott Wave Analysis
Insight:
📌 The market appears to be in a corrective phase (Wave 4). 📌 Holding above the pivot could set the stage for a bullish Wave 5 targeting R1-R3. 📌 A break below S1 may indicate an extended bearish correction.
⚠️ FINAL THOUGHTS & DISCLAIMER
This report integrates technical and fundamental analysis to provide a comprehensive outlook on the Crude Oil market. Given the volatile nature of commodity trading, market participants should exercise caution and implement robust risk management strategies.
📢 Disclaimer: Commodity trading carries a high level of risk and may not be suitable for all investors. This analysis is for informational purposes only. Traders should conduct their own research and risk assessments before making any trading decisions.
🚀 STAY INFORMED AND TRADE WISELY!
DAILY MARKET ANALYSIS: XAU/USD – MARCH 4, 2025
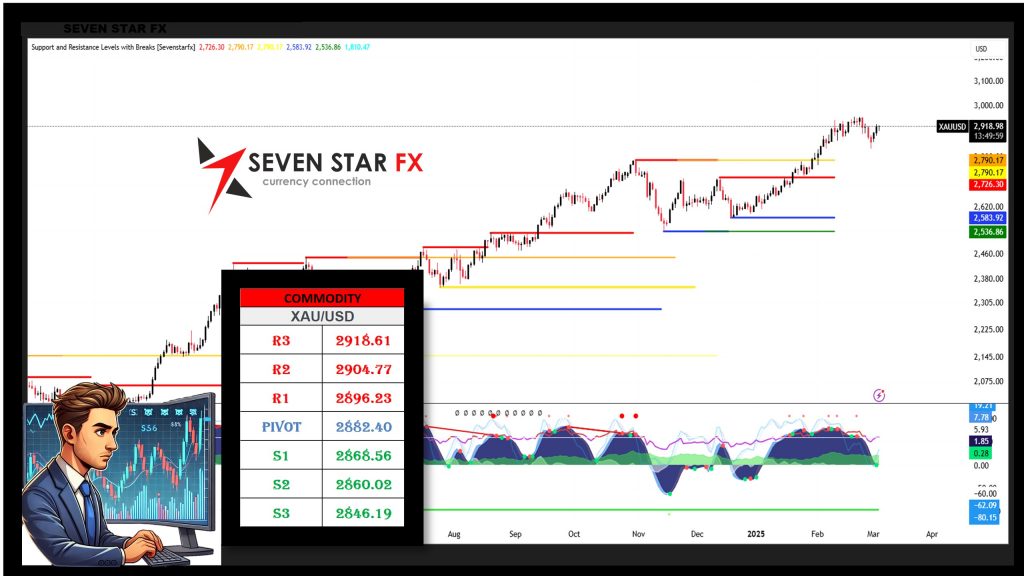
XAU/USD (GOLD) TECHNICAL & FUNDAMENTAL OUTLOOK
📊 KEY TECHNICAL LEVELS
Resistance Levels:
🔺 R3: 2918.61 🔺 R2: 2904.77 🔺 R1: 2896.23
Pivot Level:
📌 2882.40
Support Levels:
🔻 S1: 2868.56 🔻 S2: 2860.02 🔻 S3: 2846.19
These levels serve as significant market markers. Trading above the pivot level (2882.40) indicates bullish momentum, while a break below S1 (2868.56) could signal further downside movement.
🔍 FUNDAMENTAL ANALYSIS
⚖️ GLOBAL ECONOMIC FACTORS & GOLD DEMAND
- Gold remains a key safe-haven asset, attracting demand amid global economic uncertainties.
- Inflation concerns and interest rate policies from central banks, including the Federal Reserve, impact gold prices significantly.
💰 US FEDERAL RESERVE & DOLLAR IMPACT
- A hawkish stance from the Federal Reserve tends to weaken gold prices as higher interest rates reduce gold’s appeal.
- USD fluctuations and treasury yields continue to influence gold’s movement in the market.
🌐 GEOPOLITICAL & MARKET SENTIMENT
- Rising geopolitical tensions, particularly in Europe and the Middle East, have led to increased safe-haven demand.
- Stock market volatility also plays a role in influencing capital flow into gold.
🛠️ TECHNICAL ANALYSIS TOOLS
🌟 Fibonacci Retracement
Implication:
✅ Trading above Pivot (2882.40) could lead to a retest of higher resistance levels (R1-R3). ✅ A break below S1 (2868.56) may intensify the downside move toward S2 and S3.
🔄 Bollinger Bands
Setup:
📌 The price is currently trading near the middle band, suggesting a neutral to slightly bullish trend. 📌 The upper band serves as resistance, while the lower band provides support.
Implication:
✅ A breakout above the upper band could confirm strong bullish momentum. ✅ A move below the lower band might indicate increasing selling pressure.
🔄 Elliott Wave Analysis
Insight:
📌 The market appears to be in a corrective phase (Wave 4). 📌 Holding above the pivot could set the stage for a bullish Wave 5 targeting R1-R3. 📌 A break below S1 may indicate an extended bearish correction.
⚠️ FINAL THOUGHTS & DISCLAIMER
This report integrates technical and fundamental analysis to provide a comprehensive outlook on the Gold (XAU/USD) market. Given the volatile nature of commodity trading, market participants should exercise caution and implement robust risk management strategies.
📢 Disclaimer: Commodity trading carries a high level of risk and may not be suitable for all investors. This analysis is for informational purposes only. Traders should conduct their own research and risk assessments before making any trading decisions.
🚀 STAY INFORMED AND TRADE WISELY!
DAILY MARKET ANALYSIS: DOW JONES – MARCH 4, 2025
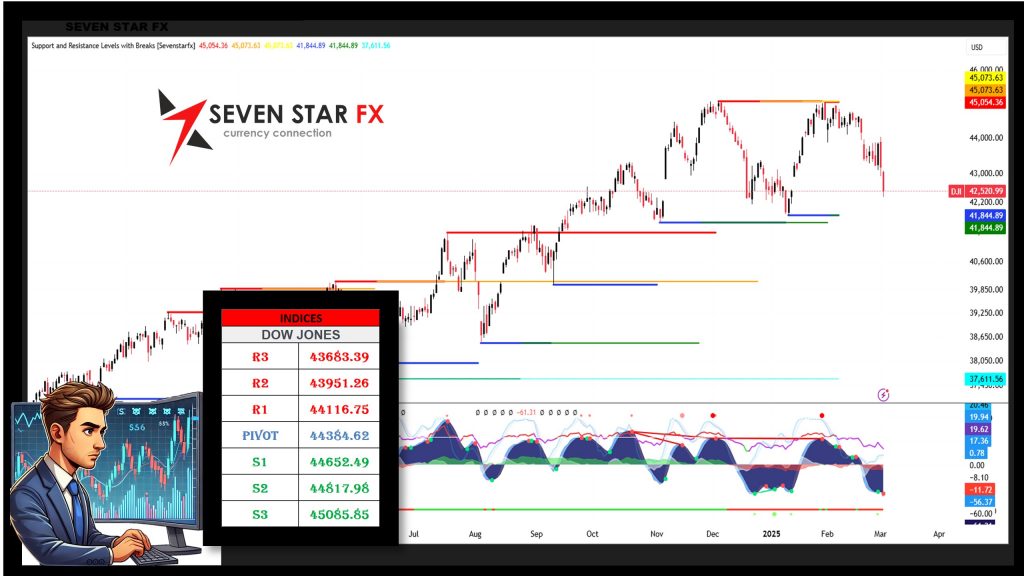
DOW JONES TECHNICAL & FUNDAMENTAL OUTLOOK
📊 KEY TECHNICAL LEVELS
Resistance Levels:
🔺 R3: 43683.39 🔺 R2: 43951.26 🔺 R1: 44116.75
Pivot Level:
📌 44384.62
Support Levels:
🔻 S1: 44652.49 🔻 S2: 44817.98 🔻 S3: 45085.85
These levels serve as significant market markers. Trading above the pivot level (44384.62) indicates bullish momentum, while a break below S1 (44652.49) could signal further downside movement.
🔍 FUNDAMENTAL ANALYSIS
⚖️ US ECONOMIC OUTLOOK & FEDERAL RESERVE POLICY
- The Dow Jones Industrial Average (DJIA) remains sensitive to interest rate decisions and economic growth prospects.
- The Federal Reserve’s monetary policy stance influences investor sentiment, with higher rates typically pressuring equity markets.
💰 CORPORATE EARNINGS & MARKET VOLATILITY
- Strong corporate earnings reports drive market optimism, while disappointing results may increase selling pressure.
- Sector-specific performance, particularly in technology, industrials, and financials, impacts Dow Jones movements.
🌐 GEOPOLITICAL & MARKET SENTIMENT
- US-China trade relations, global inflation concerns, and economic uncertainty play a crucial role in Dow Jones trends.
- Market participants monitor geopolitical developments, including potential supply chain disruptions and regulatory policies.
🛠️ TECHNICAL ANALYSIS TOOLS
🌟 Fibonacci Retracement
Implication:
✅ Trading above Pivot (44384.62) could lead to a retest of higher resistance levels (R1-R3). ✅ A break below S1 (44652.49) may intensify the downside move toward S2 and S3.
🔄 Bollinger Bands
Setup:
📌 The price is currently trading near the middle band, suggesting a neutral to slightly bullish trend. 📌 The upper band serves as resistance, while the lower band provides support.
Implication:
✅ A breakout above the upper band could confirm strong bullish momentum. ✅ A move below the lower band might indicate increasing selling pressure.
🔄 Elliott Wave Analysis
Insight:
📌 The index appears to be in a corrective phase (Wave 4). 📌 Holding above the pivot could set the stage for a bullish Wave 5 targeting R1-R3. 📌 A break below S1 may indicate an extended bearish correction.
⚠️ FINAL THOUGHTS & DISCLAIMER
This report integrates technical and fundamental analysis to provide a comprehensive outlook on the Dow Jones Industrial Average (DJIA). Given the volatile nature of stock markets, market participants should exercise caution and implement robust risk management strategies.
📢 Disclaimer: Stock market trading carries a high level of risk and may not be suitable for all investors. This analysis is for informational purposes only. Traders should conduct their own research and risk assessments before making any investment decisions.
🚀 STAY INFORMED AND TRADE WISELY!
DAILY MARKET ANALYSIS: BTC/USD – MARCH 4, 2025
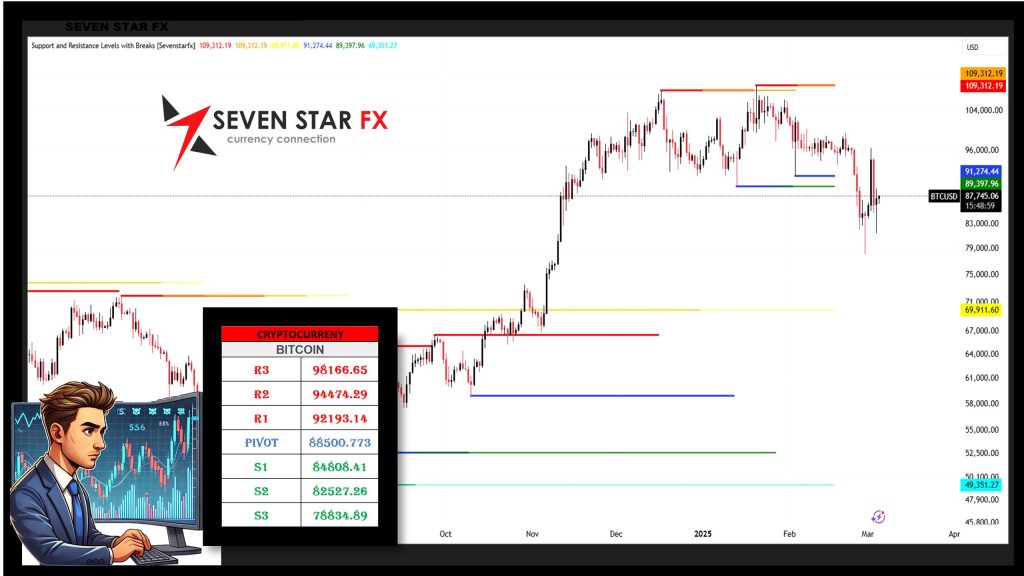
BITCOIN TECHNICAL & FUNDAMENTAL OUTLOOK
📊 KEY TECHNICAL LEVELS
Resistance Levels:
🔺 R3: 98166.65 🔺 R2: 94474.29 🔺 R1: 92193.14
Pivot Level:
📌 88500.77
Support Levels:
🔻 S1: 84808.41 🔻 S2: 82527.26 🔻 S3: 78834.89
These levels serve as significant market markers. Trading above the pivot level (88500.77) indicates bullish momentum, while a break below S1 (84808.41) could signal further downside movement.
🔍 FUNDAMENTAL ANALYSIS
⚖️ MACROECONOMIC FACTORS & BITCOIN ADOPTION
- Bitcoin remains a leading digital asset, gaining traction among institutional investors and mainstream financial markets.
- Macroeconomic policies, inflation trends, and global liquidity significantly influence Bitcoin’s price movement.
💰 FEDERAL RESERVE POLICY & CRYPTO REGULATION
- Monetary policy decisions, particularly interest rate adjustments, impact Bitcoin’s appeal as a hedge against inflation.
- Regulatory developments, including potential US and global crypto regulations, add to market volatility.
🌐 GEOPOLITICAL & MARKET SENTIMENT
- Institutional investments, ETF approvals, and crypto adoption trends play a key role in Bitcoin’s long-term growth.
- Global economic uncertainties, including stock market performance and fiat currency fluctuations, impact Bitcoin demand.
🛠️ TECHNICAL ANALYSIS TOOLS
🌟 Fibonacci Retracement
Implication:
✅ Trading above Pivot (88500.77) could lead to a retest of higher resistance levels (R1-R3). ✅ A break below S1 (84808.41) may intensify the downside move toward S2 and S3.
🔄 Bollinger Bands
Setup:
📌 The price is currently trading near the middle band, suggesting a neutral to slightly bullish trend. 📌 The upper band serves as resistance, while the lower band provides support.
Implication:
✅ A breakout above the upper band could confirm strong bullish momentum. ✅ A move below the lower band might indicate increasing selling pressure.
🔄 Elliott Wave Analysis
Insight:
📌 The asset appears to be in a corrective phase (Wave 4). 📌 Holding above the pivot could set the stage for a bullish Wave 5 targeting R1-R3. 📌 A break below S1 may indicate an extended bearish correction.
⚠️ FINAL THOUGHTS & DISCLAIMER
This report integrates technical and fundamental analysis to provide a comprehensive outlook on Bitcoin (BTC/USD). Given the volatile nature of cryptocurrency markets, market participants should exercise caution and implement robust risk management strategies.
📢 Disclaimer: Cryptocurrency trading carries a high level of risk and may not be suitable for all investors. This analysis is for informational purposes only. Traders should conduct their own research and risk assessments before making any investment decisions.
🚀 STAY INFORMED AND TRADE WISELY!
————————————————————————————————————————————————————————————————————————————-
Notice: The data presented is derived from technical analysis and does not constitute financial advice. For those trading in forex, consulting a qualified financial advisor prior to making investment decisions is strongly recommended.
Caution: The information above reflects ongoing technical analysis and should not be interpreted as financial advice. Forex trading involves high volatility, and without proper knowledge, you risk losing all your capital. It is essential to consult with a financial advisor before investing.
Advisory: The insights shared are the result of technical analysis and are not intended as financial advice. Forex traders should seek advice from professional financial advisors before making any investment decisions. Remember, the forex market is highly volatile, and trading without adequate knowledge can lead to significant losses.
Important: The analysis provided is for informational purposes only and should not be seen as financial advice. Forex trading carries substantial risks, and it is advisable to consult financial advisors before proceeding with any investments. This content is intended solely for Wealth Management Education purposes.