Market Wrap: Stocks, Bonds, Commodities
US stocks closed lower on Friday, with the Dow and S&P 500 suffering their biggest one-day percentage drops in months, and pandemic-hit sectors that had gained from a reopening falling sharply after a new coronavirus mutation was found.
The Dow Jones Industrial Average fell 905.04 points (2.53%) to 34,899.34; the S&P 500 lost 106.84 points (2.27%) to 4,594.62; and the Nasdaq Composite dropped 353.57 points (2.23%) to 15,491.66.
MSCI’s index of Asia-Pacific stocks outside Japan plunged 0.46% to 787.57 levels. Australian index slipped 0.54% to 7,239.80. Japanese Nikkei Index lost 1.63% to 28,283.92.
European stocks were Higher on Monday, with the Stoxx Europe 50 Index jumping 1.52% to 4,151.75, Germany’s DAX rose 1.10% to 15,425.40, and France’s CAC advance 1.40% to 6,833.98, and U.K.’s FTSE 100 rose 1.40% to 7,121.61.
Benchmark 10-year U.S. Treasury rose as demand for safe assets grows again, today 10-year bond yields rose 2.42% to 1.521.
Oil prices plunged more than 10% on Friday, the largest one-day drop since April 2020, as a new COVID-19 variant spooked investors and added to concerns that a supply surplus could swell in the first quarter.
Spot Brent crude oil jumped 4.06% to $74.50 per barrel. US West Texas Intermediate crude advance 5.03% to $71.58 a barrel.
The yellow metal gold gained 0.54% to 1797.80 dollars per ounce.
Market Wrap: Forex
The dollar was up on Monday, with investors slowly regaining their risk appetite after the discovery of the omicron COVID-19 variant. However, caution remained as research continues on this new strain.
Today, the U.S. dollar index measures the greenback against a trade-weighted basket of six major currencies, which rose 0.12% to 96.220.
The Euro US Dollar (EUR/USD) is a widely traded pair that is lost 0.34% today. This left the pairing trading around $1.12760.
The Japanese yen rose against the U.S. dollar on Monday as the stock pushes lower. Today US/JPY is lost 0.05% to 113.250 level.
Another commodity-related currency higher against the U.S dollar, AUD/USD gained 0.32% to 0.71460, and NZD/USD rose 0.07% to 0.68290 level.
EUR/USD Intraday: Trend on the upside
Our pivot point is at 1.12590
Preferable Price Action: Take Long positions Above pivot level with targets at 1.13090 & 1.13330 in extension.
Alternative Price Action: Below pivot looks for a further Downside to 1.12090 & 1.11860.
Comment: Pair above its 55MA & 20MA and RSI above 50 levels.
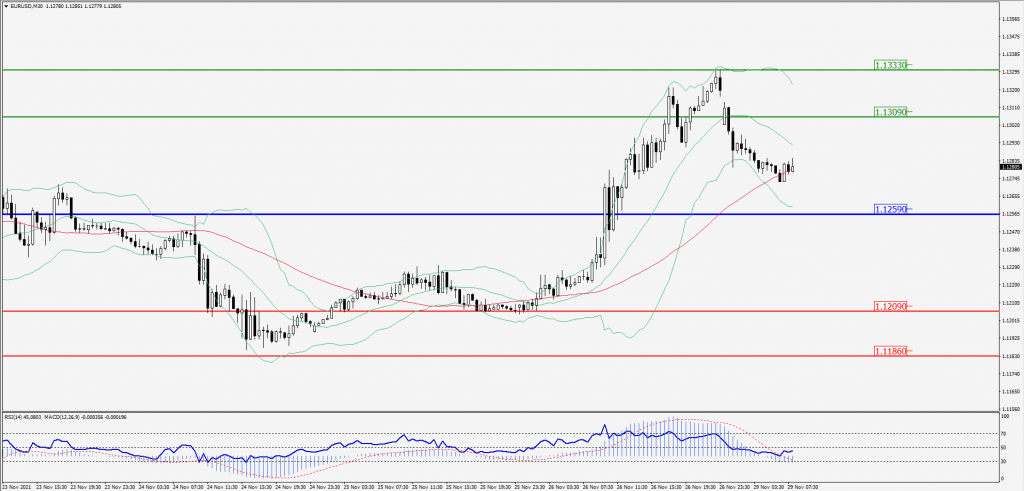
Green Lines Indicate Resistance Levels – Red Lines Indicates Support Levels
Light Blue is a Pivot Point – Black represents the price when the report was produced
GBP/USD Intraday: Support at 1.33230
Our pivot point is at 1.33230
Preferable Price Action: Buy positions above pivot with targets at 1.33660 & 1.33930 in extension.
Alternative Price Action: The price below pivot would call for further downside to 1.32790 & 1.32560.
Comment: Pair above its 55MA and RSI at 50 levels.
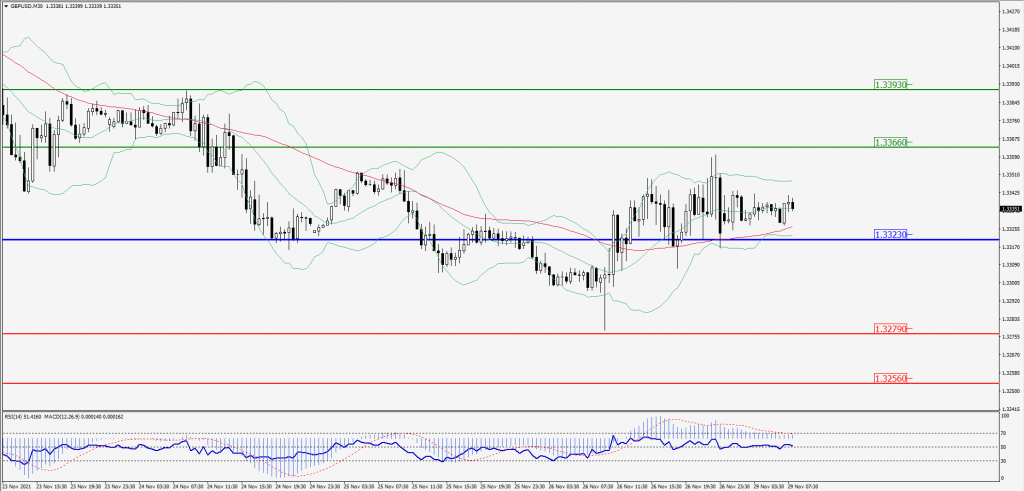
Green Lines Indicate Resistance Levels – Red Lines Indicates Support Levels
Light Blue is a Pivot Point – Black represents the price when the report was produced
USD/JPY Intraday: Trend on the downside
Our pivot point is at 113.830
Preferable Price Action: Sell position Below pivot with the target at 112.660 and 112.090 in extension.
Alternative Price Action: The Upside breakout of the pivot would call for 114.890 and 115.460.
Comment: Price below its 55MA & 20MA and MACD in negative territory.
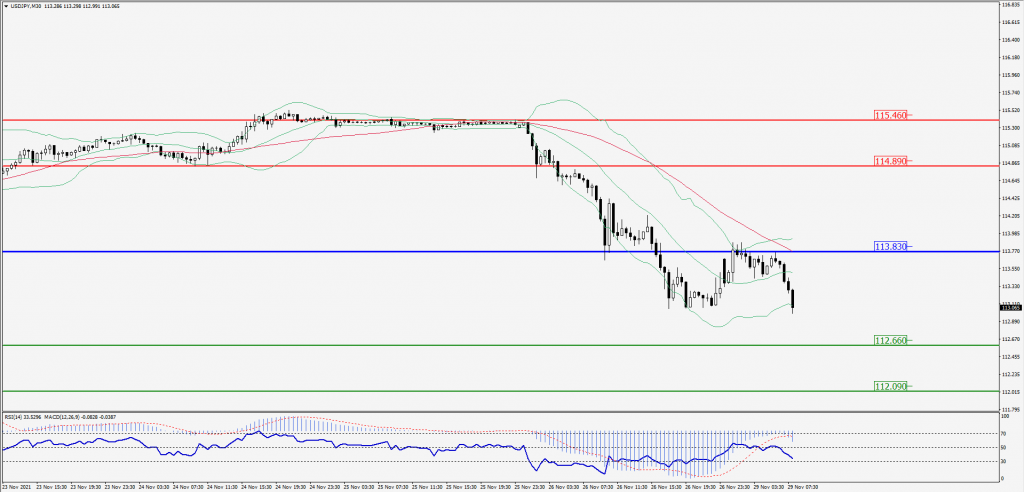
Green Lines Indicate Resistance Levels – Red Lines Indicates Support Levels
Light Blue is a Pivot Point – Black represents the price when the report was produced
AUD/USD Intraday: Trend on the downside
Our pivot point is at 0.71560
Preferable Price Action: Sell Positions below pivot with targets at 0.71060 & 0.70830 in extension.
Alternative Price Action: Above pivot looks for a further upside with 0.72090 & 0.72360 as targets.
Comment: Pair at its 55MA & 20MA and RSI at 50 levels.
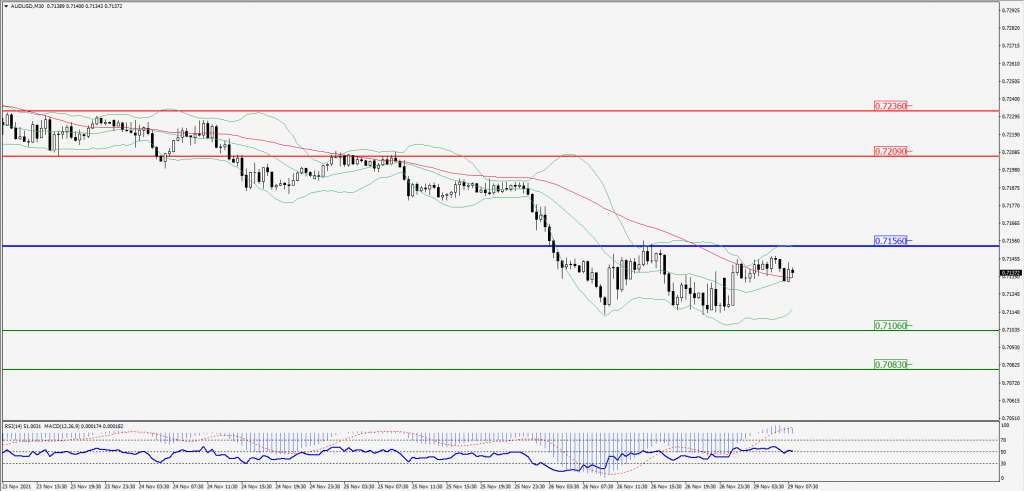
Green Lines Indicate Resistance Levels – Red Lines Indicates Support Levels
Light Blue is a Pivot Point – Black represents the price when the report was produced
CRUDEOIL Intraday: Trend on the downside
Our pivot point is at 73.30
Preferable Price Action: Below pivots Sell Oil with 69.30 & 67.60 as targets.
Alternative Price Action: Buy crude Above pivot with targets at 76.90 and 78.60 in extension.
Comment: Crude is below its 55MA and MACD in the negative territory.
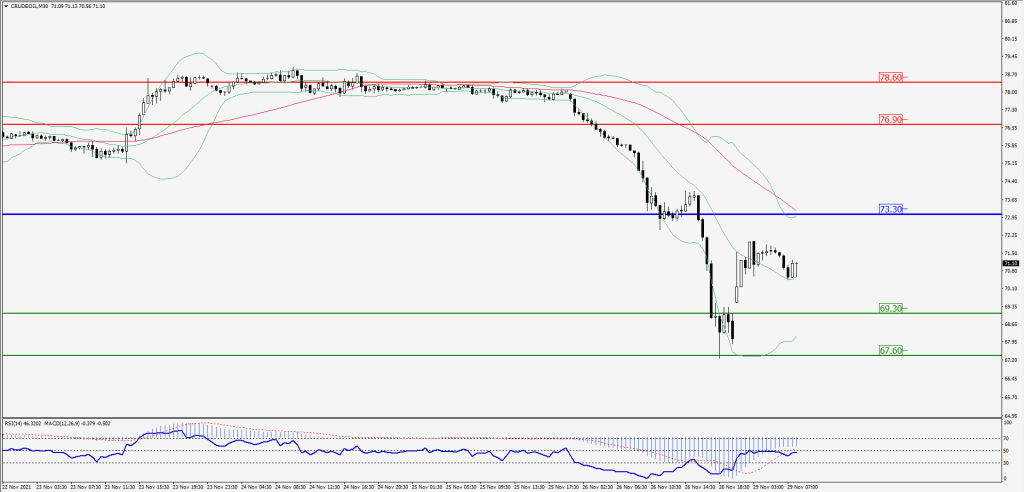
Green Lines Indicate Resistance Levels – Red Lines Indicates Support Levels
Light Blue is a Pivot Point – Black represents the price when the report was produced
XAU/USD Intraday: Support at 1787.30
Our pivot point is 1787.30
Preferable Price Action: Further upside to 1808.90 and 1820.60.
Alternative Price Action: If the price gives an downside breakout of a pivot, then the price extends to 1766.30 and 1756.60.
Comment: MACD in negative territory and price above its 20MA.
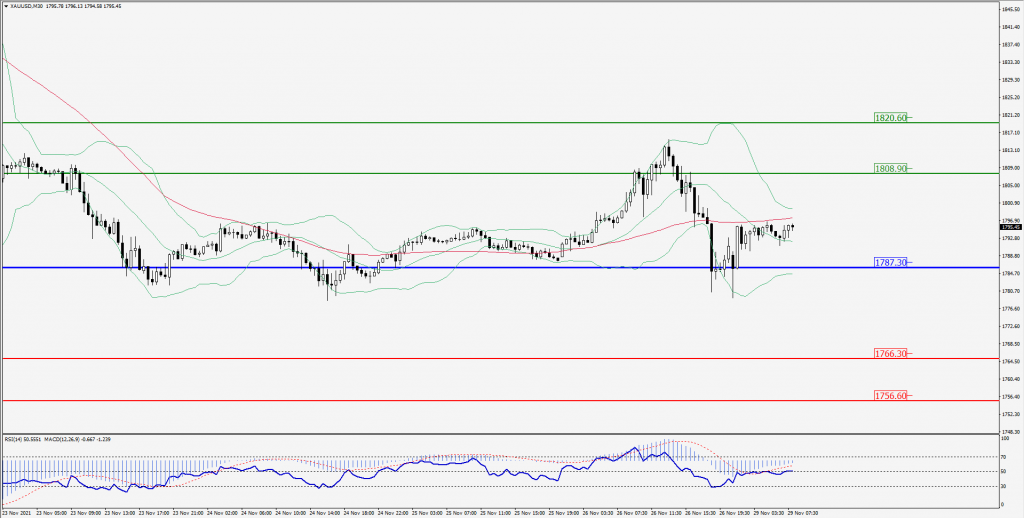
Green Lines Indicate Resistance Levels – Red Lines Indicates Support Levels
Light Blue is a Pivot Point – Black represents the price when the report was produced
Dow Jones Intraday: Trend on the downside
Our pivot point is 35,260.00
Preferable Price Action: Take Short positions below pivot with targets at 34,890.00 & 34,660.00.
Alternative Price Action: Above 35,490.00 looks for further Upside to 35,630.00 & 35,860.00.
Comment: Price below its 55MA and RSI at 50 levels.
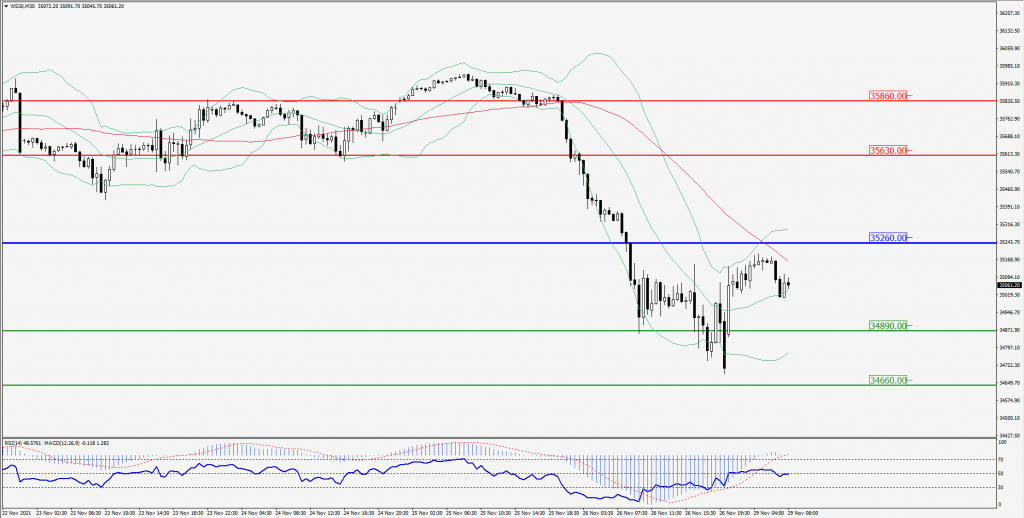
Green Lines Indicate Resistance Levels – Red Lines Indicates Support Levels
Light Blue is a Pivot Point – Black represents the price when the report was produced