DAILY MARKET ANALYSIS: EUR/USD – FEBRUARY 26, 2025
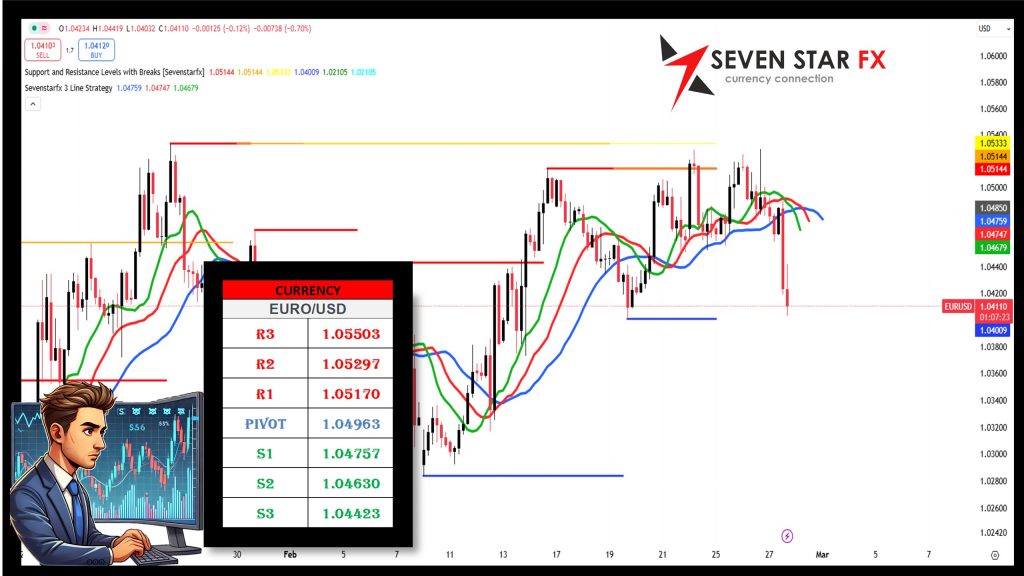
📊 Key Technical Levels
Resistance Levels:
🔺 R3: 1.05503
🔺 R2: 1.05297
🔺 R1: 1.05170
Pivot Level:
📌 1.04963
Support Levels:
🔻 S1: 1.04757
🔻 S2: 1.04630
🔻 S3: 1.04423
These levels serve as significant market markers. Trading above the pivot level (1.04963) indicates bullish momentum, while a break below S1 (1.04757) could signal further downside movement.
🔍 Fundamental Analysis
⚖️ ECB Monetary Policy & Economic Outlook:
- The European Central Bank (ECB) maintains a cautious stance on monetary policy, holding off on rate cuts due to persistent inflationary pressures.
- Eurozone economic data suggests moderate growth, but inflation concerns continue to create mixed market sentiment.
💰 US Federal Reserve & USD Dynamics:
- The Federal Reserve maintains a measured approach to interest rate adjustments, supporting continued USD strength.
- Despite weaker U.S. economic data, the safe-haven demand for the dollar remains strong, applying additional pressure on the Euro.
🌐 Geopolitical & Market Sentiment:
- Ongoing U.S.-EU trade negotiations and global economic uncertainties contribute to market volatility.
- Risk sentiment remains mixed, with traders exercising caution in their EUR/USD positions.
🛠️ Technical Analysis Tools
🌟 Fibonacci Retracement
Implication:
- Trading above Pivot (1.04963) could lead to a retest of higher resistance levels (R1-R3).
- A break below S1 (1.04757) may intensify the downside move toward S2 and S3.
🔄 Bollinger Bands
Setup:
- The price is currently trading near the middle band, suggesting a neutral to slightly bullish trend.
- The upper band serves as resistance, while the lower band provides support.
Implication:
- A breakout above the upper band could confirm strong bullish momentum.
- A move below the lower band might indicate increasing selling pressure.
🔄 Elliott Wave Analysis
Insight:
- The pair appears to be in a corrective phase (Wave 4).
- Holding above the pivot could set the stage for a bullish Wave 5 targeting R1-R3.
- A break below S1 may indicate an extended bearish correction.
⚠️ Final Thoughts & Disclaimer
This report integrates technical and fundamental analysis to provide a comprehensive outlook on the EUR/USD market. Given the volatile nature of forex trading, market participants should exercise caution and implement robust risk management strategies.
📢 Disclaimer: Forex trading carries a high level of risk and may not be suitable for all investors. This analysis is for informational purposes only. Traders should conduct their own research and risk assessments before making any trading decisions.
🚀 Stay informed and trade wisely!
DAILY MARKET ANALYSIS: GBP/USD – FEBRUARY 26, 2025
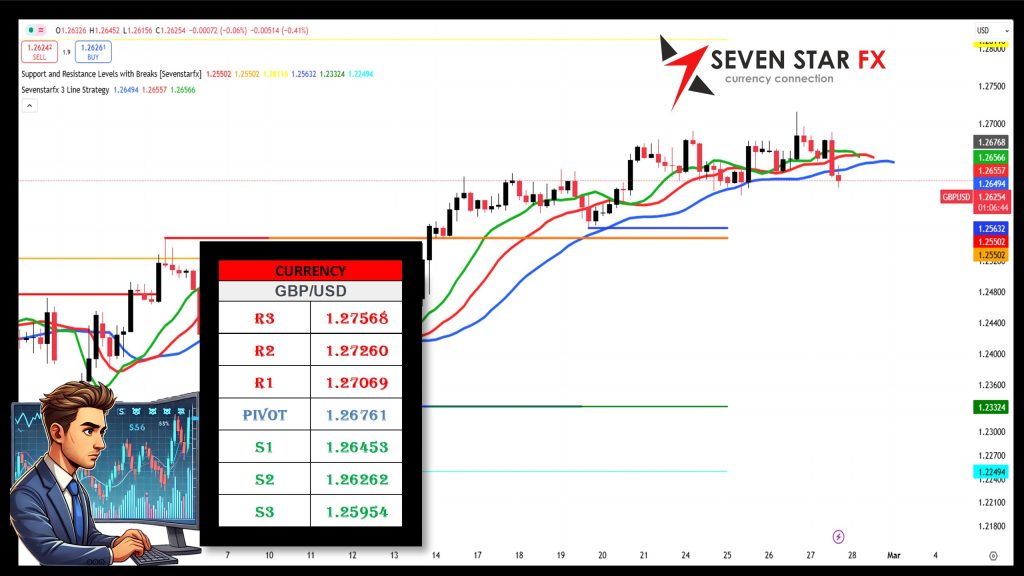
📊 Key Technical Levels – GBP/USD
Resistance Levels:
🔺 R3: 1.27568
🔺 R2: 1.27260
🔺 R1: 1.27069
Pivot Level:
📌 1.26761
Support Levels:
🔻 S1: 1.26453
🔻 S2: 1.26262
🔻 S3: 1.25954
These levels serve as significant market markers. Trading above the pivot level (1.26761) indicates bullish momentum, while a break below S1 (1.26453) could signal further downside movement.
🔍 Fundamental Analysis – GBP/USD
⚖️ Bank of England (BoE) Policy & UK Economic Outlook:
- The Bank of England maintains a cautious stance on monetary policy, closely monitoring inflation trends before making any rate adjustments.
- UK economic data remains mixed, with concerns over slow wage growth and moderate GDP expansion influencing investor sentiment.
💰 US Federal Reserve & USD Impact:
- The Federal Reserve’s measured approach to rate changes continues to support USD strength.
- Risk sentiment and safe-haven demand for the dollar have put pressure on GBP, limiting bullish rallies.
🌐 Geopolitical & Market Sentiment:
- Brexit-related policy discussions and trade deals continue to create uncertainty in GBP performance.
- Global risk sentiment remains mixed, with traders exercising caution in their GBP/USD positions.
🛠️ Technical Analysis Tools – GBP/USD
🌟 Fibonacci Retracement
Implication:
- Trading above Pivot (1.26761) could lead to a retest of higher resistance levels (R1-R3).
- A break below S1 (1.26453) may intensify the downside move toward S2 and S3.
🔄 Bollinger Bands
Setup:
- The price is currently trading near the middle band, suggesting a neutral to slightly bullish trend.
- The upper band serves as resistance, while the lower band provides support.
Implication:
- A breakout above the upper band could confirm strong bullish momentum.
- A move below the lower band might indicate increasing selling pressure.
🔄 Elliott Wave Analysis
Insight:
- GBP/USD appears to be in a corrective phase (Wave 4).
- Holding above the pivot could set the stage for a bullish Wave 5 targeting R1-R3.
- A break below S1 may indicate an extended bearish correction.
⚠️ Final Thoughts & Disclaimer
This report integrates technical and fundamental analysis to provide a comprehensive outlook on the GBP/USD market. Given the volatile nature of forex trading, market participants should exercise caution and implement robust risk management strategies.
📢 Disclaimer: Forex trading carries a high level of risk and may not be suitable for all investors. This analysis is for informational purposes only. Traders should conduct their own research and risk assessments before making any trading decisions.
🚀 Stay informed and trade wisely!
DAILY MARKET ANALYSIS: USD/JPY – FEBRUARY 26, 2025
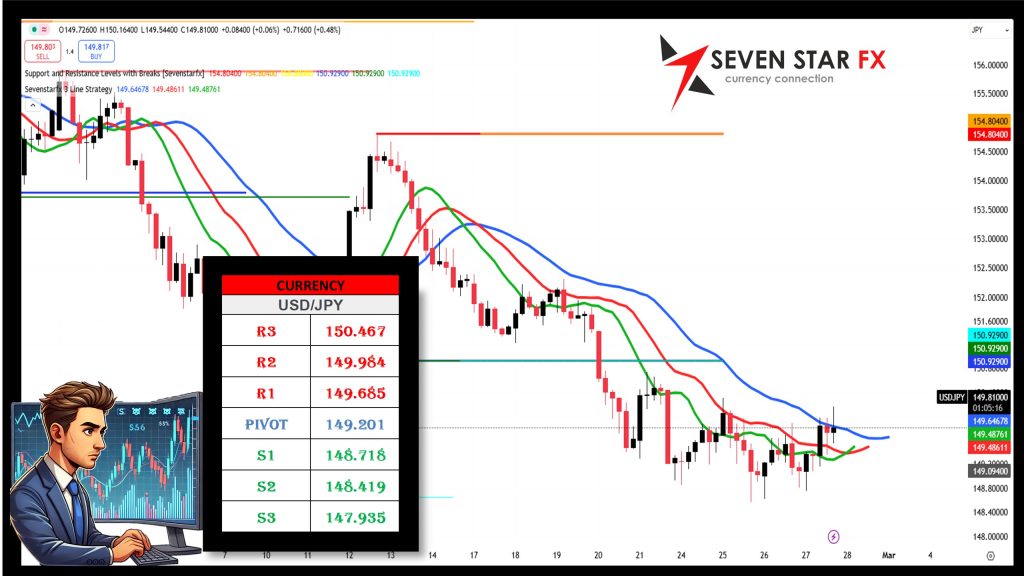
📊 Key Technical Levels – USD/JPY
Resistance Levels:
🔺 R3: 150.467
🔺 R2: 149.984
🔺 R1: 149.685
Pivot Level:
📌 149.201
Support Levels:
🔻 S1: 148.718
🔻 S2: 148.419
🔻 S3: 147.935
These levels serve as significant market markers. Trading above the pivot level (149.201) indicates bullish momentum, while a break below S1 (148.718) could signal further downside movement.
🔍 Fundamental Analysis – USD/JPY
⚖️ Bank of Japan (BoJ) Policy & Japanese Economic Outlook:
- The Bank of Japan (BoJ) continues its ultra-loose monetary policy stance, keeping interest rates at historically low levels.
- Japan’s inflation has shown signs of stabilizing, but wage growth remains a key concern for sustainable economic expansion.
💰 US Federal Reserve & USD Strength:
- The Federal Reserve’s cautious approach to interest rate policy has maintained support for the USD.
- Despite some weaker U.S. economic data, demand for the safe-haven dollar remains strong, pressuring JPY.
🌐 Geopolitical & Market Sentiment:
- Global risk sentiment fluctuates due to U.S.-China trade tensions and Japanese export trends.
- Japan’s economy faces headwinds from weaker global demand, impacting JPY’s performance.
🛠️ Technical Analysis Tools – USD/JPY
🌟 Fibonacci Retracement
Implication:
- Trading above Pivot (149.201) could lead to a retest of higher resistance levels (R1-R3).
- A break below S1 (148.718) may intensify the downside move toward S2 and S3.
🔄 Bollinger Bands
Setup:
- The price is currently trading near the middle band, suggesting a neutral to slightly bullish trend.
- The upper band serves as resistance, while the lower band provides support.
Implication:
- A breakout above the upper band could confirm strong bullish momentum.
- A move below the lower band might indicate increasing selling pressure.
🔄 Elliott Wave Analysis
Insight:
- USD/JPY appears to be in a corrective phase (Wave 4).
- Holding above the pivot could set the stage for a bullish Wave 5 targeting R1-R3.
- A break below S1 may indicate an extended bearish correction.
⚠️ Final Thoughts & Disclaimer
This report integrates technical and fundamental analysis to provide a comprehensive outlook on the USD/JPY market. Given the volatile nature of forex trading, market participants should exercise caution and implement robust risk management strategies.
📢 Disclaimer: Forex trading carries a high level of risk and may not be suitable for all investors. This analysis is for informational purposes only. Traders should conduct their own research and risk assessments before making any trading decisions.
🚀 Stay informed and trade wisely!
DAILY MARKET ANALYSIS: AUD/USD – FEBRUARY 26, 2025
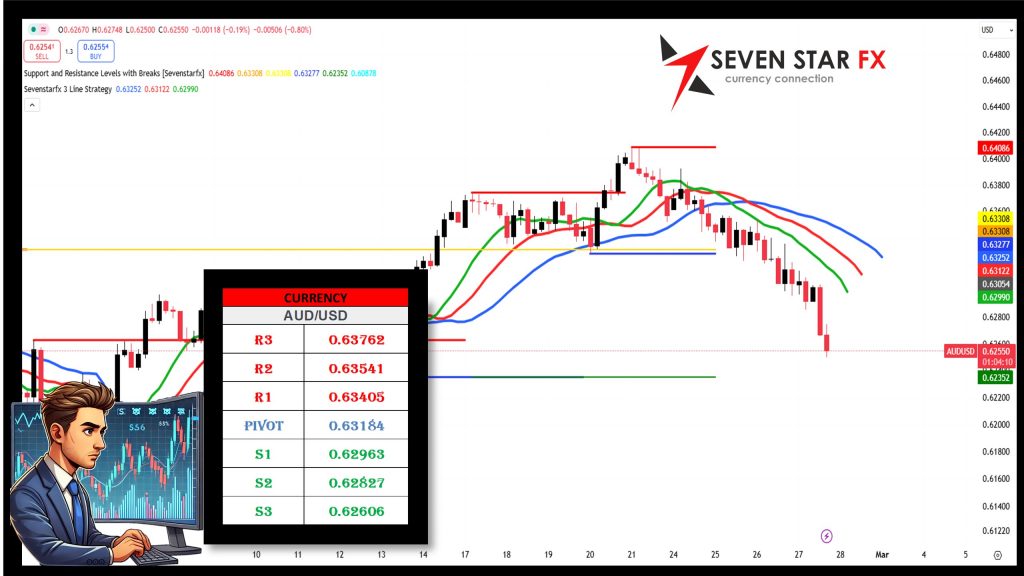
📊 Key Technical Levels – AUD/USD
Resistance Levels:
🔺 R3: 0.63762
🔺 R2: 0.63541
🔺 R1: 0.63405
Pivot Level:
📌 0.63184
Support Levels:
🔻 S1: 0.62963
🔻 S2: 0.62827
🔻 S3: 0.62606
These levels serve as significant market markers. Trading above the pivot level (0.63184) indicates bullish momentum, while a break below S1 (0.62963) could signal further downside movement.
🔍 Fundamental Analysis – AUD/USD
⚖️ Reserve Bank of Australia (RBA) Policy & Australian Economic Outlook:
- The Reserve Bank of Australia (RBA) remains cautious in its monetary policy approach, assessing inflation trends before considering rate adjustments.
- Australia’s economic growth remains steady, with commodity prices and employment data playing a key role in AUD performance.
💰 US Federal Reserve & USD Influence:
- The Federal Reserve’s steady rate policy continues to support USD strength, creating downside pressure on AUD/USD.
- The safe-haven appeal of the USD remains intact despite periods of weaker U.S. economic data.
🌐 Geopolitical & Market Sentiment:
- China’s economic performance significantly impacts AUD, given Australia’s trade dependence on China.
- Global risk sentiment remains mixed, with investors closely watching trade relations and commodity markets.
🛠️ Technical Analysis Tools – AUD/USD
🌟 Fibonacci Retracement
Implication:
- Trading above Pivot (0.63184) could lead to a retest of higher resistance levels (R1-R3).
- A break below S1 (0.62963) may intensify the downside move toward S2 and S3.
🔄 Bollinger Bands
Setup:
- The price is currently trading near the middle band, suggesting a neutral to slightly bullish trend.
- The upper band serves as resistance, while the lower band provides support.
Implication:
- A breakout above the upper band could confirm strong bullish momentum.
- A move below the lower band might indicate increasing selling pressure.
🔄 Elliott Wave Analysis
Insight:
- AUD/USD appears to be in a corrective phase (Wave 4).
- Holding above the pivot could set the stage for a bullish Wave 5 targeting R1-R3.
- A break below S1 may indicate an extended bearish correction.
⚠️ Final Thoughts & Disclaimer
This report integrates technical and fundamental analysis to provide a comprehensive outlook on the AUD/USD market. Given the volatile nature of forex trading, market participants should exercise caution and implement robust risk management strategies.
📢 Disclaimer: Forex trading carries a high level of risk and may not be suitable for all investors. This analysis is for informational purposes only. Traders should conduct their own research and risk assessments before making any trading decisions.
🚀 Stay informed and trade wisely!
DAILY MARKET ANALYSIS: CRUDE OIL – FEBRUARY 26, 2025
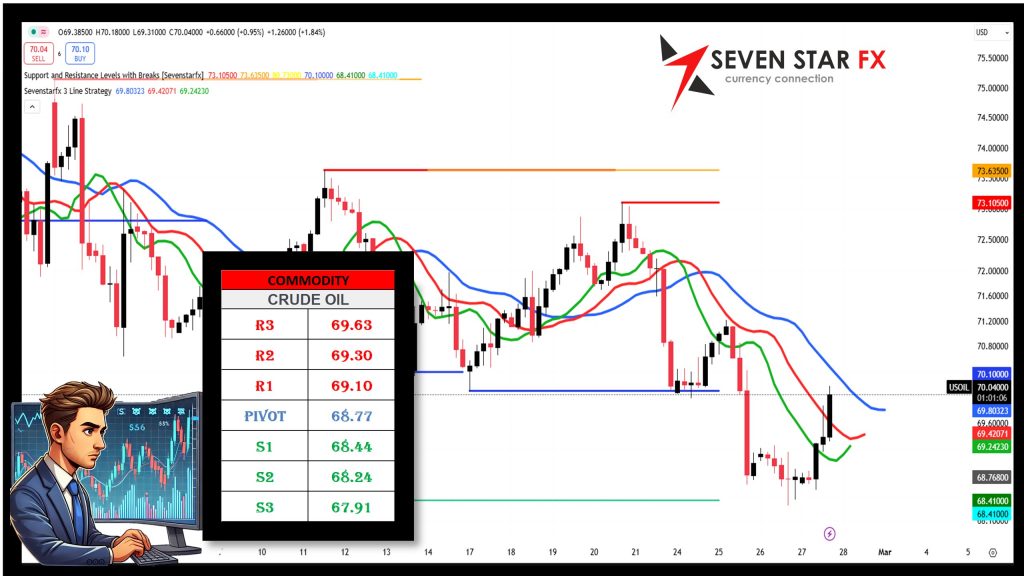
📊 Key Technical Levels – Crude Oil
Resistance Levels:
🔺 R3: 69.63
🔺 R2: 69.30
🔺 R1: 69.10
Pivot Level:
📌 68.77
Support Levels:
🔻 S1: 68.44
🔻 S2: 68.24
🔻 S3: 67.91
These levels serve as significant market markers. Trading above the pivot level (68.77) indicates bullish momentum, while a break below S1 (68.44) could signal further downside movement.
🔍 Fundamental Analysis – Crude Oil
⚖️ OPEC+ Supply Decisions & Global Oil Demand:
- OPEC+ supply adjustments remain a key driver of oil price movements. Any changes in production cuts could impact crude oil prices.
- Global demand expectations continue to fluctuate amid economic uncertainties and geopolitical tensions.
💰 US Dollar & Federal Reserve Policy:
- The strength of the US Dollar (USD) directly influences crude oil prices, as a stronger USD makes oil more expensive for non-dollar buyers.
- The Federal Reserve’s monetary policy decisions continue to shape global inflation expectations, indirectly affecting oil demand.
🌐 Geopolitical & Market Sentiment:
- Middle East tensions and U.S.-China trade relations remain key factors in oil price volatility.
- Market sentiment is mixed, with investors balancing economic concerns against potential supply disruptions.
🛠️ Technical Analysis Tools – Crude Oil
🌟 Fibonacci Retracement
Implication:
- Trading above Pivot (68.77) could lead to a retest of higher resistance levels (R1-R3).
- A break below S1 (68.44) may intensify the downside move toward S2 and S3.
🔄 Bollinger Bands
Setup:
- The price is currently trading near the middle band, suggesting a neutral to slightly bullish trend.
- The upper band serves as resistance, while the lower band provides support.
Implication:
- A breakout above the upper band could confirm strong bullish momentum.
- A move below the lower band might indicate increasing selling pressure.
🔄 Elliott Wave Analysis
Insight:
- Crude oil appears to be in a corrective phase (Wave 4).
- Holding above the pivot could set the stage for a bullish Wave 5 targeting R1-R3.
- A break below S1 may indicate an extended bearish correction.
⚠️ Final Thoughts & Disclaimer
This report integrates technical and fundamental analysis to provide a comprehensive outlook on the Crude Oil market. Given the volatile nature of commodities trading, market participants should exercise caution and implement robust risk management strategies.
📢 Disclaimer: Commodity trading carries a high level of risk and may not be suitable for all investors. This analysis is for informational purposes only. Traders should conduct their own research and risk assessments before making any trading decisions.
🚀 Stay informed and trade wisely!
DAILY MARKET ANALYSIS: XAU/USD – FEBRUARY 26, 2025
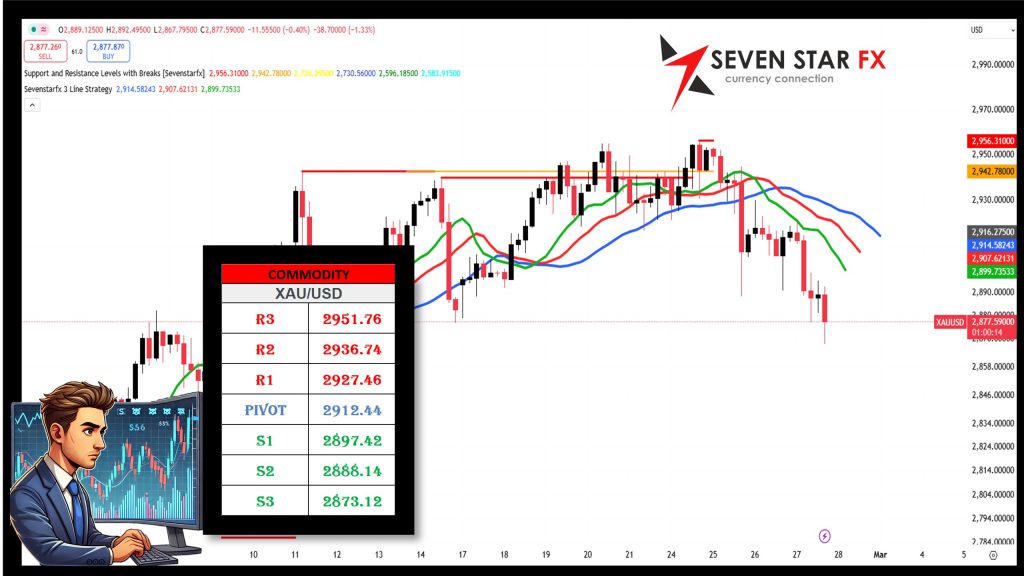
📊 Key Technical Levels – XAU/USD (Gold/USD)
Resistance Levels:
🔺 R3: 2951.76
🔺 R2: 2936.74
🔺 R1: 2927.46
Pivot Level:
📌 2912.44
Support Levels:
🔻 S1: 2897.42
🔻 S2: 2888.14
🔻 S3: 2873.12
These levels serve as significant market markers. Trading above the pivot level (2912.44) indicates bullish momentum, while a break below S1 (2897.42) could signal further downside movement.
🔍 Fundamental Analysis – XAU/USD
⚖️ Federal Reserve Policy & USD Strength:
- The Federal Reserve’s stance on interest rates significantly impacts gold prices. A dovish Fed tends to weaken the USD, supporting gold prices, while a hawkish Fed can pressure gold lower.
- The US Dollar Index (DXY) remains a key factor in gold movements, with a stronger dollar weighing on XAU/USD.
💰 Inflation & Safe-Haven Demand:
- Persistent inflationary concerns continue to support gold as a hedge against inflation.
- Geopolitical uncertainties and economic instability boost gold’s appeal as a safe-haven asset.
🌐 Geopolitical & Market Sentiment:
- US-China relations, Middle East tensions, and central bank gold purchases all influence gold prices.
- Investor sentiment remains mixed, with traders weighing risk-on vs. risk-off strategies.
🛠️ Technical Analysis Tools – XAU/USD
🌟 Fibonacci Retracement
Implication:
- Trading above Pivot (2912.44) could lead to a retest of higher resistance levels (R1-R3).
- A break below S1 (2897.42) may intensify the downside move toward S2 and S3.
🔄 Bollinger Bands
Setup:
- The price is currently trading near the middle band, suggesting a neutral to slightly bullish trend.
- The upper band serves as resistance, while the lower band provides support.
Implication:
- A breakout above the upper band could confirm strong bullish momentum.
- A move below the lower band might indicate increasing selling pressure.
🔄 Elliott Wave Analysis
Insight:
- XAU/USD appears to be in a corrective phase (Wave 4).
- Holding above the pivot could set the stage for a bullish Wave 5 targeting R1-R3.
- A break below S1 may indicate an extended bearish correction.
⚠️ Final Thoughts & Disclaimer
This report integrates technical and fundamental analysis to provide a comprehensive outlook on the XAU/USD (Gold/USD) market. Given the volatile nature of gold trading, market participants should exercise caution and implement robust risk management strategies.
📢 Disclaimer: Commodity trading carries a high level of risk and may not be suitable for all investors. This analysis is for informational purposes only. Traders should conduct their own research and risk assessments before making any trading decisions.
🚀 Stay informed and trade wisely!
DAILY MARKET ANALYSIS: DOW JONES – FEBRUARY 26, 2025
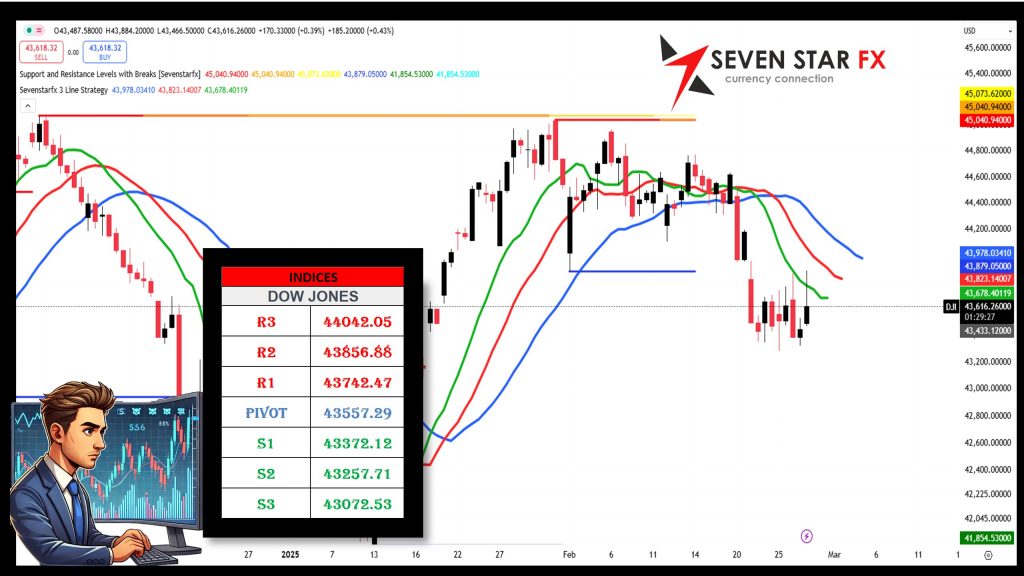
📊 Key Technical Levels – Dow Jones (DJIA)
Resistance Levels:
🔺 R3: 44042.05
🔺 R2: 43856.88
🔺 R1: 43742.47
Pivot Level:
📌 43557.29
Support Levels:
🔻 S1: 43372.12
🔻 S2: 43257.71
🔻 S3: 43072.53
These levels serve as significant market markers. Trading above the pivot level (43557.29) indicates bullish momentum, while a break below S1 (43372.12) could signal further downside movement.
🔍 Fundamental Analysis – Dow Jones (DJIA)
⚖️ Federal Reserve Policy & US Economic Outlook:
- The Federal Reserve’s stance on interest rates continues to impact equity markets. A dovish Fed supports stock markets, while a hawkish Fed could apply pressure.
- US economic data, including GDP growth, employment figures, and corporate earnings, influence market sentiment toward the Dow Jones.
💰 Market Sentiment & Risk Appetite:
- The performance of tech stocks, financials, and industrial sectors heavily influences the Dow’s movement.
- Investor sentiment remains mixed due to inflation concerns, monetary policy shifts, and global trade uncertainties.
🌐 Geopolitical & Global Market Influence:
- US-China relations, geopolitical risks, and trade policies remain key drivers of Dow Jones volatility.
- Market participants are closely watching corporate earnings reports and macroeconomic indicators for further direction.
🛠️ Technical Analysis Tools – Dow Jones (DJIA)
🌟 Fibonacci Retracement
Implication:
- Trading above Pivot (43557.29) could lead to a retest of higher resistance levels (R1-R3).
- A break below S1 (43372.12) may intensify the downside move toward S2 and S3.
🔄 Bollinger Bands
Setup:
- The price is currently trading near the middle band, suggesting a neutral to slightly bullish trend.
- The upper band serves as resistance, while the lower band provides support.
Implication:
- A breakout above the upper band could confirm strong bullish momentum.
- A move below the lower band might indicate increasing selling pressure.
🔄 Elliott Wave Analysis
Insight:
- Dow Jones appears to be in a corrective phase (Wave 4).
- Holding above the pivot could set the stage for a bullish Wave 5 targeting R1-R3.
- A break below S1 may indicate an extended bearish correction.
⚠️ Final Thoughts & Disclaimer
This report integrates technical and fundamental analysis to provide a comprehensive outlook on the Dow Jones (DJIA) market. Given the volatile nature of stock indices, market participants should exercise caution and implement robust risk management strategies.
📢 Disclaimer: Stock market trading carries a high level of risk and may not be suitable for all investors. This analysis is for informational purposes only. Traders should conduct their own research and risk assessments before making any trading decisions.
🚀 Stay informed and trade wisely!
DAILY MARKET ANALYSIS: BITCOIN – FEBRUARY 26, 2025
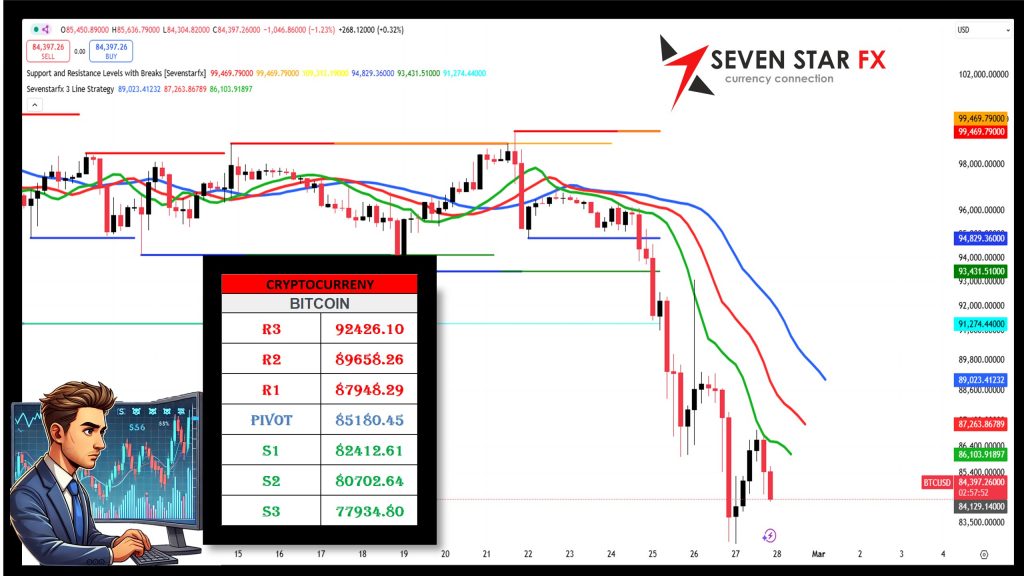
📊 Key Technical Levels – Bitcoin (BTC/USD)
Resistance Levels:
🔺 R3: 92,426.10
🔺 R2: 89,658.26
🔺 R1: 87,948.28
Pivot Level:
📌 85,180.45
Support Levels:
🔻 S1: 82,412.61
🔻 S2: 80,702.63
🔻 S3: 77,934.80
These levels serve as significant market markers. Trading above the pivot level (85,180.45) indicates bullish momentum, while a break below S1 (82,412.61) could signal further downside movement.
🔍 Fundamental Analysis – Bitcoin (BTC/USD)
⚖️ Market Sentiment & Institutional Adoption:
- Bitcoin ETF approvals, institutional investments, and regulatory developments continue to influence price action.
- Institutional adoption is increasing, but regulatory uncertainty still poses risks to volatility.
💰 Macroeconomic Factors & USD Correlation:
- Federal Reserve policy and USD strength impact Bitcoin’s performance. A dovish Fed can support BTC prices, while a strong USD may pressure Bitcoin lower.
- Inflation concerns and risk-on sentiment often drive capital inflows into crypto markets.
🌐 Geopolitical & Market Sentiment:
- Crypto regulations, ETF demand, and macroeconomic uncertainties impact BTC/USD trends.
- Bitcoin halving expectations and network upgrades may contribute to bullish sentiment.
🛠️ Technical Analysis Tools – Bitcoin (BTC/USD)
🌟 Fibonacci Retracement
Implication:
- Trading above Pivot (85,180.45) could lead to a retest of higher resistance levels (R1-R3).
- A break below S1 (82,412.61) may intensify the downside move toward S2 and S3.
🔄 Bollinger Bands
Setup:
- The price is currently trading near the middle band, suggesting a neutral to slightly bullish trend.
- The upper band serves as resistance, while the lower band provides support.
Implication:
- A breakout above the upper band could confirm strong bullish momentum.
- A move below the lower band might indicate increasing selling pressure.
🔄 Elliott Wave Analysis
Insight:
- BTC/USD appears to be in a corrective phase (Wave 4).
- Holding above the pivot could set the stage for a bullish Wave 5 targeting R1-R3.
- A break below S1 may indicate an extended bearish correction.
⚠️ Final Thoughts & Disclaimer
This report integrates technical and fundamental analysis to provide a comprehensive outlook on the Bitcoin (BTC/USD) market. Given the volatile nature of cryptocurrencies, market participants should exercise caution and implement robust risk management strategies.
📢 Disclaimer: Cryptocurrency trading carries a high level of risk and may not be suitable for all investors. This analysis is for informational purposes only. Traders should conduct their own research and risk assessments before making any trading decisions.
🚀 Stay informed and trade wisely!
————————————————————————————————————————————————————————————————————————————-
Notice: The data presented is derived from technical analysis and does not constitute financial advice. For those trading in forex, consulting a qualified financial advisor prior to making investment decisions is strongly recommended.
Caution: The information above reflects ongoing technical analysis and should not be interpreted as financial advice. Forex trading involves high volatility, and without proper knowledge, you risk losing all your capital. It is essential to consult with a financial advisor before investing.
Advisory: The insights shared are the result of technical analysis and are not intended as financial advice. Forex traders should seek advice from professional financial advisors before making any investment decisions. Remember, the forex market is highly volatile, and trading without adequate knowledge can lead to significant losses.
Important: The analysis provided is for informational purposes only and should not be seen as financial advice. Forex trading carries substantial risks, and it is advisable to consult financial advisors before proceeding with any investments. This content is intended solely for Wealth Management Education purposes.