Market Wrap: Stocks, Bonds, Commodities
The United States restricted imports from three more Chinese companies on Tuesday as part of an effort to eliminate goods made with the forced labor of Uyghur minorities from the U.S. supply chain.
The Dow Jones Industrial Average lose 388.00 points to 33,618.88, the S&P 500 fell 1.47% to 4,273.53 and the Nasdaq Composite subtract 207.71 points to 13,063.61.
MSCI’s index of Asia-Pacific stocks outside Japan is advance 0.25% to 601.74 levels. The Australian index was lower by 0.11% to 7,030.30. Japanese Nikkei Index drop 0.09% today.
European stocks were positive on Wednesday, with the Stoxx Europe 50 Index rose 0.31% to 4,141.85, Germany’s DAX ascend 0.04% to 15,263.15, and France’s CAC rose 0.25% to 7,091.55 and U.K.’s FTSE 100 add 0.04% to 7,629.32.
Benchmark 10-year U.S. Treasury fell as demand for safe assets ascend again, today 10-year bond yields negative 1.34% to 4.5020.
Oil prices slipped in trade on Tuesday amid concerns that fuel demand will be crimped by major central banks holding interest rates higher for longer, even with supply expected to be tight.
Spot Brent crude oil ascend 0.89% to $93.22 per barrel. US West Texas Intermediate crude is up 1.25% to $91.53 a barrel.
The yellow metal gold is decline 0.31% to 1,913.85 dollars per ounce.
Market Wrap: Forex
The U.S. dollar steadied Wednesday near to new 10-month highs on worries of higher U.S. interest rates, while the euro and sterling fell to six-month lows.
Today, the U.S. dollar index measures the Greenback against a trade-weighted basket of six major currencies, which surged 0.07% to 106.000.
The Euro US Dollar (EUR/USD) is a widely traded pair that is down 0.12% today. This left the pair trading around $1.05580.
The Japanese yen was negative against the U.S. dollar on Wednesday. Today USD/JPY is surged 0.05% to the 149.120 level.
Another commodity-related currency negative against the U.S dollar, AUD/USD fell 0.28% to 0.63780, and NZD/USD slipped 0.08% to 0.59390 level.
EUR/USD Intraday: Resistance level at 1.05760
Our pivot point is at 1.05760
Preferable Price Action: Take sell positions below pivot level with targets at 1.05400 & 1.05160 in extension.
Alternative Price Action: Above pivot looks for a further upside to 1.06130 & 1.06420.
Comment: RSI is below 50 levels and Pairs below 55MA.
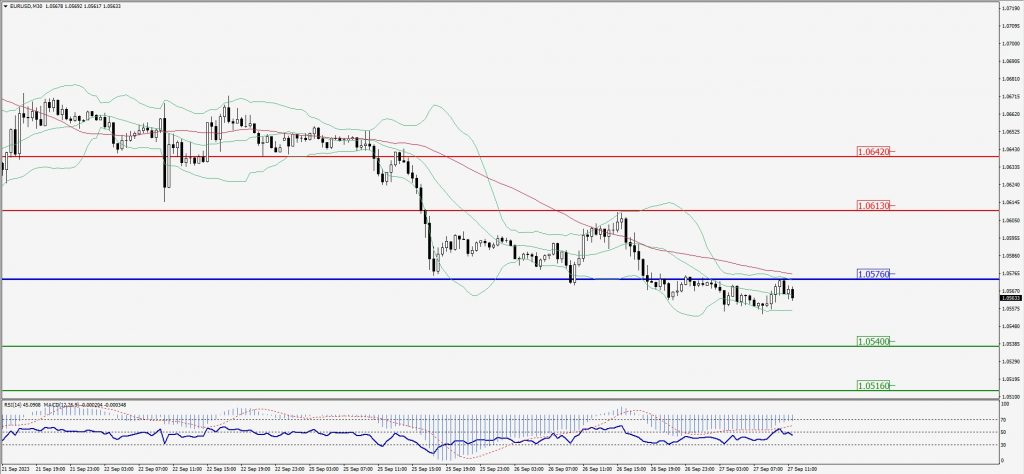
Green Lines Indicate Resistance Levels – Red Lines Indicate Support Levels
Light Blue is a Pivot Point – Black represents the price when the report was produced
GBP/USD Intraday: Trend on the downside
Our pivot point is at 1.21640
Preferable Price Action: Sell positions below pivot with targets at 1.21150 & 1.20860 in extension.
Alternative Price Action: The price above pivot would call for further upside to 1.22090 & 1.22430.
Comment: RSI is below 50 levels and Pairs below 55MA.
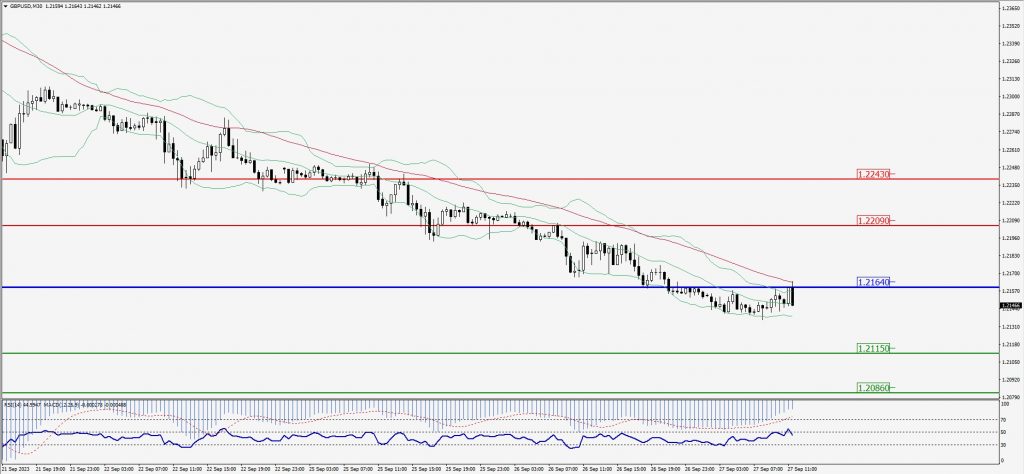
Green Lines Indicate Resistance Levels – Red Lines Indicate Support Levels
Light Blue is a Pivot Point – Black represents the price when the report was produced
USD/JPY Intraday: Support level at 149.000
Our pivot point is at 149.000
Preferable Price Action: Buy position above pivot with the target at 149.440 and 149.690 in extension.
Alternative Price Action: The downside breakout of the pivot would call for 148.640 and 148.380.
Comment: MACD is above 50 level and Pairs above 55MA.
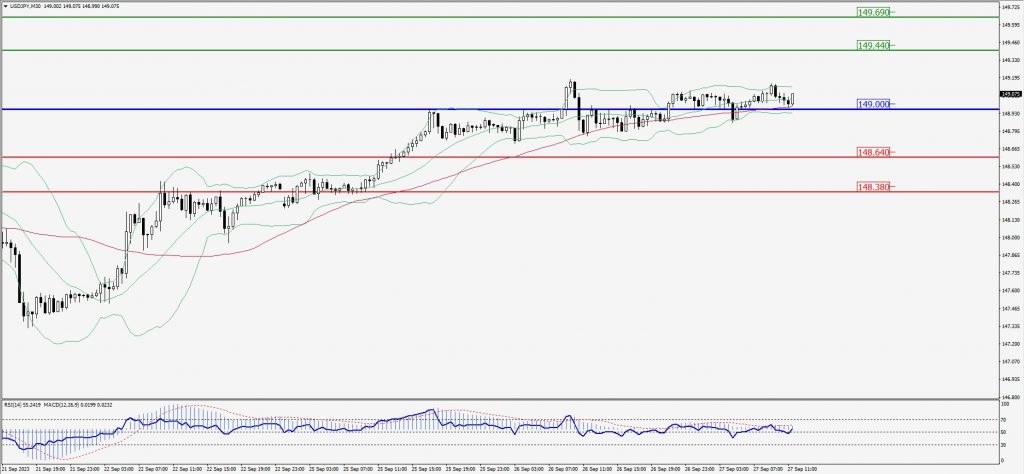
Green Lines Indicate Resistance Levels – Red Lines Indicate Support Levels
Light Blue is a Pivot Point – Black represents the price when the report was produced
AUD/USD Intraday: Trend on the downside
Our pivot point is at 0.63910
Preferable Price Action: Sell positions below pivot with targets at 0.63610 & 0.63430 in extension.
Alternative Price Action: Above pivot looks for a further upside with 0.64160 & 0.64360 as targets.
Comment: RSI is below 50 levels and Pairs below its 20MA & 55MA.
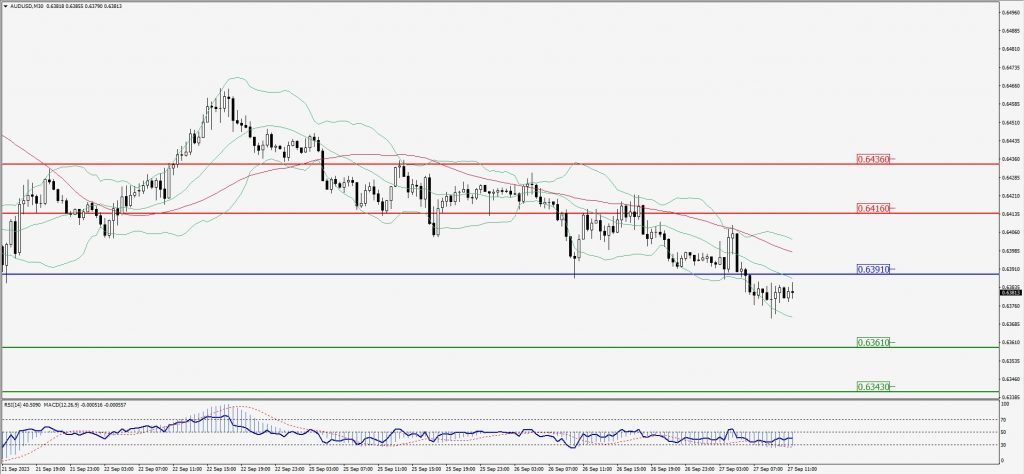
Green Lines Indicate Resistance Levels – Red Lines Indicate Support Levels
Light Blue is a Pivot Point – Black represents the price when the report was produced
CRUDEOIL Intraday: Trend on the upside
Our pivot point is at 90.46
Preferable Price Action: Above pivot buy oil with 91.21 & 91.75 as targets.
Alternative Price Action: Sell crude below pivot with targets at 89.82 and 89.31 in extension.
Comment: MACD is positive territory and Pairs above its 20MA & 55MA.
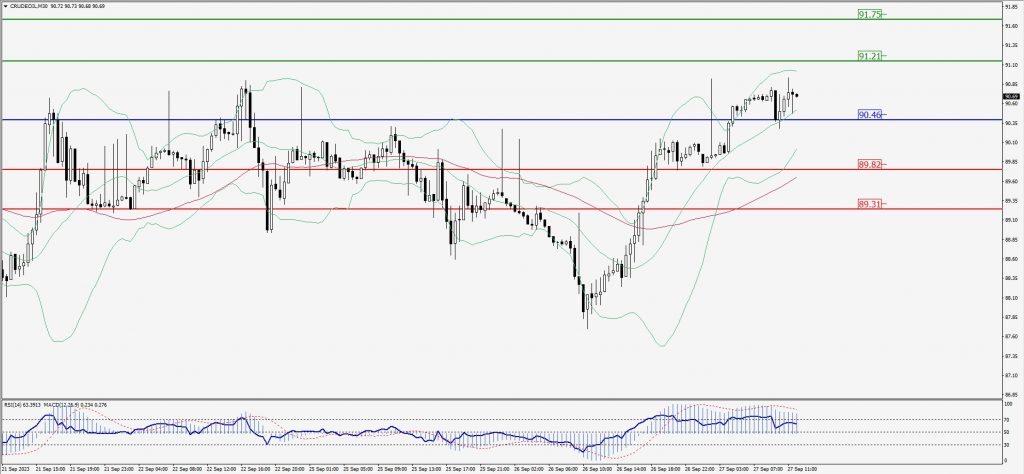
Green Lines Indicate Resistance Levels – Red Lines Indicate Support Levels
Light Blue is a Pivot Point – Black represents the price when the report was produced
Dow Jones Intraday: Trend on the upside
Our pivot point is 33,705.00
Preferable Price Action: Take buy positions above the pivot with targets at 33,863.00 & 33,988.00.
Alternative Price Action: Below 33,705.00 looks for further downside to 33,539.00 & 33,449.00.
Comment: RSI is above 50 levels and Pairs above 20MA.
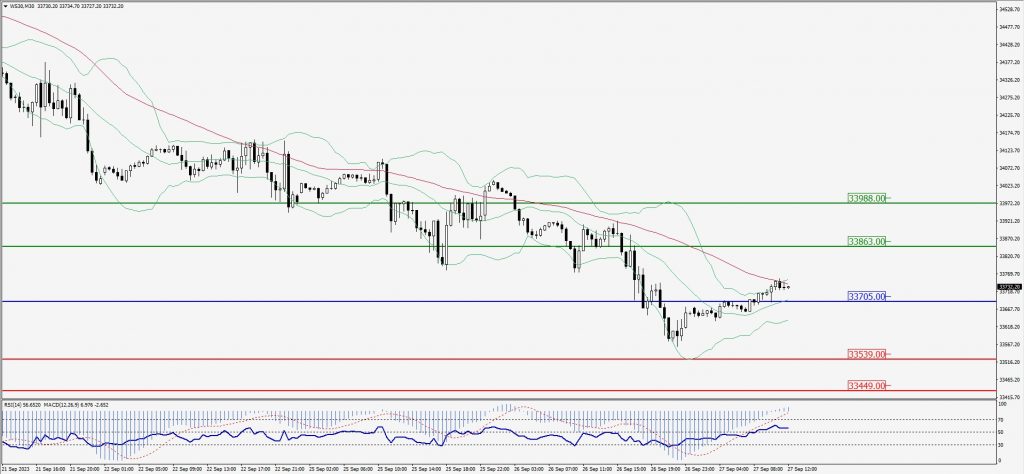
Green Lines Indicate Resistance Levels – Red Lines Indicate Support Levels
Light Blue is a Pivot Point – Black represents the price when the report was produced