Market Wrap: Stocks, Bonds, Commodities
The S&P 500 see-sawed on Monday and ended close to unchanged as investors girded for an expected rate hike at a Federal Reserve meeting this week and earnings from several large-cap growth companies.
The Dow Jones Industrial Average rose 90.75 points to 31,990.04, the S&P 500 gain 5.21 points to 3,966.84 and the Nasdaq Composite subtract 51.45 points to 11,782.67.
MSCI’s index of Asia-Pacific stocks outside Japan is ascend 0.49% to 645.03 levels. Australian index higher 0.26% to 6,807.30. Japanese Nikkei Index drop 0.24% to 27,631.88.
European stocks were negative on Tuesday, with the Stoxx Europe 50 Index fell 0.21% to 3,596.45, Germany’s DAX decline 0.50% to 13,146.37, and France’s CAC drop 0.13% to 6,229.48, and U.K.’s FTSE 100 surge 0.61% to 7,349.50.
Benchmark 10-year U.S. Treasury fell as demand for safe assets ascend again, today 10-year bond yields a negative 1.11% to 2.7890.
Oil prices rose on Tuesday for a second day on increasing concerns about tightening European supply after Russia, a key oil and natural gas supplier to the region, cut gas supply through a major pipeline.
Spot Brent crude oil add 1.76% to $101.94 per barrel. US West Texas Intermediate crude is up 1.68% to $98.30 a barrel.
The yellow metal gold is advance 0.22% to 1,722.70 dollars per ounce.
Market Wrap: Forex
The dollar held largely firm below a two-decade high on Tuesday, as traders parse through a raft of earnings and data for clues about the direction of the economy ahead of a Federal Reserve interest rate decision this week.
Today, the U.S. dollar index measures the Greenback against a trade-weighted basket of six major currencies, which is rose 0.07% to 106.420.
The Euro US Dollar (EUR/USD) is a widely traded pair that is down 0.12% today. This left the pair trading around $1.02070.
The Japanese yen was positive against the U.S. dollar on Tuesday as the stock up. Today USD/JPY is drop 0.05% to 136.590 level.
Another commodity-related currency mixed against the U.S dollar, AUD/USD gain 0.14% to 0.69630, and NZD/USD down 0.10 to 0.62580 level.
EUR/USD Intraday: Major support level at 1.02230
Our pivot point is at 1.02230
Preferable Price Action: Take buy positions above pivot level with targets at 1.02770 & 1.03210 in extension.
Alternative Price Action: Below pivot looks for a further downside to 1.01740 & 1.01350.
Comment: RSI above 50 levels and Pairs above its 20MA & 55MA.
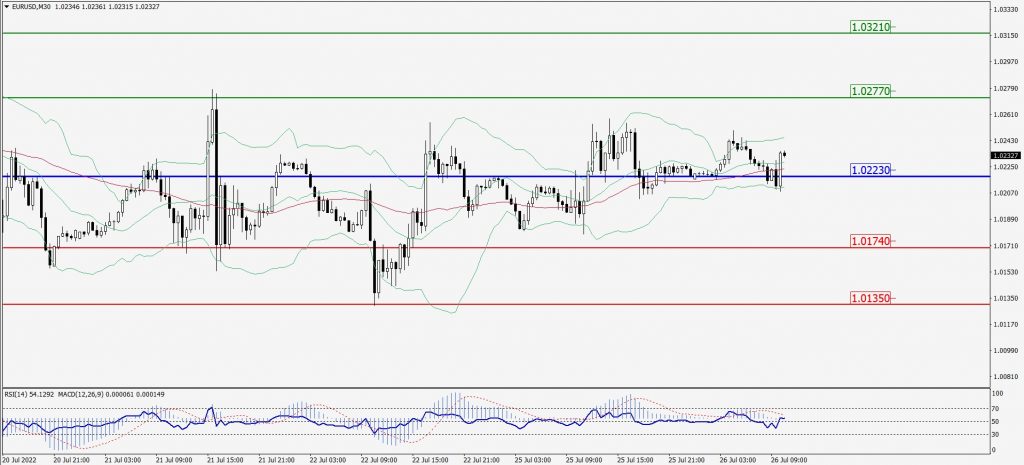
Green Lines Indicate Resistance Levels – Red Lines Indicate Support Levels
Light Blue is a Pivot Point – Black represents the price when the report was produced
GBP/USD Intraday: In a consolidation zone
Our pivot point is at 1.19930
Preferable Price Action: Sell positions below pivot with targets at 1.19930 & 1.19380 in extension.
Alternative Price Action: The price above pivot would call for further upside to 1.21490 & 1.22000.
Comment: RSI at 50 levels and pair below 20MA.
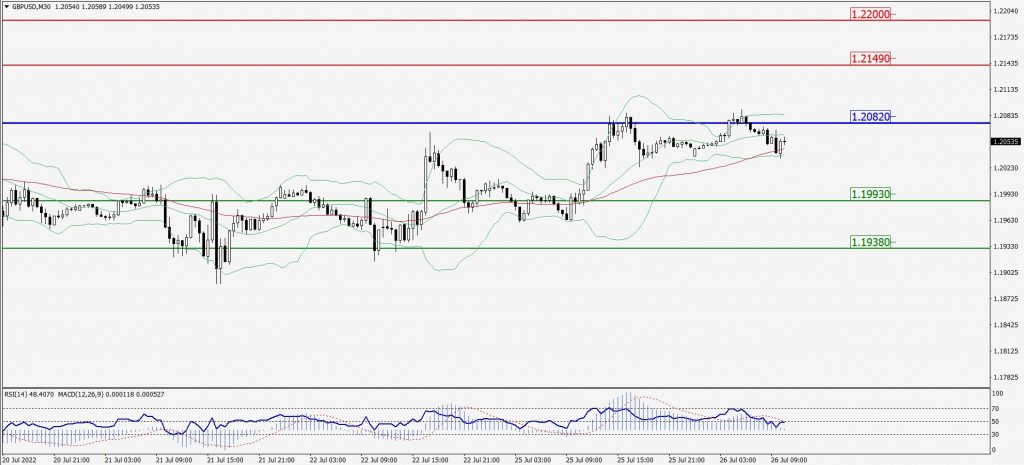
Green Lines Indicate Resistance Levels – Red Lines Indicate Support Levels
Light Blue is a Pivot Point – Black represents the price when the report was produced
USD/JPY Intraday: Trend on the upside
Our pivot point is at 136.550
Preferable Price Action: Buy position above pivot with the target at 137.380 and 138.030 in extension.
Alternative Price Action: The downside breakout of the pivot would call for 135.800 and 135.200.
Comment: MACD is positive territory and Pair above its 20MA & 55MA.
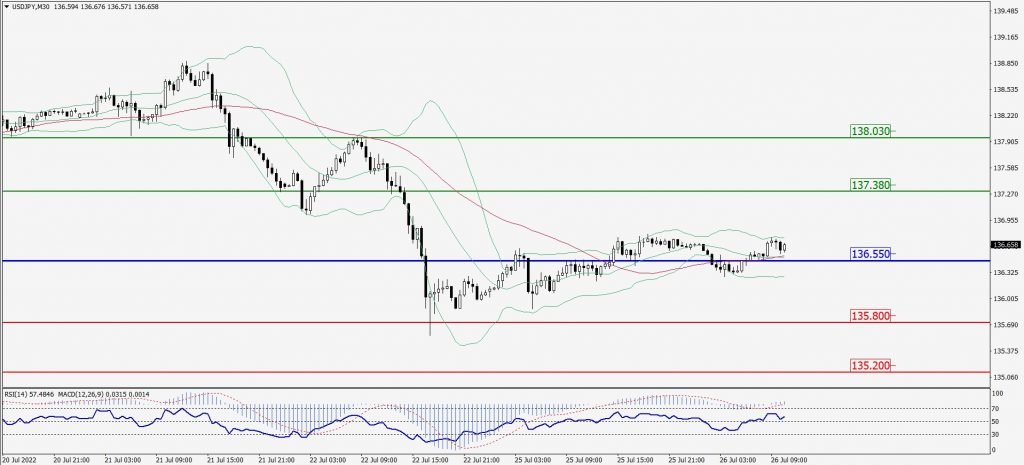
Green Lines Indicate Resistance Levels – Red Lines Indicate Support Levels
Light Blue is a Pivot Point – Black represents the price when the report was produced
AUD/USD Intraday: Support level at 0.69600
Our pivot point is at 0.69600
Preferable Price Action: Buy Positions above pivot with targets at 0.70130 & 0.70540 in extension.
Alternative Price Action: Below pivot looks for a further downside with 0.69130 & 0.68760 as targets.
Comment: RSI above 50 levels and Pairs above its 20MA & 55MA.
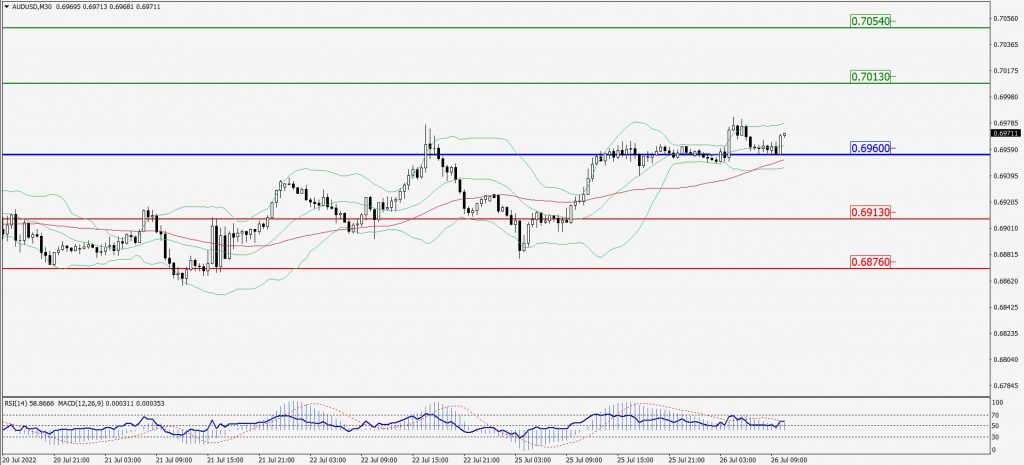
Green Lines Indicate Resistance Levels – Red Lines Indicate Support Levels
Light Blue is a Pivot Point – Black represents the price when the report was produced
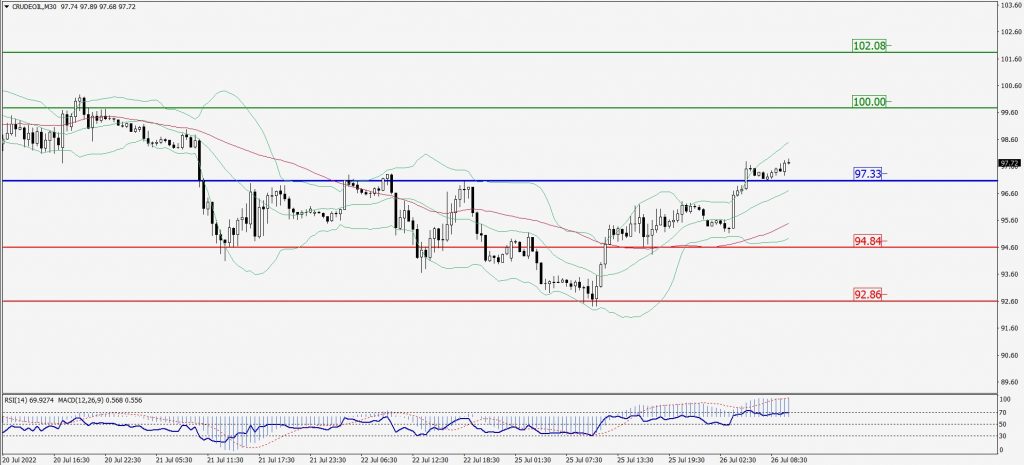
CRUDEOIL Intraday: Major trend on the upside
Our pivot point is at 97.33
Preferable Price Action: Above pivots buy oil with 100.00 & 102.08 as targets.
Alternative Price Action: Sell crude below pivot with targets at 94.84 and 92.86 in extension.
Comment: MACD is in the positive territory and Pairs above its 20MA & 55MA.
Green Lines Indicate Resistance Levels – Red Lines Indicate Support Levels
Light Blue is a Pivot Point – Black represents the price when the report was produced
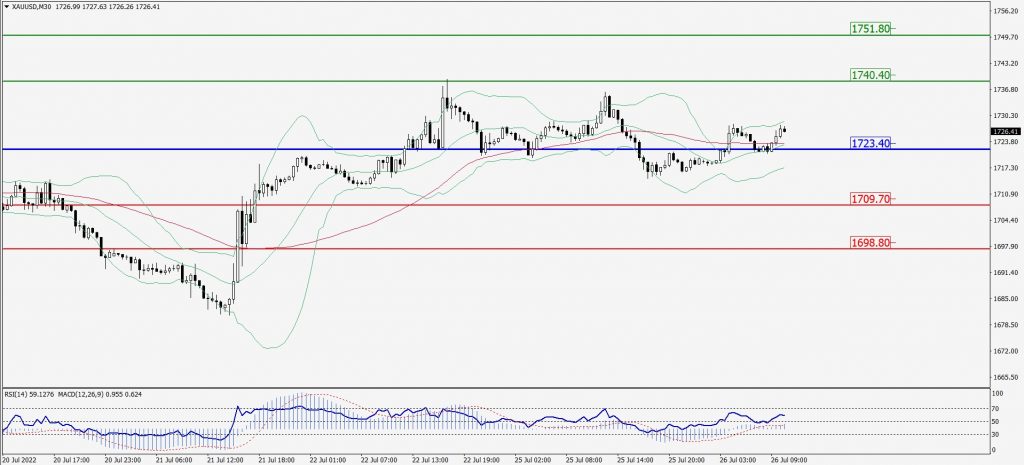
XAU/USD Intraday: Trend on the upside
Our pivot point is 1723.40
Preferable Price Action: Further upside to 1740.40 and 1751.80
Alternative Price Action: If the price gives a downside breakout of a pivot, then the price extends to 1709.70 and 1698.80.
Comment: MACD is positive territory and Pairs above its 20MA & 55MA.
Green Lines Indicate Resistance Levels – Red Lines Indicate Support Levels
Light Blue is a Pivot Point – Black represents the price when the report was produced
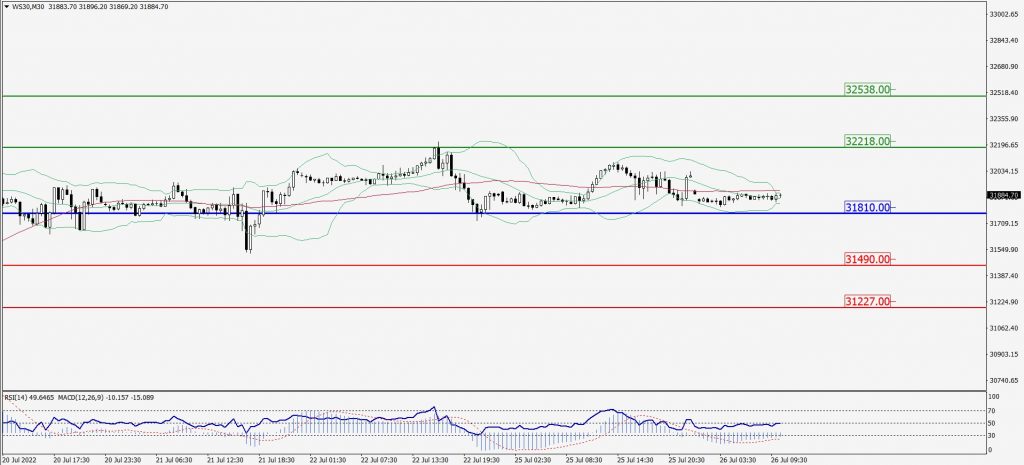
Dow Jones Intraday: In a consolidation zone
Our pivot point is 31,810.00
Preferable Price Action: Take buy positions above pivot with targets at 32,218.00 & 32,538.00.
Alternative Price Action: Below 31,810.00 looks for further downside to 31,490.00 & 31,227.00.
Comment: RSI at 50 levels and Pair below 55MA.
Green Lines Indicate Resistance Levels – Red Lines Indicate Support Levels
Light Blue is a Pivot Point – Black represents the price when the report was produced