Market Wrap: Stocks, Bonds, Commodities
Most Asian currencies rose slightly on Wednesday as persistent bets on interest rate cuts dented the dollar, while the Chinese yuan hit a 16-month high on optimism over more stimulus measures.
The Dow Jones Industrial Average rose 83.57 points to 42,208.22, the S&P 500 gain 0.25% to 5,732.93 and the Nasdaq Composite ascend 100.25 points to 18,074.52.
MSCI’s index of Asia-Pacific stocks outside Japan is up 2.37% to 732.01 levels. The Australian index was lower by 0.19% to 8,126.40. Japanese Nikkei Index decrease 0.25% today.
European stocks were negative on Wednesday, with the Stoxx Europe 50 Index decrease 0.54% to 4,913.85 Germany’s DAX descend 0.49% to 18,893.95, and France’s CAC lower 0.52% to 7,564.23 and U.K.’s FTSE 100 loss 0.31% to 8,257.42.
Benchmark 10-year U.S. Treasury fail as demand for safe assets slipped again, today 10-year bond yields 0.06% to 3.7340.
Oil prices fell on Wednesday as investors reassessed the ability of China’s stimulus plans to boost the economy enough to drive more fuel demand growth in the world’s largest crude importer.
Spot Brent crude oil decrease 0.39% to $74.18 per barrel. US West Texas Intermediate crude is decrease 0.52% to $71.19 a barrel.
The yellow metal gold is up 0.05% to 2,678.30 dollars per ounce.
Market Wrap: Forex
The Australian and New Zealand dollars scaled multi-month peaks on Wednesday while the yuan hit its strongest level in more than a year, as China’s aggressive stimulus package provided the latest shot in the arm for risk appetite.
Today, the U.S. dollar index measures the Greenback against a trade-weighted basket of six major currencies, which decrease 0.13% to 100.027.
The Euro US Dollar (EUR/USD) is a widely traded is up 0.13% today. This left the pair trading around $1.11950.
The Japanese yen was will move positive against the U.S. dollar on Wednesday. Today USD/JPY is trades pair that increase 0.30% to the 143.640 level.
Another commodity-related currency negative against the U.S dollar, AUD/USD loss 0.12% to 0.68830, and NZD/USD decrease 0.14% to 0.63290 level.
EUR/USD Intraday: Trend on the upside
Our pivot point is at 1.11880
Preferable Price Action: Take buy positions above pivot level with targets at 1.12050 & 1.12210 in extension.
Alternative Price Action: Sell pivot looks for a further downside to 1.11710 & 1.11550.
Comment: RSI is above 50 levels and Pairs above its 55MA.
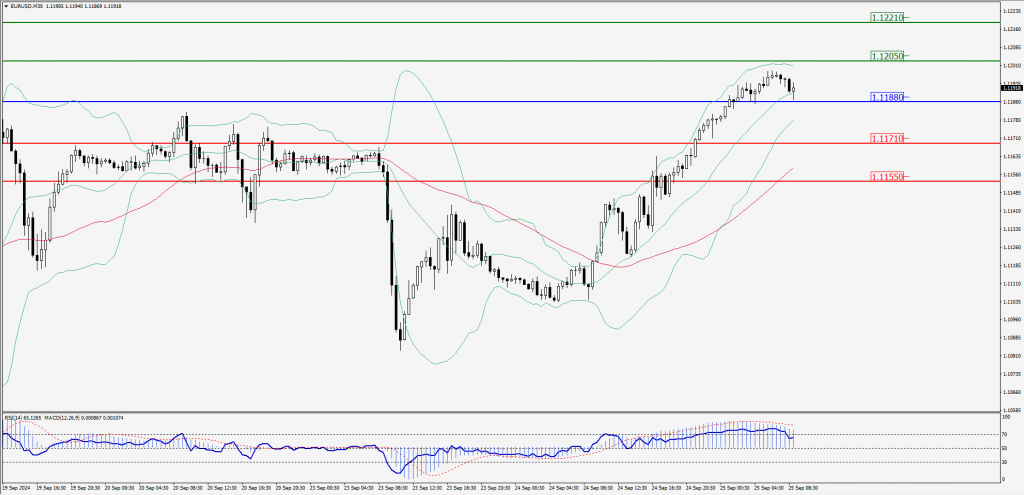
Green Lines Indicate Resistance Levels – Red Lines Indicate Support Levels
Light Blue is a Pivot Point – Black represents the price when the report was produced
GBP/USD Intraday: Trend on the downside
Our pivot point is at 1.34150
Preferable Price Action: Sell positions below pivot with targets at 1.33900 & 1.33670 in extension.
Alternative Price Action: The price above pivot would call for further upside to 1.34410 & 1.34630.
Comment: RSI is below 50 levels and Pairs below its 20MA.
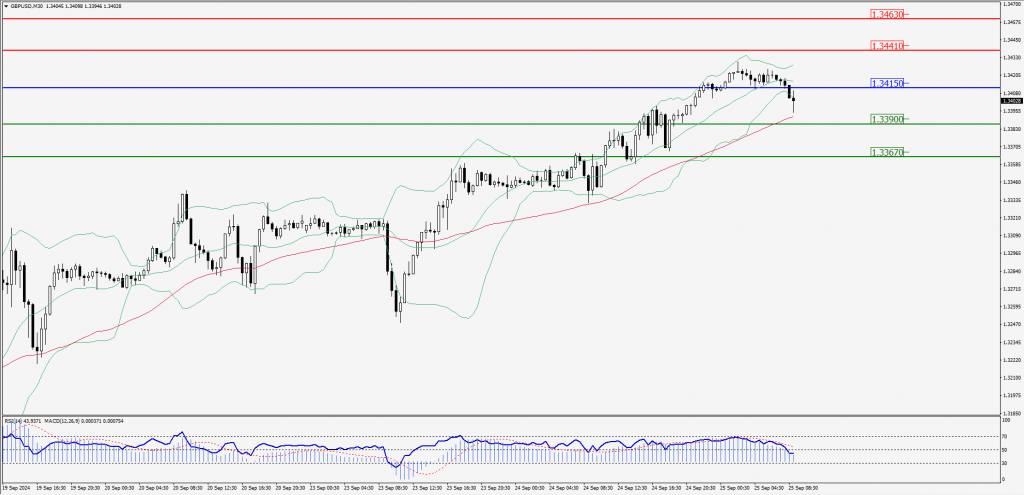
Green Lines Indicate Resistance Levels – Red Lines Indicate Support Levels
Light Blue is a Pivot Point – Black represents the price when the report was produced
USD/JPY Intraday: Trend on the upside
Our pivot point is at 143.430
Preferable Price Action: Buy position above pivot with the target at 143.860 and 144.230 in extension.
Alternative Price Action: The downside breakout of the pivot would call for 143.030 and 142.660.
Comment: MACD is above 50 levels and Pairs above its 20MA.
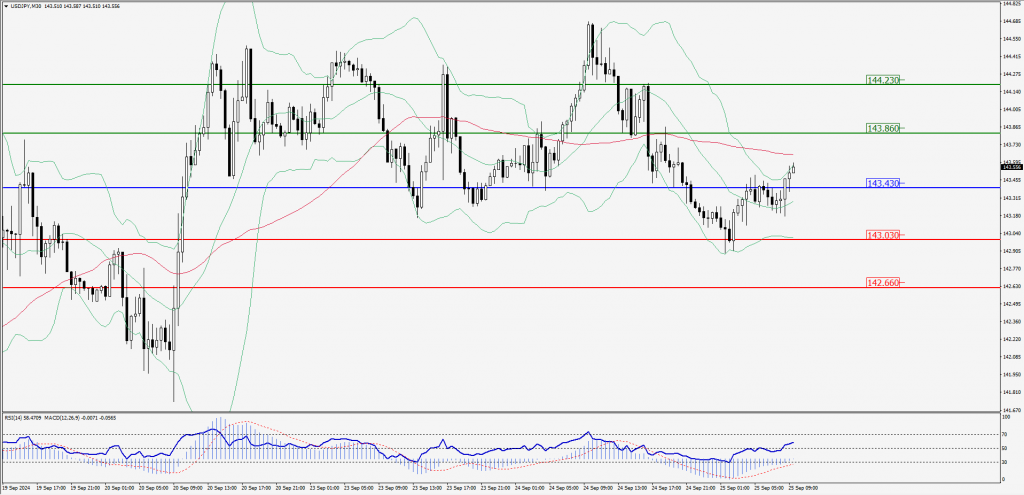
Green Lines Indicate Resistance Levels – Red Lines Indicate Support Levels
Light Blue is a Pivot Point – Black represents the price when the report was produced
AUD/USD Intraday: Trend on the downside
Our pivot point is at 0.68850
Preferable Price Action: Sell positions below pivot with targets at 0.68720 & 0.68590 in extension.
Alternative Price Action: Above pivot a further upside with 0.68980 & 0.69110 as targets.
Comment: RSI is below 50 levels and pairs below its 20MA.
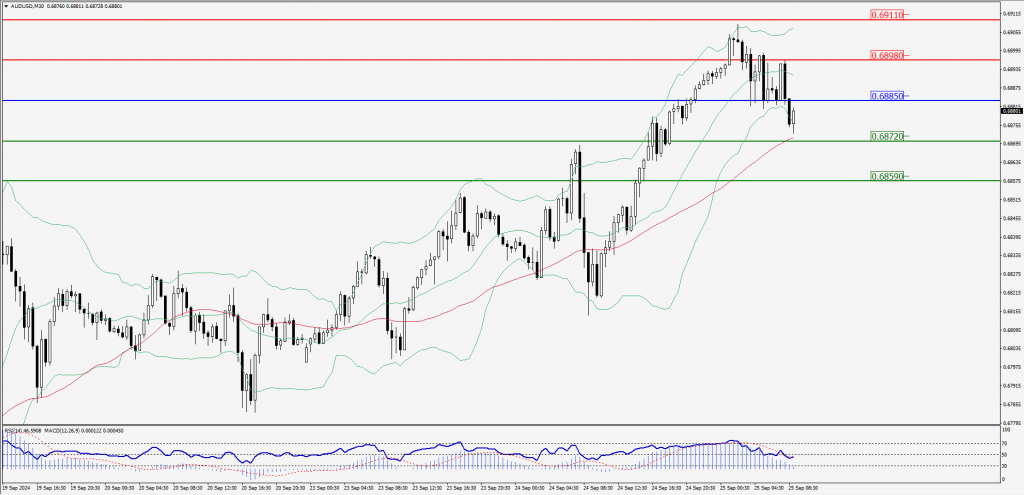
Green Lines Indicate Resistance Levels – Red Lines Indicate Support Levels
Light Blue is a Pivot Point – Black represents the price when the report was produced
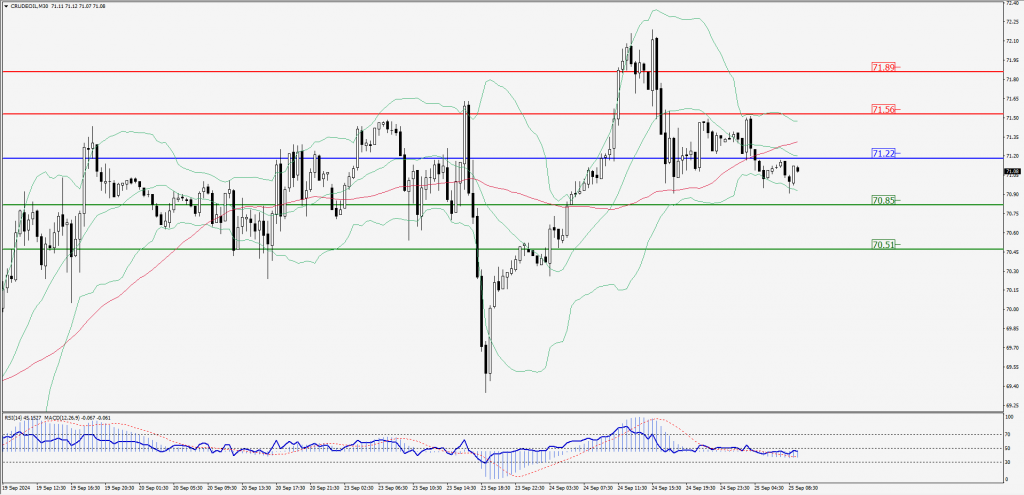
CRUDEOIL Intraday: Trend on the downside
Our pivot point is at 71.22
Preferable Price Action: Below pivot sell oil with 70.85 & 70.51 as targets.
Alternative Price Action: Buy crude above pivot with targets at 71.56 and 71.89 in extension.
Comment: RSI is at below 50 levels and pairs below its 20MA & 55MA.
Green Lines Indicate Resistance Levels – Red Lines Indicate Support Levels
Light Blue is a Pivot Point – Black represents the price when the report was produced
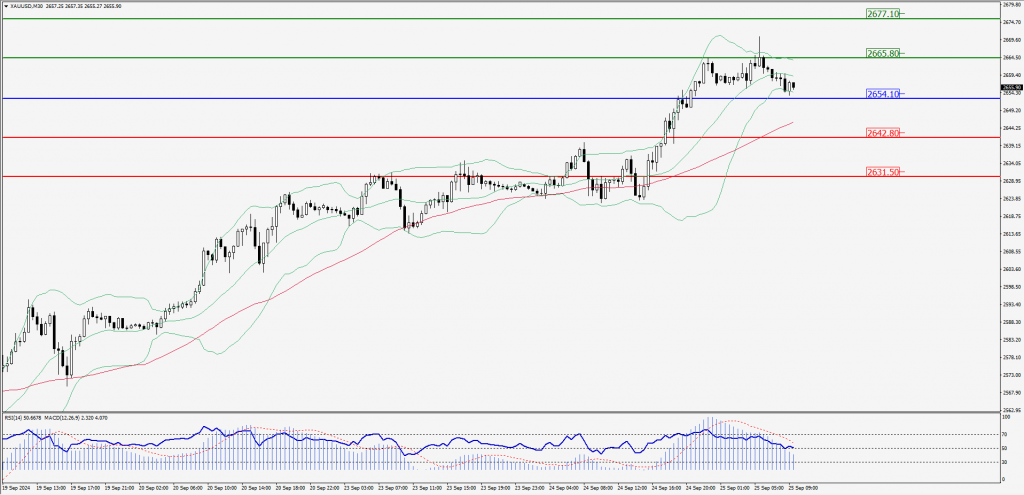
XAU/USD Intraday: Trend on the upside
Our pivot point is at 2654.10
Preferable Price Action: Further upside to 2665.80 and 2677.10.
Alternative Price Action: If the price gives an downside breakout of a pivot, then the price extends to 2642.80 and 2631.50.
Comment: MACD is above 50 levels and pairs above its 55MA.
Green Lines Indicate Resistance Levels – Red Lines Indicate Support Levels
Light Blue is a Pivot Point – Black represents the price when the report was produced
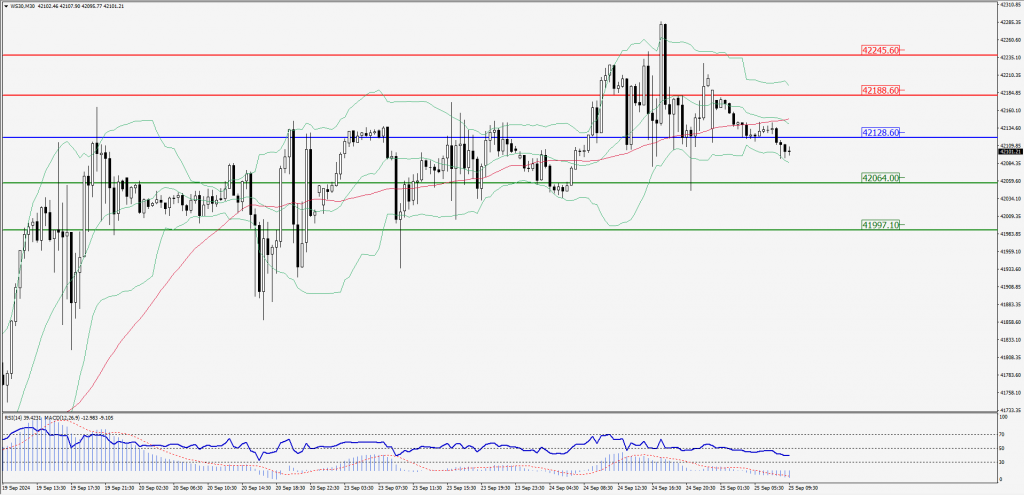
Dow Jones Intraday: Trend on the downside
Our pivot point is 42,128.60
Preferable Price Action: Take sell positions below the pivot with targets at 42,064.00 & 41,997.10.
Alternative Price Action: Above 42,128.60 looks for further upside to 42,188.60 & 42,245.60.
Comment: RSI is below 50 levels and pairs below its 55MA & 20MA.
Green Lines Indicate Resistance Levels – Red Lines Indicate Support Levels
Light Blue is a Pivot Point – Black represents the price when the report was produced