Market Wrap: Stocks, Bonds, Commodities
Wall Street closed sharply higher on Monday, fuelled by surging technology stocks as investors began an earnings-heavy week with a renewed enthusiasm for market-leading momentum stocks that were battered last year.
The Dow Jones Industrial Average rose 254.07 points to 33,629.56, the S&P 500 gain 1.19% to 4,019.81 and the Nasdaq Composite add 223.98 points to 11,364.41.
MSCI’s index of Asia-Pacific stocks outside Japan is ascend 0.12% to 675.15 levels. The Australian index was higher by 0.44% to 7,490.40. Japanese Nikkei Index gain 1.46% today.
European stocks were positive on Tuesday, with the Stoxx Europe 50 Index rose 0.18% to 4,158.35, Germany’s DAX gain 0.14% to 15,123.50, and France’s CAC advance 0.27% to 7,049.97, and U.K.’s FTSE 100 subtract 0.04% to 7,780.66.
Benchmark 10-year U.S. Treasury fell as demand for safe assets ascend again, today 10-year bond yields are negative 0.74% to 3.4970.
Oil prices settled mixed on Monday, retreating as investors cashed in on a jump to a seven-week high on optimism about a possible recovery in demand of top oil importer China as the economy recovers this year from pandemic lockdowns.
Spot Brent crude oil fell 0.12% to $88.07 per barrel. US West Texas Intermediate crude is up 0.02% to $81.67 a barrel.
The yellow metal gold is advance 0.75% to 1,943.95 dollars per ounce.
Market Wrap: Forex
The dollar hovered near a nine-month low to the euro and gave back recent gains against the yen on Tuesday, as traders weighed the risks of a U.S. recession and the path for Federal Reserve policy.
Today, the U.S. dollar index measures the Greenback against a trade-weighted basket of six major currencies, which slipped 0.36% to 101.555.
The Euro US Dollar (EUR/USD) is a widely traded pair that is up 0.21% today. This left the pair trading around $1.08910.
The Japanese yen was positive against the U.S. dollar on Tuesday. Today USD/JPY is ascend 0.60% to the 129.90 level.
Another commodity-related currency positive against the U.S dollar, AUD/USD rose 0.11% to 0.70360, and NZD/USD gain 0.35% to 0.65080 level.
EUR/USD Intraday: Trend on the upside
Our pivot point is at 1.08830
Preferable Price Action: Take long positions above pivot level with targets at 1.09070 & 1.09250 in extension.
Alternative Price Action: Below pivot looks for a further downside to 1.08620 & 1.08440.
Comment: RSI is above 50 levels and Pairs above its 20MA & 55MA.
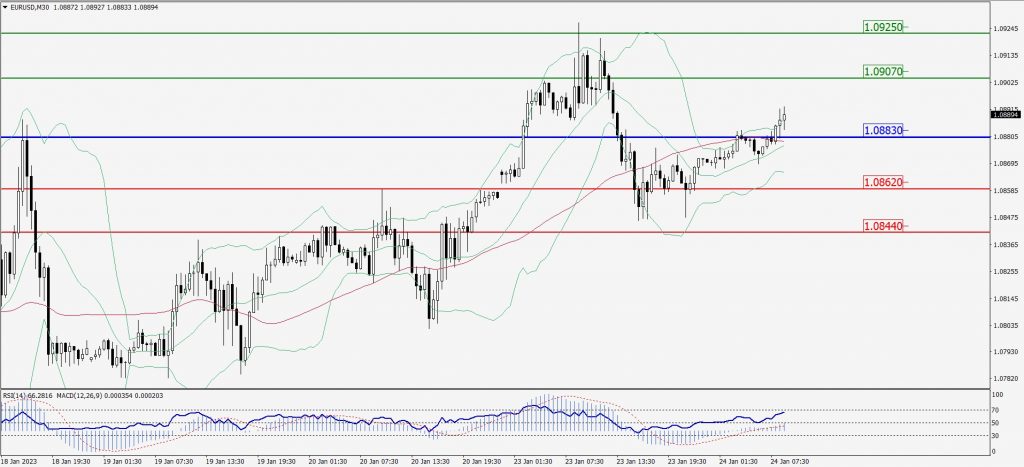
Green Lines Indicate Resistance Levels – Red Lines Indicate Support Levels
Light Blue is a Pivot Point – Black represents the price when the report was produced
GBP/USD Intraday: Trend on the upside
Our pivot point is at 1.23970
Preferable Price Action: Buy positions above pivot with targets at 1.24240 & 1.24410 in extension.
Alternative Price Action: The price below pivot would call for further downside to 1.23760 & 1.23600.
Comment: RSI is above 50 levels and Pairs above its 20MA & 55MA.
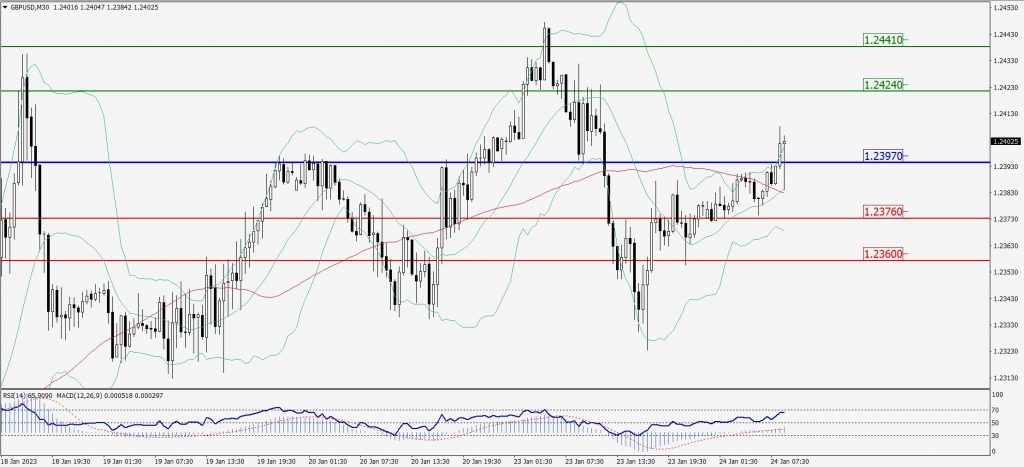
Green Lines Indicate Resistance Levels – Red Lines Indicate Support Levels
Light Blue is a Pivot Point – Black represents the price when the report was produced
USD/JPY Intraday: Trend on the upside
Our pivot point is at 130.260
Preferable Price Action: Sell position below pivot with the target at 129.690 and 129.330 in extension.
Alternative Price Action: The upside breakout of the pivot would call for 130.730 and 131.090.
Comment: MACD is below 50 level and Pairs below its 20MA & 55MA.
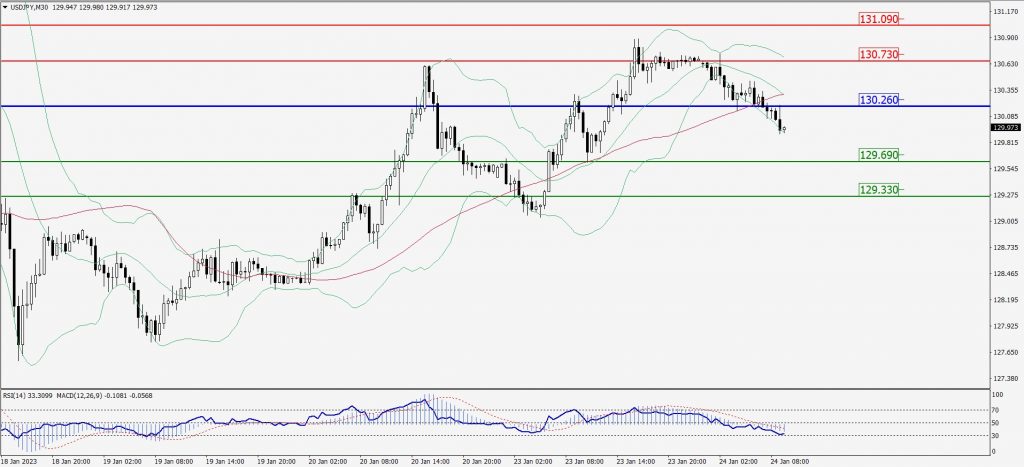
Green Lines Indicate Resistance Levels – Red Lines Indicate Support Levels
Light Blue is a Pivot Point – Black represents the price when the report was produced
AUD/USD Intraday: Support level at 0.70360
Our pivot point is at 0.70360
Preferable Price Action: Buy positions above pivot with targets at 0.70700 & 0.70990 in extension.
Alternative Price Action: Below pivot looks for a further downside with 0.70050 & 0.69810 as targets.
Comment: RSI is above 50 levels and pairs above its 20MA & 55MA.
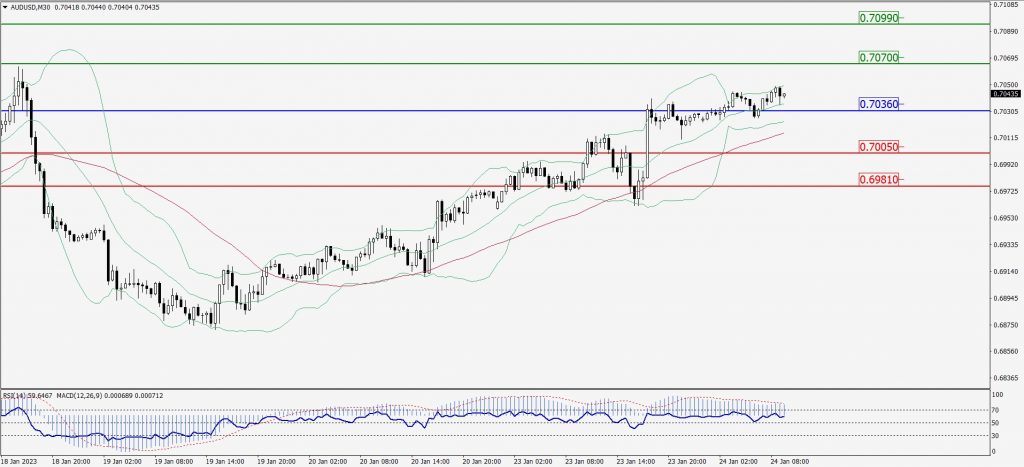
Green Lines Indicate Resistance Levels – Red Lines Indicate Support Levels
Light Blue is a Pivot Point – Black represents the price when the report was produced
CRUDEOIL Intraday: Resistance level at 81.99
Our pivot point is at 81.99
Preferable Price Action: Below pivot sell oil with 81.43 & 80.98 as targets.
Alternative Price Action: Buy crude above pivot with targets at 82.48 and 82.90 in extension.
Comment: MACD is negative territory and Pairs below 55MA.
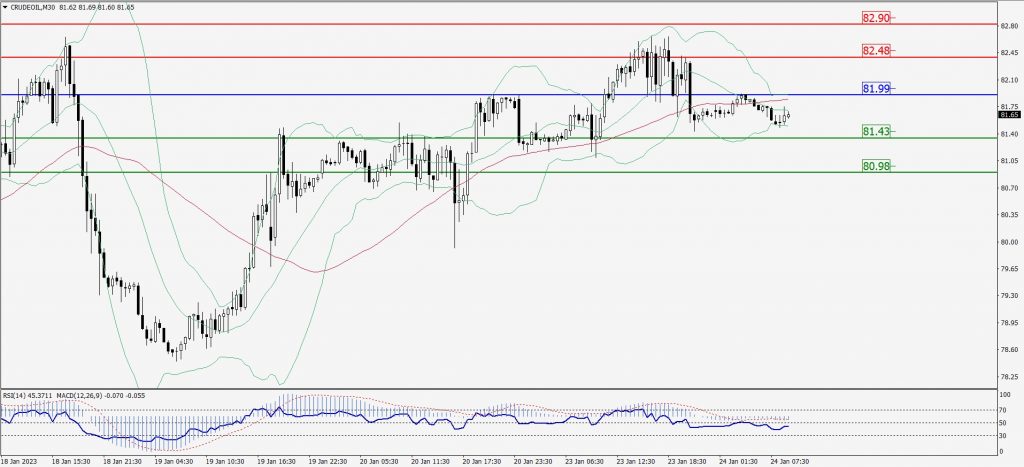
Green Lines Indicate Resistance Levels – Red Lines Indicate Support Levels
Light Blue is a Pivot Point – Black represents the price when the report was produced
XAU/USD Intraday: Major trend on the upside
Our pivot point is 1936.60
Preferable Price Action: Further upside to 1947.80 and 1955.70
Alternative Price Action: If the price gives a downside breakout of a pivot, then the price extends to 1927.50 and 1920.40.
Comment: MACD is above 50 level and Pairs above its 20MA & 55MA.
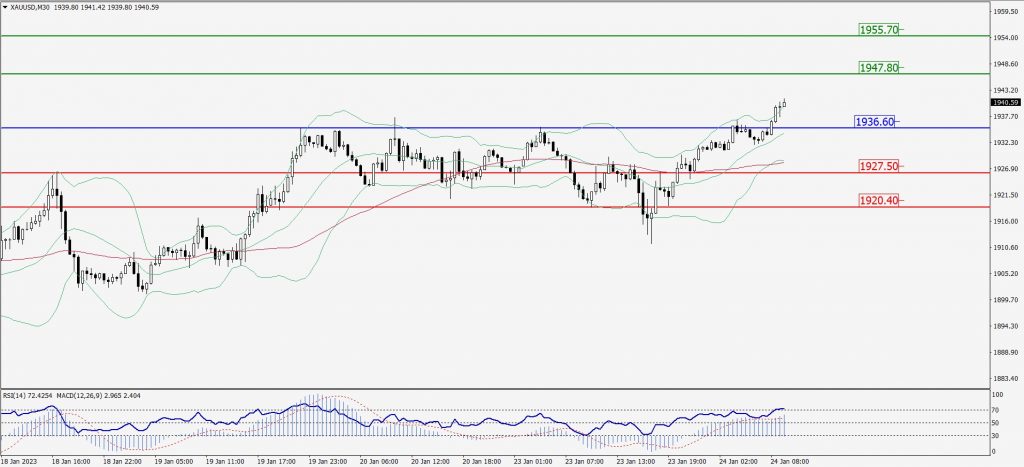
Green Lines Indicate Resistance Levels – Red Lines Indicate Support Levels
Light Blue is a Pivot Point – Black represents the price when the report was produced
Dow Jones Intraday: Trend on the upside
Our pivot point is 33,591.00
Preferable Price Action: Take buy positions up the pivot with targets at 33,744.00 & 33,876.00.
Alternative Price Action: Below 33,591.00 looks for further downside to 33,468.00 & 33,361.00.
Comment: RSI is above 50 levels and Pairs above 55MA.
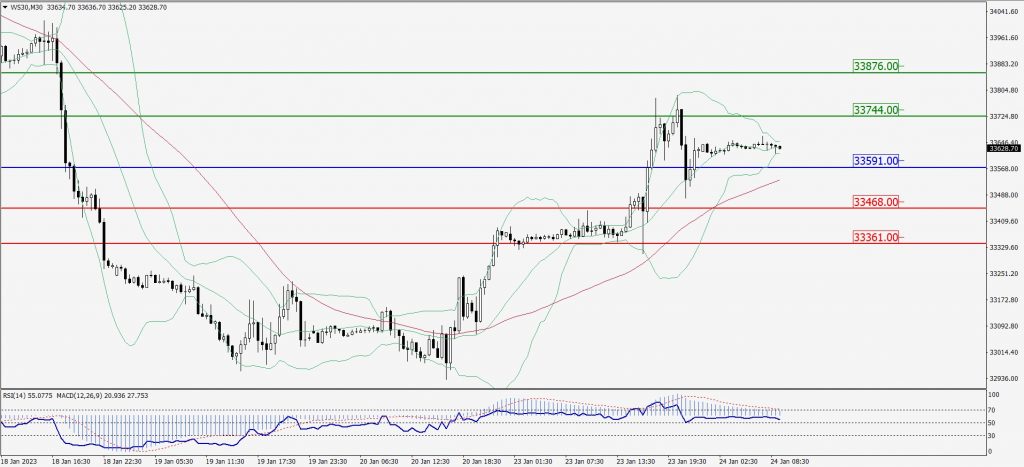
Green Lines Indicate Resistance Levels – Red Lines Indicate Support Levels
Light Blue is a Pivot Point – Black represents the price when the report was produced