Market Wrap: Stocks, Bonds, Commodities
Most Asian currencies moved in a tight range on Tuesday, while the dollar extended overnight gains as traders positioned for a slower pace of interest rate cuts in the coming year.
The Dow Jones Industrial Average rose 66.69 points to 42,906.95, the S&P 500 gain 0.73% to 5,974.07 and the Nasdaq Composite up 192.28 points to 19,764.88.
MSCI’s index of Asia-Pacific stocks outside Japan is up 1.63% to 710.57 levels. The Australian index was higher by 0.24% to 8,220.90. Japanese Nikkei Index decrease 0.26% today.
European stocks were mixed on Tuesday, with the Stoxx Europe 50 Index decrease 0.22% to 4,851.65 Germany’s DAX descend 0.18% to 19,848.77, and France’s CAC lower 0.03% to 7,272.32 and U.K.’s FTSE 100 gain 0.22% to 8,102.72.
Benchmark 10-year U.S. Treasury rose as demand for safe assets slipped again, today 10-year bond yields 0.15% to 4.5920.
Oil prices rose on Tuesday, reversing the prior session’s losses, buoyed by slightly positive market outlooks for the short term and stronger U.S. economic data, despite thin trade ahead of the Christmas holiday.
Spot Brent crude oil increase 0.51% to $72.69 per barrel. US West Texas Intermediate crude is increase 0.53% to $69.61 a barrel.
The yellow metal gold is up 0.23% to 2,634.29 dollars per ounce.
Market Wrap: Forex
The dollar was on the front foot on Tuesday as the prospect of higher-for-longer U.S. interest rates remained top of investors’ minds, leaving other currencies struggling near milestone lows.
Today, the U.S. dollar index measures the Greenback against a trade-weighted basket of six major currencies, which either descend 0.08% to 107.890.
The Euro US Dollar (EUR/USD) is a widely traded is down 0.08% today. This left the pair trading around $1.03970.
The Japanese yen was will move negative against the U.S. dollar on Tuesday. Today USD/JPY is trades pair that decrease 0.05% to the 157.07 level.
Another commodity-related currency positive against the U.S dollar, AUD/USD gain 0.02% to 0.62480, and NZD/USD increase 0.08% to 0.56530 level.
EUR/USD Intraday: Trend on the downside
Our pivot point is at 1.04040
Preferable Price Action: Take sell positions below pivot level with targets at 1.03820 & 1.03640 in extension.
Alternative Price Action: Buy pivot looks for a further upside to 1.04260 & 1.04450.
Comment: RSI is below 50 levels and pairs below its 55MA & 20MA.
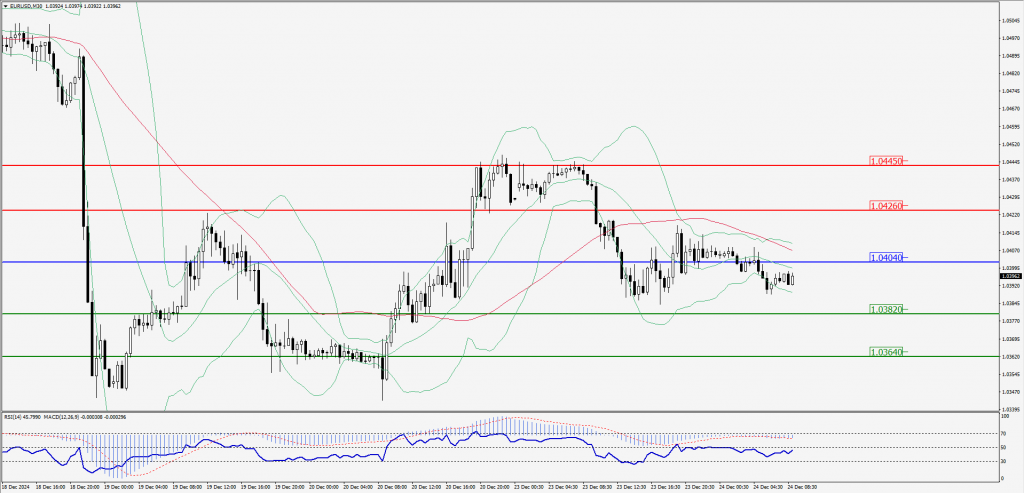
Green Lines Indicate Resistance Levels – Red Lines Indicate Support Levels
Light Blue is a Pivot Point – Black represents the price when the report was produced
GBP/USD Intraday: Trend on the downside
Our pivot point is at 1.25430
Preferable Price Action: Sell positions below pivot with targets at 1.25120 & 1.24840 in extension.
Alternative Price Action: The price above pivot would call for further upside to 1.25760 & 1.26060.
Comment: RSI is below 50 levels.

Green Lines Indicate Resistance Levels – Red Lines Indicate Support Levels
Light Blue is a Pivot Point – Black represents the price when the report was produced
USD/JPY Intraday: Trend on the upside
Our pivot point is at 156.980
Preferable Price Action: Buy position above pivot with the target at 157.560 and 158.130 in extension.
Alternative Price Action: The downside breakout of the pivot would call for 156.410 and 155.860.
Comment: MACD is above 50 levels.

Green Lines Indicate Resistance Levels – Red Lines Indicate Support Levels
Light Blue is a Pivot Point – Black represents the price when the report was produced
AUD/USD Intraday: Trend on the upside
Our pivot point is at 0.62410
Preferable Price Action: Buy positions above pivot with targets at 0.62580 & 0.62740 in extension.
Alternative Price Action: Below pivot a further downside with 0.62240 & 0.62080 as targets.
Comment: RSI is above 50 levels.

Green Lines Indicate Resistance Levels – Red Lines Indicate Support Levels
Light Blue is a Pivot Point – Black represents the price when the report was produced
CRUDEOIL Intraday: Trend on the upside
Our pivot point is at 69.41
Preferable Price Action: Above pivot buy oil with 69.71 & 69.98 as targets.
Alternative Price Action: Sell crude below pivot with targets at 69.12 & 68.85 in extension.
Comment: RSI is at above 50 levels and pairs above its 55MA & 20MA.
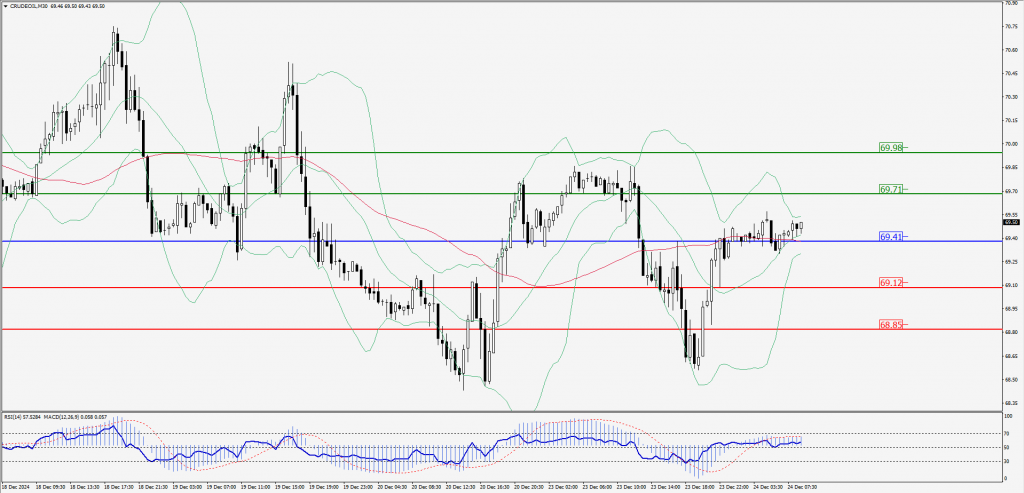
Green Lines Indicate Resistance Levels – Red Lines Indicate Support Levels
Light Blue is a Pivot Point – Black represents the price when the report was produced
XAU/USD Intraday: Trend on the upside
Our pivot point is at 2616.40
Preferable Price Action: Further upside to 2624.90 and 2632.60.
Alternative Price Action: If the price gives an downside breakout of a pivot, then the price extends to 2608.00 and 2600.20.
Comment: MACD is above 50 levels and pairs above its 20MA.

Green Lines Indicate Resistance Levels – Red Lines Indicate Support Levels
Light Blue is a Pivot Point – Black represents the price when the report was produced
Dow Jones Intraday: Trend on the upside
Our pivot point is 42,859.70
Preferable Price Action: Take buy positions above the pivot with targets at 43,073.00 & 43,263.30.
Alternative Price Action: Below 42,957.70 looks for further downside to 42,657.90 & 42,472.10.
Comment: RSI is above 50 levels and pairs above its 55MA.
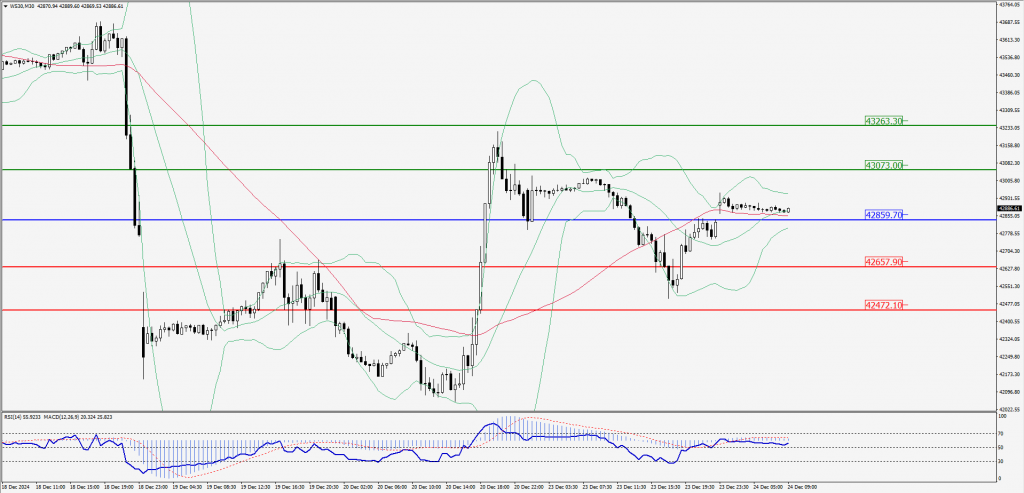
Green Lines Indicate Resistance Levels – Red Lines Indicate Support Levels
Light Blue is a Pivot Point – Black represents the price when the report was produced