Market Wrap: Stocks, Bonds, Commodities
Stock futures ticked higher on Wednesday, with investors focusing on key second-quarter results from chipmaker Nvidia to gauge whether the AI excitement is more than just hype.
The Dow Jones Industrial Average rose 184.15 points to 34,472.98, the S&P 500 gain 1.10% to 4,436.01 and the Nasdaq Composite add 215.16 points to 13,721.03.
MSCI’s index of Asia-Pacific stocks outside Japan is advance 1.75% to 622.23 levels. The Australian index was higher by 0.47% to 7,182.10. Japanese Nikkei Index ascend 0.72% today.
European stocks were positive on Thursday, with the Stoxx Europe 50 Index rose 0.63% to 4,294.65, Germany’s DAX ascend 0.52% to 15,808.05, and France’s CAC advance 0.62% to 7,291.68 and U.K.’s FTSE 100 add 0.42% to 7,351.69.
Benchmark 10-year U.S. Treasury fell as demand for safe assets ascend again, today 10-year bond yields negative 0.43% to 4.1820.
Oil prices dipped on Wednesday as demand woes stemming from a build in U.S. gasoline stocks and weak manufacturing data globally outweighed optimism around a larger-than-expected drop in U.S. crude stocks.
Spot Brent crude oil ascend 0.06% to $83.26 per barrel. US West Texas Intermediate crude is up 0.04% to $78.92 a barrel.
The yellow metal gold is advance 0.04% to 1,948.95 dollars per ounce.
Market Wrap: Forex
The dollar edged up on Thursday as investors were cautious after softer-than expected economic data muddied interest rate outlook ahead of the Federal Reserve’s Jackson Hole symposium, while the Turkish lira awaited for a central bank rate decision.
Today, the U.S. dollar index measures the Greenback against a trade-weighted basket of six major currencies, which surged 0.08% to 103.422.
The Euro US Dollar (EUR/USD) is a widely traded pair that is up 0.02% today. This left the pair trading around $1.08600.
The Japanese yen was negative against the U.S. dollar on Thursday. Today USD/JPY is surged 0.29% to the 145.250 level.
Another commodity-related currency negative against the U.S dollar, AUD/USD fell 0.25% to 0.64600, and NZD/USD slipped 0.47% to 0.59510 level.
EUR/USD Intraday: Resistance level at 1.08680
Our pivot point is at 1.08680
Preferable Price Action: Take sell positions below pivot level with targets at 1.08390 & 1.08200 in extension.
Alternative Price Action: Above pivot looks for a further upside to 1.08930 & 1.09130.
Comment: RSI is below 50 levels and Pairs below 20MA.
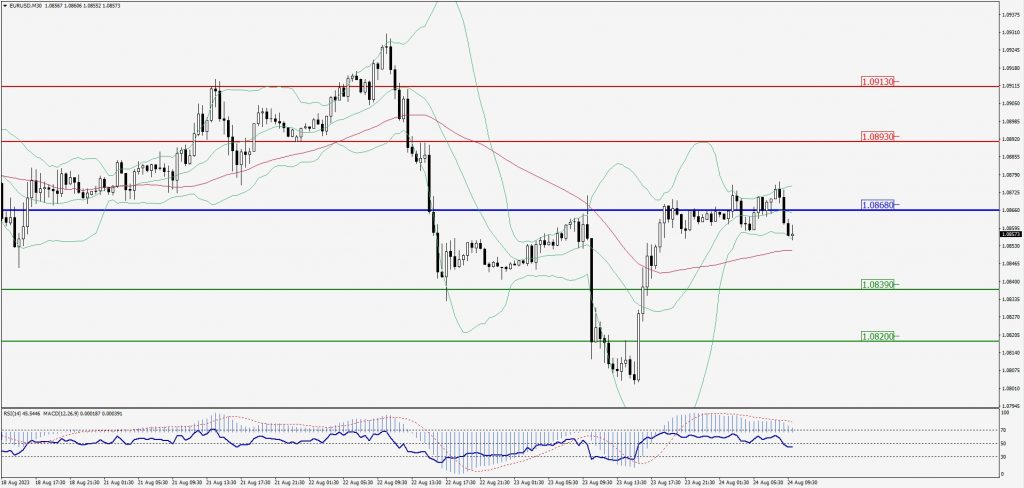
Green Lines Indicate Resistance Levels – Red Lines Indicate Support Levels
Light Blue is a Pivot Point – Black represents the price when the report was produced
GBP/USD Intraday: Trend on the downside
Our pivot point is at 1.27170
Preferable Price Action: Sell positions below pivot with targets at 1.26820 & 1.26550 in extension.
Alternative Price Action: The price above pivot would call for further upside to 1.27550 & 1.27800.
Comment: RSI is below 50 levels and Pairs below its 20MA & 55MA.
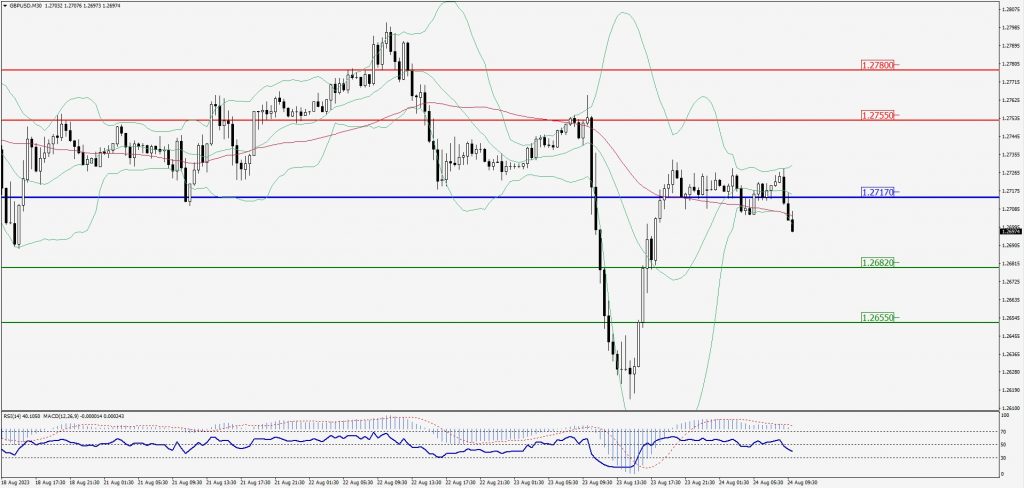
Green Lines Indicate Resistance Levels – Red Lines Indicate Support Levels
Light Blue is a Pivot Point – Black represents the price when the report was produced
USD/JPY Intraday: Trend on the upside
Our pivot point is at 145.050
Preferable Price Action: Buy position above pivot with the target at 145.370 and 145.590 in extension.
Alternative Price Action: The downside breakout of the pivot would call for 144.760 and 144.570.
Comment: MACD is above 50 level and Pairs above 20MA.
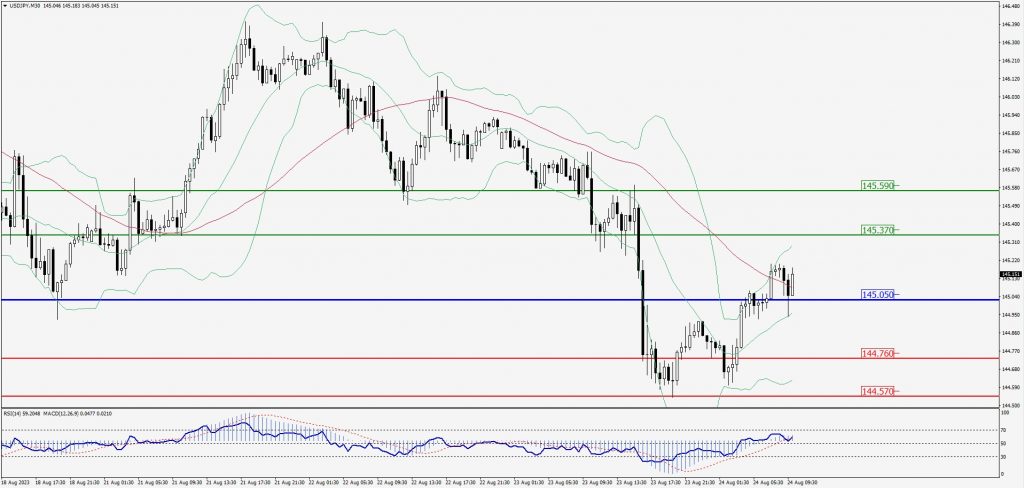
Green Lines Indicate Resistance Levels – Red Lines Indicate Support Levels
Light Blue is a Pivot Point – Black represents the price when the report was produced
AUD/USD Intraday: Trend on the downside
Our pivot point is at 0.64700
Preferable Price Action: Sell positions below pivot with targets at 0.64460 & 0.64310 in extension.
Alternative Price Action: Above pivot looks for a further upside with 0.64890 & 0.65050 as targets.
Comment: RSI is below 50 levels and Pairs below 20MA.
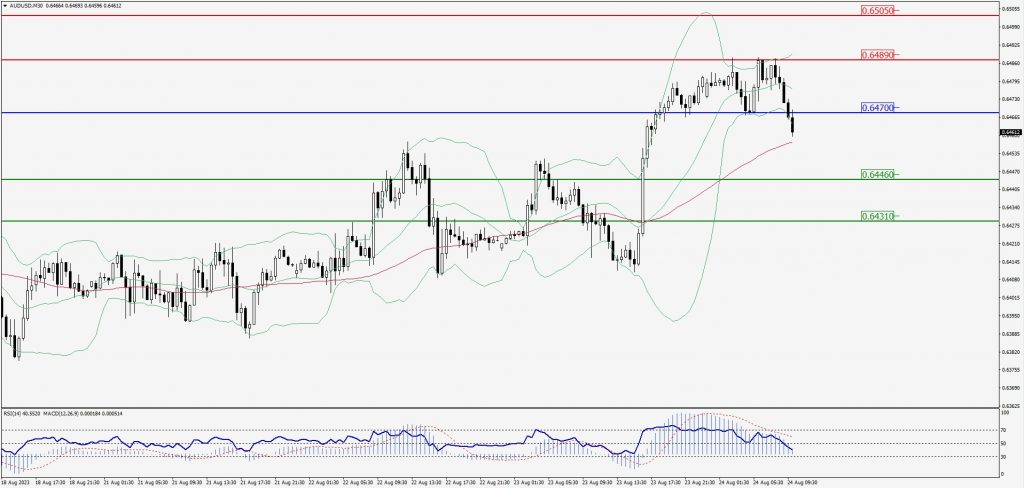
Green Lines Indicate Resistance Levels – Red Lines Indicate Support Levels
Light Blue is a Pivot Point – Black represents the price when the report was produced
CRUDEOIL Intraday: Trend on the downside
Our pivot point is at 78.59
Preferable Price Action: Below pivot sell oil with 77.74 & 77.25 as targets.
Alternative Price Action: Buy crude above pivot with targets at 79.27 and 79.78 in extension.
Comment: MACD is negative territory and Pairs below its 20MA & 55MA.
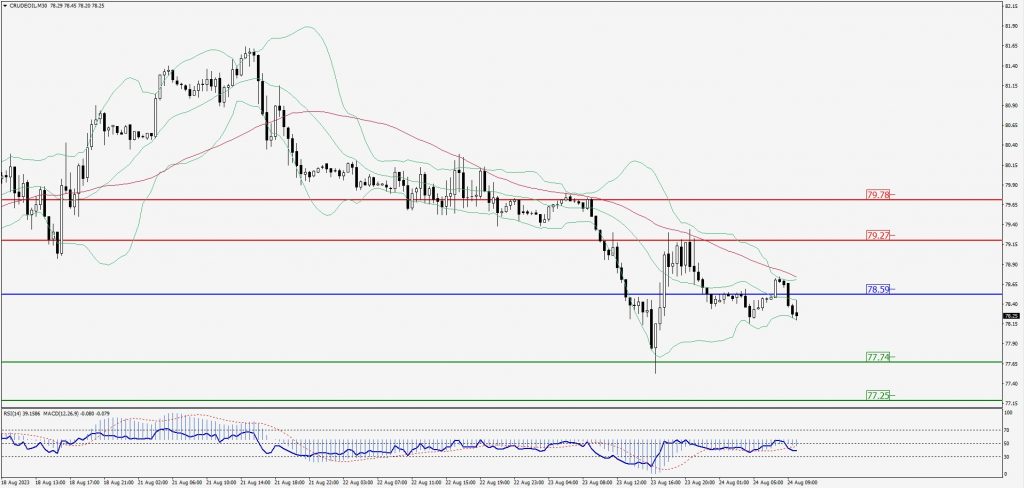
Green Lines Indicate Resistance Levels – Red Lines Indicate Support Levels
Light Blue is a Pivot Point – Black represents the price when the report was produced
XAU/USD Intraday: Major trend on the upside
Our pivot point is 1918.30
Preferable Price Action: Further upside to 1925.70 and 1930.90.
Alternative Price Action: If the price gives a downside breakout of a pivot, then the price extends to 1911.70 and 1906.80.
Comment: MACD is above 50 level and Pairs above its 20MA & 55MA.
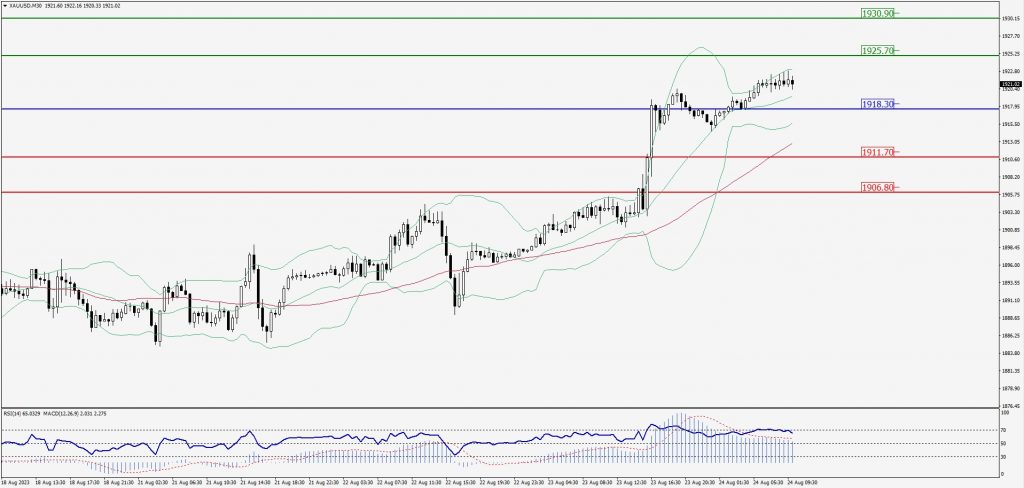
Green Lines Indicate Resistance Levels – Red Lines Indicate Support Levels
Light Blue is a Pivot Point – Black represents the price when the report was produced
Dow Jones Intraday: In a consolidation zone
Our pivot point is 34,512.00
Preferable Price Action: Take sell positions below the pivot with targets at 34,427.00 & 34,370.00.
Alternative Price Action: Above 34,512.00 looks for further upside to 34,596.00 & 34,658.00.
Comment: RSI is at 50 levels and Pairs below 20MA.
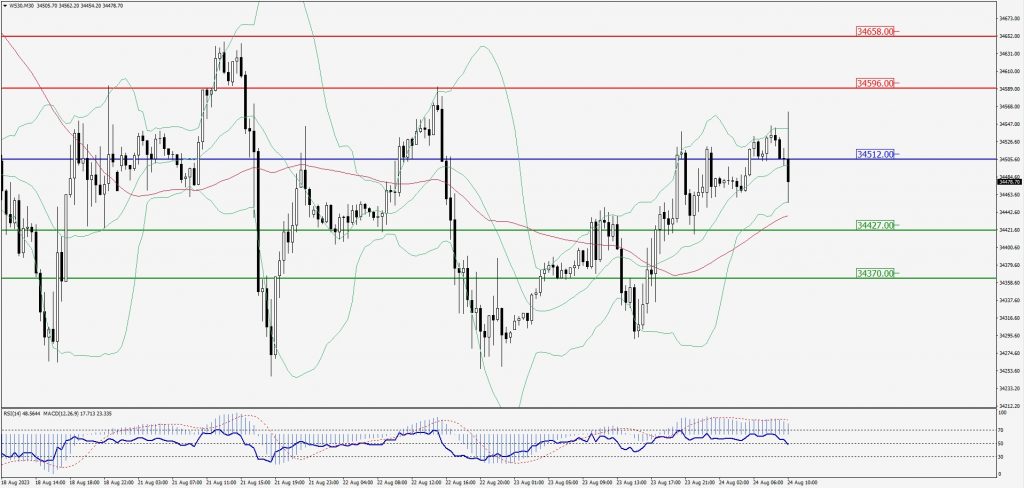
Green Lines Indicate Resistance Levels – Red Lines Indicate Support Levels
Light Blue is a Pivot Point – Black represents the price when the report was produced