Market Wrap: Stocks, Bonds, Commodities
Wall Street ended Tuesday lower as the eve of a US Federal Reserve meeting expected to bring another large interest rate hike brought further evidence of the impact on corporate America from the inflation that the US central bank wants to tame.
The Dow Jones Industrial Average fell 313.45 points to 30,706.23, the S&P 500 lose 43.96 points to 3,855.93 and the Nasdaq Composite subtract 109.97 points to 11,425.05.
MSCI’s index of Asia-Pacific stocks outside Japan is drop 1.31% to 698.88 levels. Australian index lower 1.56% to 6,700.20. Japanese Nikkei Index drop 1.36% to 27,313.13.
European stocks were negative on Wednesday, with the Stoxx Europe 50 Index fell 0.10% to 3,463.65, Germany’s DAX drop 0.21% to 12,644.83, and France’s CAC subtract 0.08% to 5,975.38, and U.K.’s FTSE 100 surged 0.60% to 7,236.05.
Benchmark 10-year U.S. Treasury fell as demand for safe assets ascend again, today 10-year bond yields a negative 1.37% to 3.5240.
Oil prices slid on Wednesday, extending the previous day’s losses, as investors braced for another aggressive interest rate hike from the US Federal Reserve that they fear could lead to recession and plunging fuel demand.
Spot Brent crude oil add 2.57% to $92.97 per barrel. US West Texas Intermediate crude is up 2.64% to $86.14 a barrel.
The yellow metal gold is advance 0.46% to 1,678.75 dollars per ounce.
Market Wrap: Forex
The U.S. dollar rose in early European trading Wednesday, climbing near a 20-year high as Russian President Vladimir Putin raised tensions over Ukraine, and traders awaited another substantial Federal Reserve interest rate hike.
Today, the U.S. dollar index measures the Greenback against a trade-weighted basket of six major currencies, which is rose 0.51% to 110.490.
The Euro US Dollar (EUR/USD) is a widely traded pair that is down 0.69% today. This left the pair trading around $0.99010.
The Japanese yen was positive against the U.S. dollar on Wednesday as the stock up. Today USD/JPY is ascend 0.07% to 143.810 level.
Another commodity-related currency negative against the U.S dollar, AUD/USD slipped 0.34% to 0.66680, and NZD/USD down 0.03 to 0.58870 level.
EUR/USD Intraday: Trend on the downside
Our pivot point is at 0.99410
Preferable Price Action: Take sell positions below pivot level with targets at 0.98700 & 0.98180 in extension.
Alternative Price Action: Above pivot looks for a further upside to 0.99950 & 1.00420.
Comment: RSI below 50 levels and Pairs below its 20MA & 55MA.
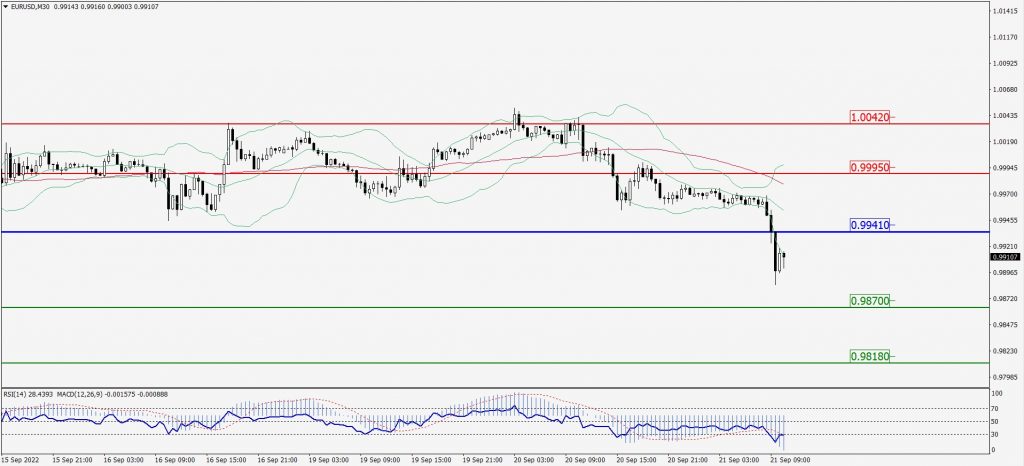
Green Lines Indicate Resistance Levels – Red Lines Indicate Support Levels
Light Blue is a Pivot Point – Black represents the price when the report was produced
GBP/USD Intraday: Trend on the downside
Our pivot point is at 1.13610
Preferable Price Action: Sell positions below pivot with targets at 1.12830 & 1.12240 in extension.
Alternative Price Action: The price above pivot would call for further upside to 1.14250 & 1.14760.
Comment: RSI below 50 levels and Pairs below its 20MA & 55MA.
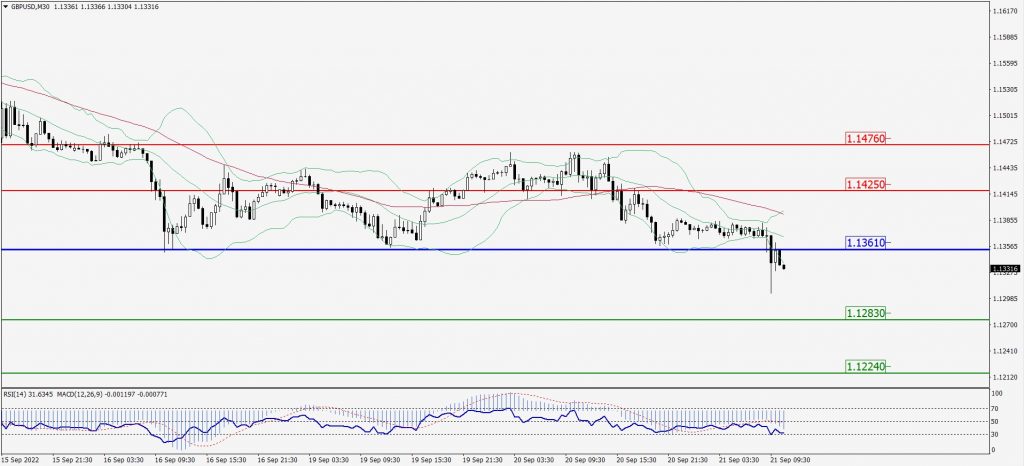
Green Lines Indicate Resistance Levels – Red Lines Indicate Support Levels
Light Blue is a Pivot Point – Black represents the price when the report was produced
USD/JPY Intraday: Trend on the upside
Our pivot point is at 143.680
Preferable Price Action: Buy position above pivot with the target at 144.300 and 144.760 in extension.
Alternative Price Action: The downside breakout of the pivot would call for 143.130 and 142.740.
Comment: MACD is positive territory and Pairs above its 20MA & 55MA.
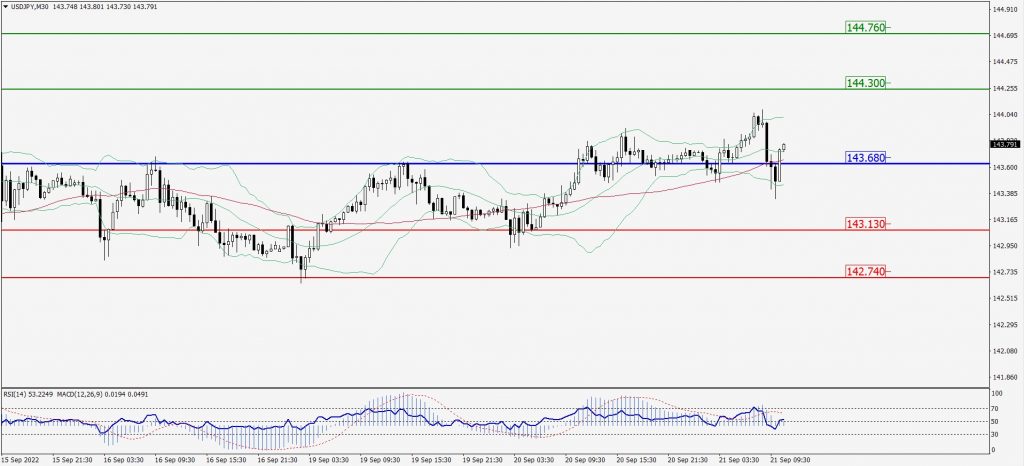
Green Lines Indicate Resistance Levels – Red Lines Indicate Support Levels
Light Blue is a Pivot Point – Black represents the price when the report was produced
AUD/USD Intraday: Resistance level at 0.66800
Our pivot point is at 0.66800
Preferable Price Action: Sell Positions below pivot with targets at 0.66360 & 0.66050 in extension.
Alternative Price Action: Above pivot looks for a further upside with 0.67170 & 0.67450 as targets.
Comment: RSI below 50 levels and Pairs below its 20MA & 55MA.
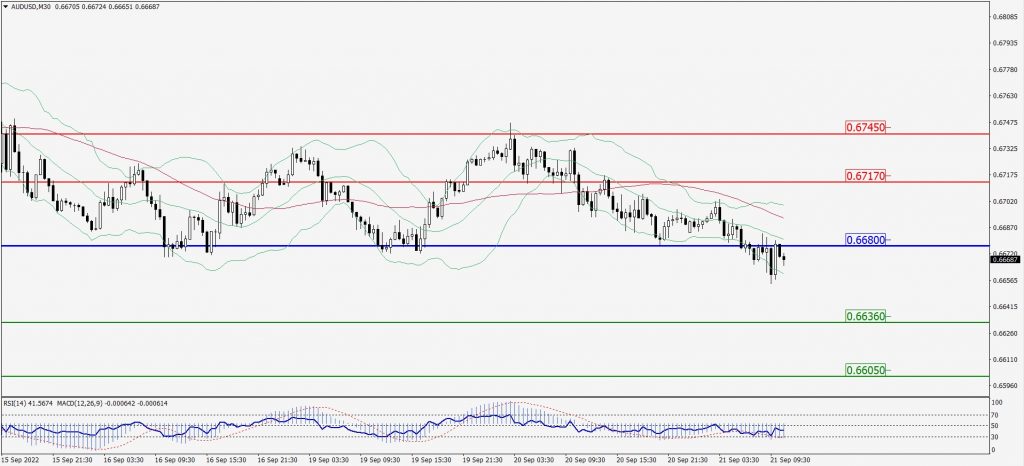
Green Lines Indicate Resistance Levels – Red Lines Indicate Support Levels
Light Blue is a Pivot Point – Black represents the price when the report was produced
CRUDEOIL Intraday: Major trend on the upside
Our pivot point is at 85.88
Preferable Price Action: Above pivots buy oil with 87.74 & 89.10 as targets.
Alternative Price Action: Sell crude below pivot with targets at 84.18 and 82.83 in extension.
Comment: MACD is in the positive territory and Pairs above its 20MA & 55MA.
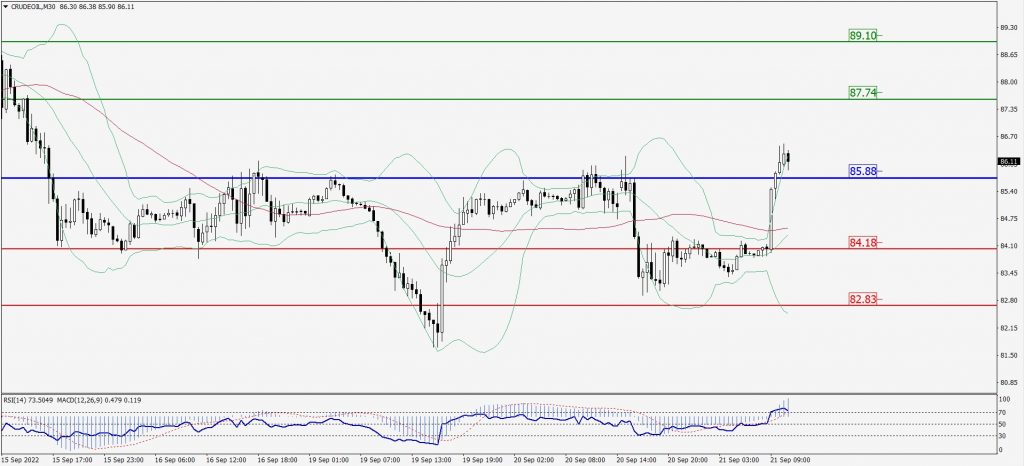
Green Lines Indicate Resistance Levels – Red Lines Indicate Support Levels
Light Blue is a Pivot Point – Black represents the price when the report was produced
XAU/USD Intraday: Trend on the upside
Our pivot point is 1666.60
Preferable Price Action: Further upside to 1680.00 and 1689.90
Alternative Price Action: If the price gives a downside breakout of a pivot, then the price extends to 1654.60 and 1644.80.
Comment: MACD is positive territory and Pairs above its 20MA & 55MA.
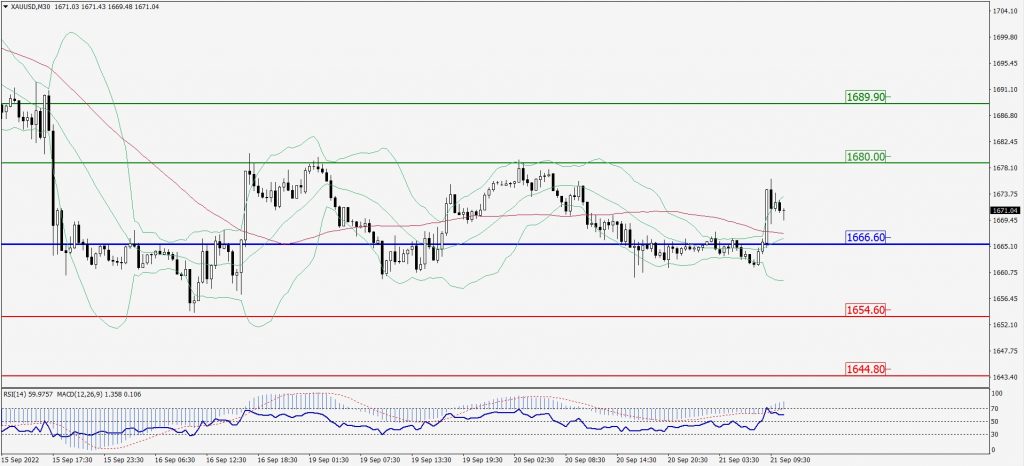
Green Lines Indicate Resistance Levels – Red Lines Indicate Support Levels
Light Blue is a Pivot Point – Black represents the price when the report was produced
Dow Jones Intraday: In a consolidation zone
Our pivot point is 30,791.00
Preferable Price Action: Take sell positions below pivot with targets at 30,584.00 & 30,441.00.
Alternative Price Action: Above 30,791.00 looks for further upside to 30,972.00 & 31,137.00.
Comment: RSI below 50 levels and Pairs below 55MA.
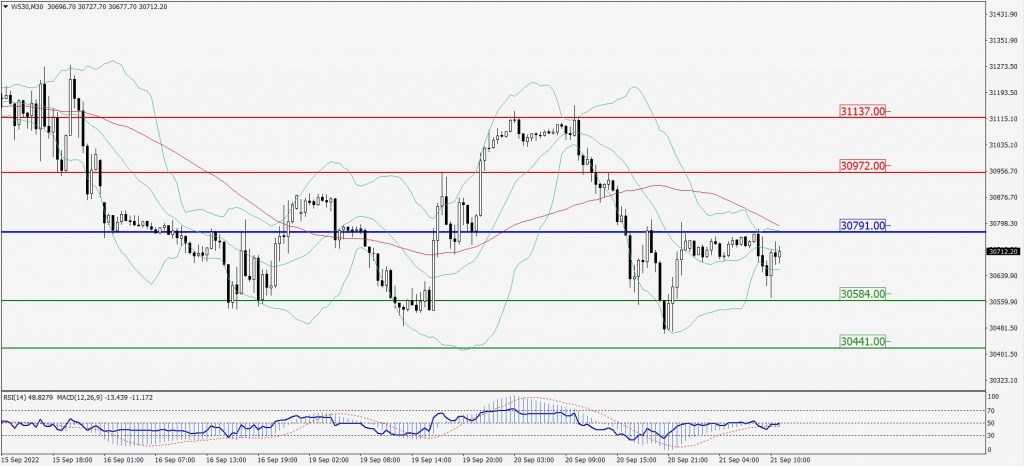
Green Lines Indicate Resistance Levels – Red Lines Indicate Support Levels
Light Blue is a Pivot Point – Black represents the price when the report was produced