Market Wrap: Stocks, Bonds, Commodities
US stocks jumped on Monday after a deal to rescue Credit Suisse and central bank efforts to bolster confidence in the financial system relieved investors, while participants also weighed the likelihood of a pause in rate hikes from the Federal Reserve this week.
The Dow Jones Industrial Average rose 382.60 points to 32,244.58, the S&P 500 gain 0.89% to 3,951.57 and the Nasdaq Composite add 45.03 points to 11,675.54.
MSCI’s index of Asia-Pacific stocks outside Japan is advance 1.14% to 620.12 levels. The Australian index was higher by 0.82% to 6,955.40. Japanese Nikkei Index decline 1.42% today.
European stocks were positive on Tuesday, with the Stoxx Europe 50 Index rose 1.47% to 4,179.95, Germany’s DAX advance 1.32% to 14,724.05, and France’s CAC ascend 1.33% to 7,100.57, and U.K.’s FTSE 100 add 1.20% to 7,492.50.
Benchmark 10-year U.S. Treasury fell as demand for safe assets ascend again, today 10-year bond yields are positive 0.49% to 3.4940.
Oil prices rebounded and rose over 1% on Monday after diving to their lowest levels in 15 months as the market worried that risks in the global banking sector could spark a recession that would sap fuel demand
Spot Brent crude oil ascend 0.91% to $74.44 per barrel. US West Texas Intermediate crude is up 0.96% to $68.47 a barrel.
The yellow metal gold is decline 0.71% to 1,968.95 dollars per ounce.
Market Wrap: Forex
The U.S. dollar edged higher in early European trade Tuesday but has struggled to climb much above recent five-week lows ahead of the start of the latest Federal Reserve policy-setting meeting.
Today, the U.S. dollar index measures the Greenback against a trade-weighted basket of six major currencies, which surged 0.09% to 103.020.
The Euro US Dollar (EUR/USD) is a widely traded pair that is up 0.11% today. This left the pair trading around $1.07310.
The Japanese yen was negative against the U.S. dollar on Tuesday. Today USD/JPY is surged 0.70% to the 132.240 level.
Another commodity-related currency negative against the U.S dollar, AUD/USD fell 0.58% to 0.66800, and NZD/USD slipped 0.82% to 0.61950 level.
EUR/USD Intraday: Support level at 1.07090
Our pivot point is at 1.07090
Preferable Price Action: Take buy positions above pivot level with targets at 1.07530 & 1.07820 in extension.
Alternative Price Action: Below pivot looks for a further downside to 1.06710 & 1.06450.
Comment: RSI is above 50 levels and Pairs above 55MA.
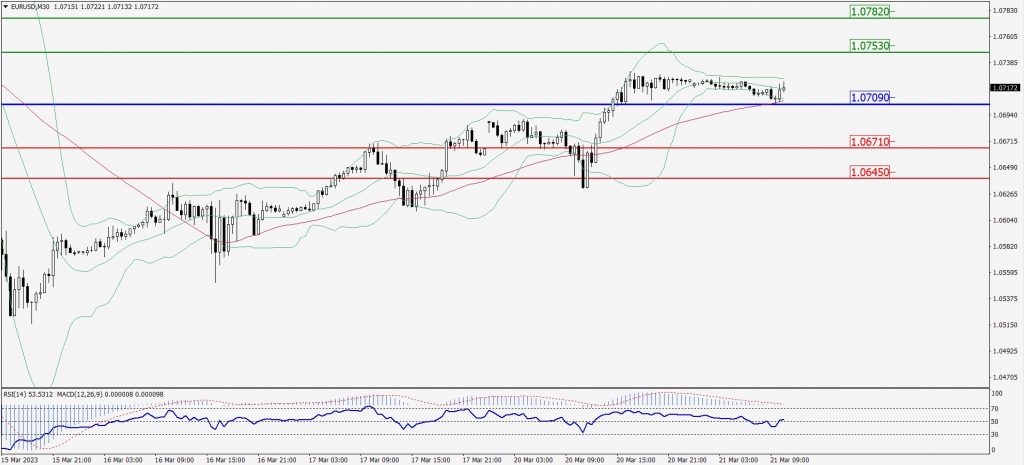
Green Lines Indicate Resistance Levels – Red Lines Indicate Support Levels
Light Blue is a Pivot Point – Black represents the price when the report was produced
GBP/USD Intraday: Trend on the downside
Our pivot point is at 1.22700
Preferable Price Action: Sell positions below pivot with targets at 1.22140 & 1.21780 in extension.
Alternative Price Action: The price above pivot would call for further upside to 1.23140 & 1.23490.
Comment: RSI is below 50 levels and Pairs below 20MA.
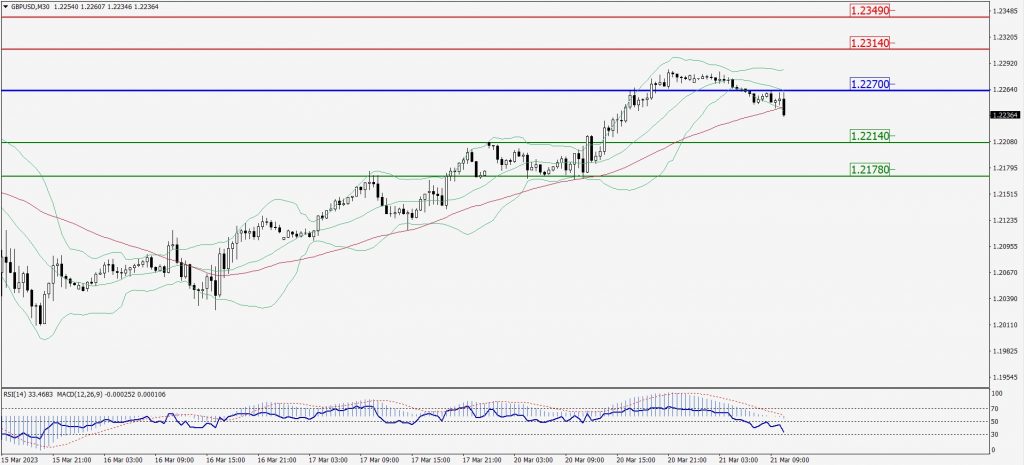
Green Lines Indicate Resistance Levels – Red Lines Indicate Support Levels
Light Blue is a Pivot Point – Black represents the price when the report was produced
USD/JPY Intraday: Trend on the upside
Our pivot point is at 131.560
Preferable Price Action: Buy position above pivot with the target at 132.320 and 132.790 in extension.
Alternative Price Action: The downside breakout of the pivot would call for 130.950 and 130.500.
Comment: MACD is above 50 level and Pairs above its 20MA & 55MA.
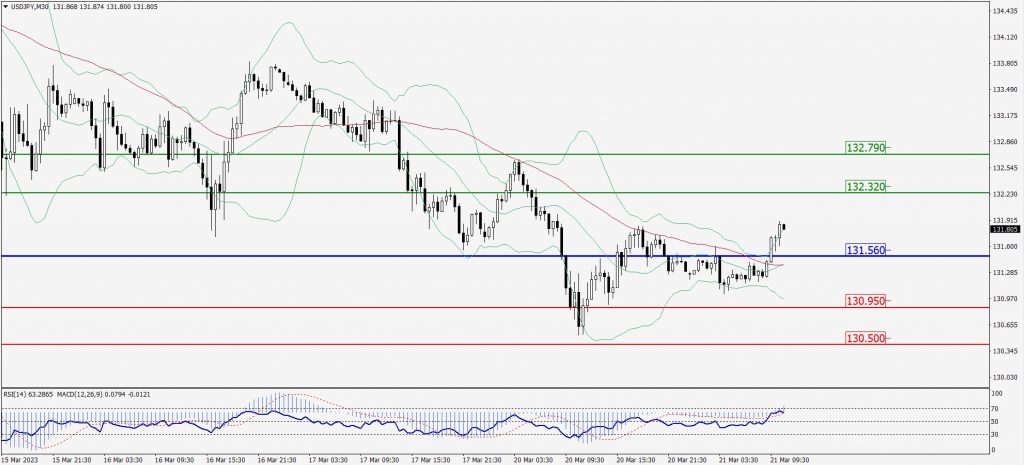
Green Lines Indicate Resistance Levels – Red Lines Indicate Support Levels
Light Blue is a Pivot Point – Black represents the price when the report was produced
AUD/USD Intraday: Trend on the downside
Our pivot point is at 0.67090
Preferable Price Action: Sell positions below pivot with targets at 0.66760 & 0.66550 in extension.
Alternative Price Action: Above pivot looks for a further upside with 0.67340 & 0.67550 as targets.
Comment: RSI is below 50 levels and pairs below its 20MA & 55MA.
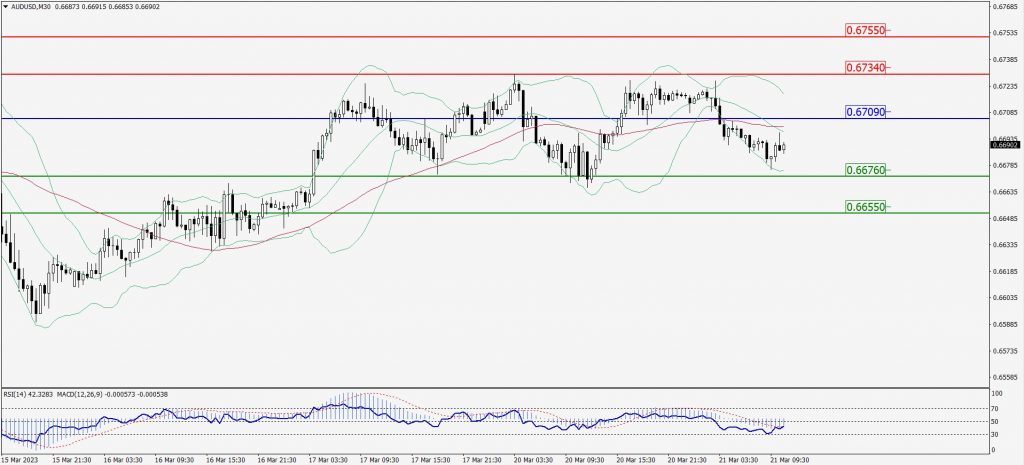
Green Lines Indicate Resistance Levels – Red Lines Indicate Support Levels
Light Blue is a Pivot Point – Black represents the price when the report was produced
CRUDEOIL Intraday: In a consolidation zone
Our pivot point is at 66.80
Preferable Price Action: Above pivot buy oil with 68.03 & 68.97 as targets.
Alternative Price Action: Sell crude below pivot with targets at 65.78 and 64.96 in extension.
Comment: MACD is flat territory and Pairs above 55MA.
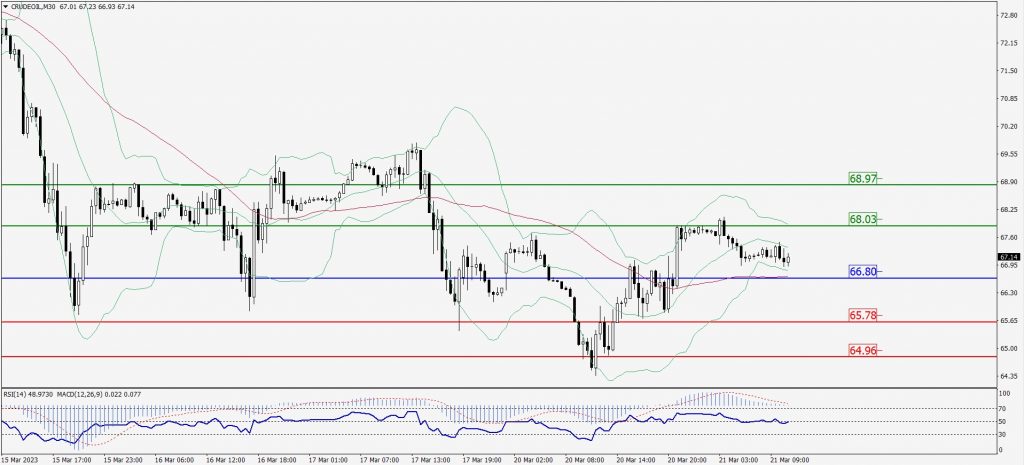
Green Lines Indicate Resistance Levels – Red Lines Indicate Support Levels
Light Blue is a Pivot Point – Black represents the price when the report was produced
XAU/USD Intraday: Trend on the downside
Our pivot point is 1979.20
Preferable Price Action: Further downside to 1961.20 and 1948.10
Alternative Price Action: If the price gives an upside breakout of a pivot, then the price extends to 1998.90 and 2011.70.
Comment: MACD is below 50 level and Pairs below its 20MA & 55MA.
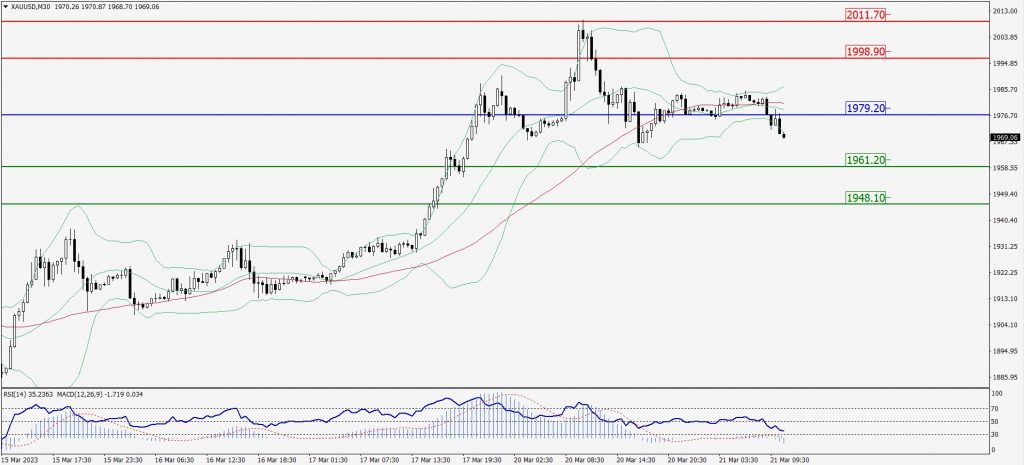
Green Lines Indicate Resistance Levels – Red Lines Indicate Support Levels
Light Blue is a Pivot Point – Black represents the price when the report was produced
Dow Jones Intraday: Trend on the upside
Our pivot point is 32,217.00
Preferable Price Action: Take buy positions above the pivot with targets at 32,440.00 & 32,598.00.
Alternative Price Action: Below 32,217.00 looks for further downside to 32,024.00 & 31,889.00.
Comment: RSI is above 50 levels and Pairs above its 20MA & 55MA.
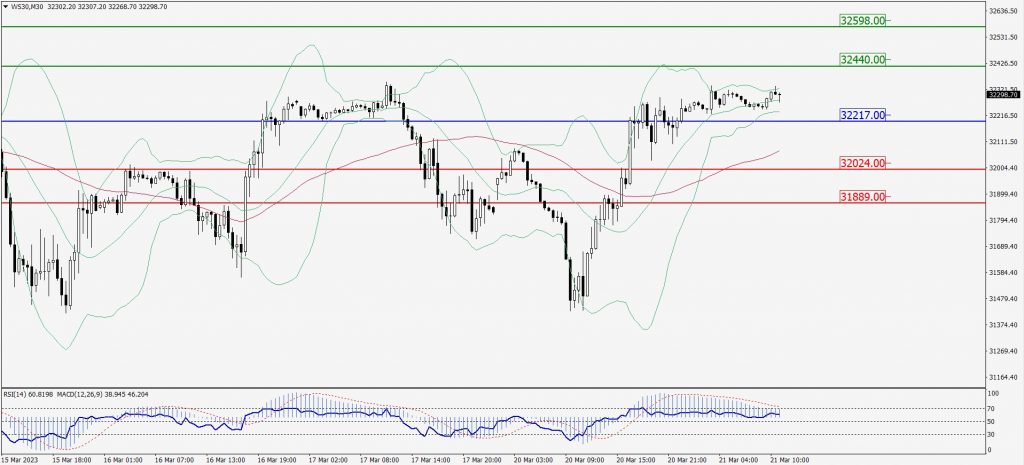
Green Lines Indicate Resistance Levels – Red Lines Indicate Support Levels
Light Blue is a Pivot Point – Black represents the price when the report was produced