Market Wrap: Stocks, Bonds, Commodities
US stocks closed lower on Wednesday after an abrupt mid-afternoon nosedive ended Wall Street’s impressive rally, which had been driven by falling interest rates and the Federal Reserve’s dovish turn.
The Dow Jones Industrial Average fell 475.92 points to 37,082.00, the S&P 500 lose 1.47% to 4,698.35 and the Nasdaq Composite subtract 225.28 points to 14,777.94.
MSCI’s index of Asia-Pacific stocks outside Japan is decline 0.19% to 621.94 levels. The Australian index was lower by 0.45% to 7,504.10. Japanese Nikkei Index drop 1.62% today.
European stocks were mixed on Thursday, with the Stoxx Europe 50 Index fell 0.03% to 4,534.15, Germany’s DAX drop 0.07% to 16,733.05, and France’s CAC advance 0.12% to 7,583.43 and U.K.’s FTSE 100 add 1.02% to 7,715.68.
Benchmark 10-year U.S. Treasury fell as deman for safe assets ascend again, today 10-year bond yields positive 0.13% to 3.8830.
Oil prices settled slightly higher after a choppy trading session on Wednesday as investors worried about global trade disruption and tensions in the Middle East following attacks on ships by Yemen’s Iran-aligned Houthi forces in the Red Sea.
Spot Brent crude oil ascend 0.03% to $79.72 per barrel. US West Texas Intermediate crude is down 0.03% to $74.20 a barrel.
The yellow metal gold is decline 0.06% to 2,046.50 dollars per ounce.
Market Wrap: Forex
The dollar found a footing on Thursday as a sudden end to a strong rally for US stocks had investors looking for safety and as an unexpected fall in British inflation hit the pound.
Today, the U.S. dollar index measures the Greenback against a trade-weighted basket of six major currencies, which slipped 0.04% to 102.000.
The Euro US Dollar (EUR/USD) is a widely traded pair that is up 0.08% today. This left the pair trading around $1.09470.
The Japanese yen was negative against the U.S. dollar on Thursday. Today USD/JPY is slipped 0.26% to the 143.190 level.
Another commodity-related currency mixed against the U.S dollar, AUD/USD rose 0.22% to 0.67440, and NZD/USD slipped 0.06% to 0.62410 level.
EUR/USD Intraday: Trend on the downside
Preferable Price Action: Take sell positions below pivot level with targets at 1.09300 & 1.09100 in extension.
Alternative Price Action: Above pivot looks for a further upside to 1.09950 & 1.10160.
Comment: RSI is below 50 levels and Pairs below 55MA.
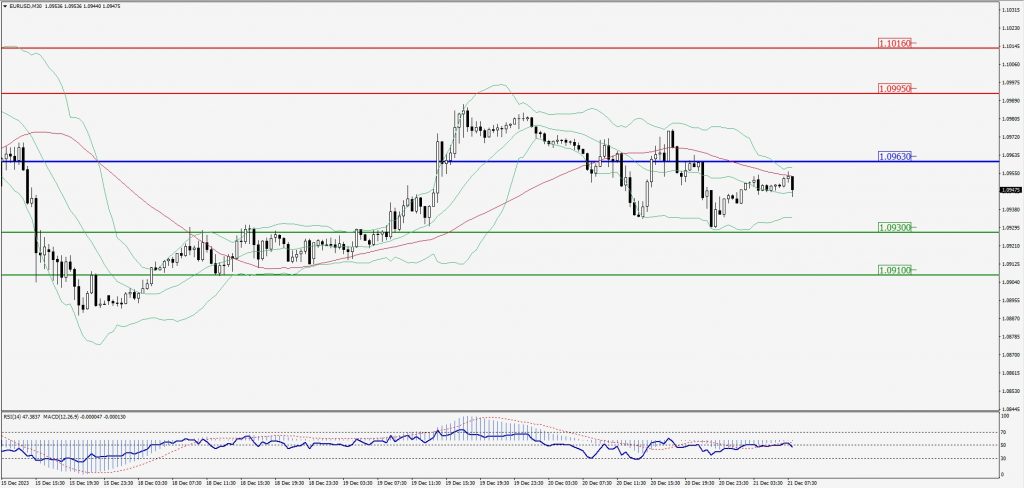
Green Lines Indicate Resistance Levels – Red Lines Indicate Support Levels
Light Blue is a Pivot Point – Black represents the price when the report was produced
GBP/USD Intraday: Resistance level at 1.26530
Our pivot point is at 1.26530
Preferable Price Action: Sell positions below pivot with targets at 1.26150 & 1.25940 in extension.
Alternative Price Action: The price above pivot would call for further upside to 1.26820 & 1.27060.
Comment: RSI is below 50 levels and Pairs below 55MA.
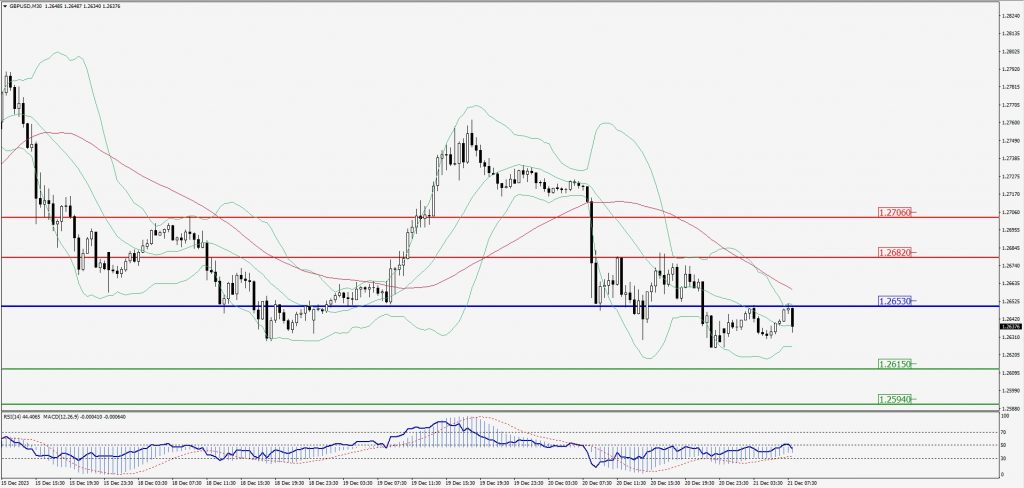
Green Lines Indicate Resistance Levels – Red Lines Indicate Support Levels
Light Blue is a Pivot Point – Black represents the price when the report was produced
USD/JPY Intraday: Trend on the downside
Our pivot point is at 143.390
Preferable Price Action: Sell position below pivot with the target at 142.750 and 142.400 in extension.
Alternative Price Action: The upside breakout of the pivot would call for 143.950 and 144.370.
Comment: MACD is below 50 level and Pairs below 55MA.
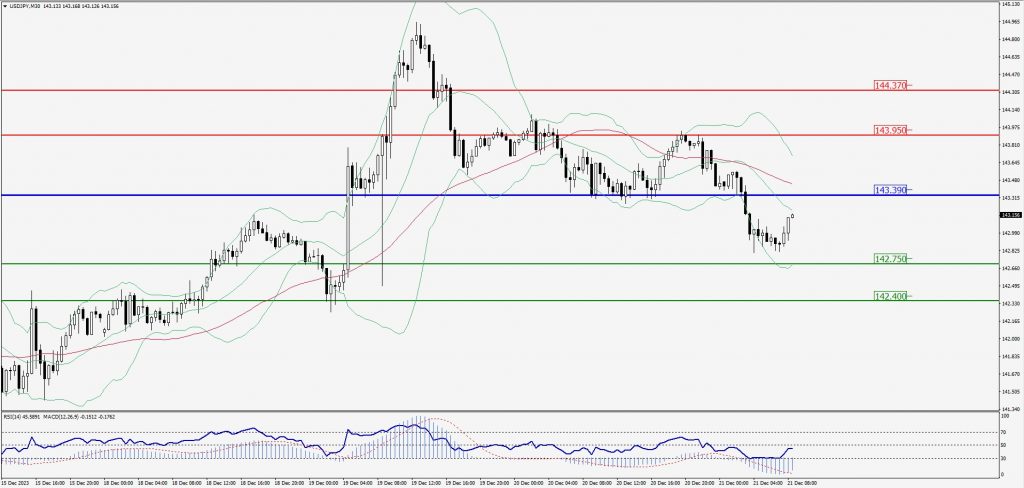
Green Lines Indicate Resistance Levels – Red Lines Indicate Support Levels
Light Blue is a Pivot Point – Black represents the price when the report was produced
AUD/USD Intraday: In a consolidation zone
Our pivot point is at 0.67540
Preferable Price Action: Sell positions below pivot with targets at 0.67370 & 0.67260 in extension.
Alternative Price Action: Above pivot looks for a further upside with 0.67710 & 0.67820 as targets.
Comment: RSI is at 50 levels and Pairs below 55MA.
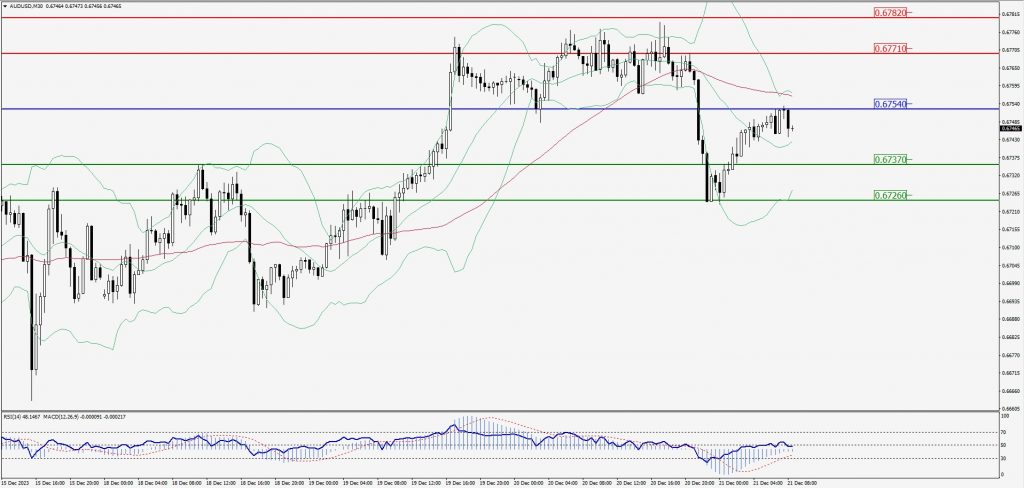
Green Lines Indicate Resistance Levels – Red Lines Indicate Support Levels
Light Blue is a Pivot Point – Black represents the price when the report was produced
CRUDEOIL Intraday: Support level at 73.96
Our pivot point is at 73.96
Preferable Price Action: Above pivot buy oil with 74.72 & 75.27 as targets.
Alternative Price Action: Sell crude below pivot with targets at 73.32 and 72.85 in extension.
Comment: MACD is positive territory and Pairs above 20MA.
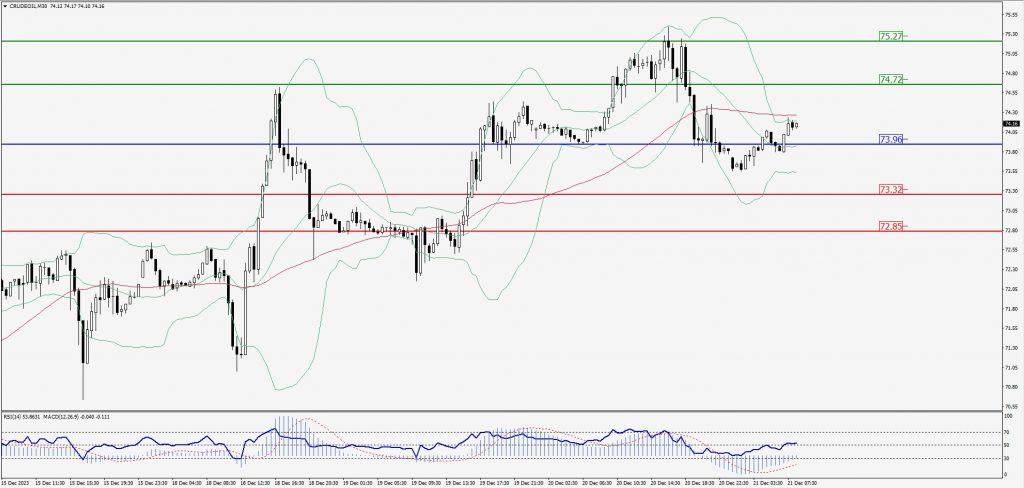
Green Lines Indicate Resistance Levels – Red Lines Indicate Support Levels
Light Blue is a Pivot Point – Black represents the price when the report was produced
XAU/USD Intraday: Trend on the upside
Our pivot point is 2034.50
Preferable Price Action: Further upside to 2040.40 and 2044.20.
Alternative Price Action: If the price gives a downside breakout of a pivot, then the price extends to 2029.60 and 2026.40.
Comment: MACD is above 50 level and Pairs above 20MA.
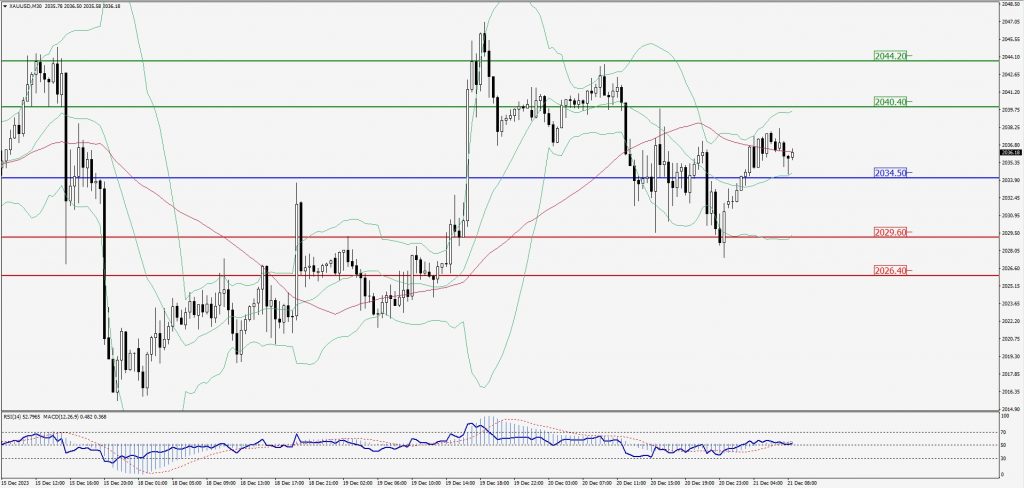
Green Lines Indicate Resistance Levels – Red Lines Indicate Support Levels
Light Blue is a Pivot Point – Black represents the price when the report was produced
Dow Jones Intraday: Trend on the downside
Our pivot point is 37,261.00
Preferable Price Action: Take sell positions below the pivot with targets at 37,139.00 & 37,066.00.
Alternative Price Action: Above 37,261.00 looks for further upside to 37,370.00 & 37,448.00.
Comment: RSI is below 50 levels and Pairs below 55MA.
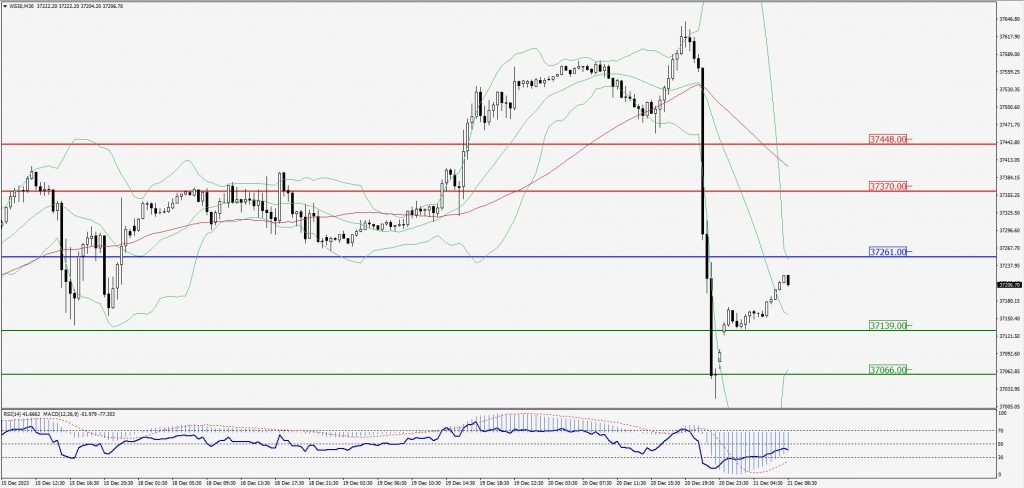
Green Lines Indicate Resistance Levels – Red Lines Indicate Support Levels
Light Blue is a Pivot Point – Black represents the price when the report was produced