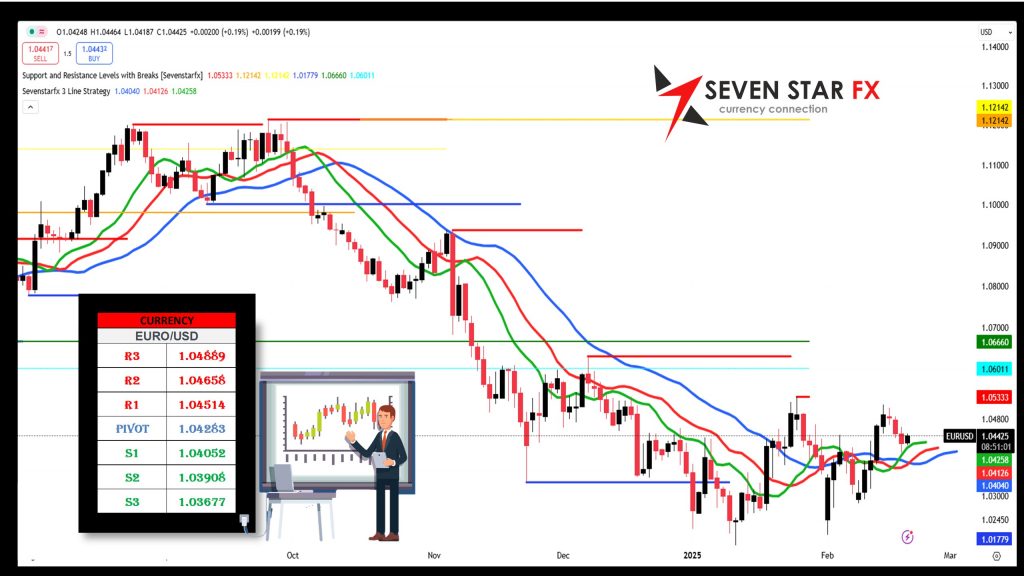
EUR/USD DAILY MARKET REPORT
📅 Date: February 20, 2025
💰 Currency Pair: EUR/USD
🎯 Current Pivot Points:
- Resistance Levels: R3: 1.04889 | R2: 1.04658 | R1: 1.04514
- Pivot Level: 1.04283
- Support Levels: S1: 1.04052 | S2: 1.03908 | S3: 1.03677
📌 Fundamental Analysis Summary
1️⃣ European Central Bank (ECB) Policy & Economic Outlook:
- The ECB remains cautious regarding rate cuts, with policymakers closely watching inflation trends.
- Recent Eurozone GDP data showed moderate economic slowdown, but core inflation remains sticky.
- Market expectations suggest a possible ECB rate cut later in 2025, which could impact EUR sentiment.
2️⃣ US Federal Reserve & Dollar Strength:
- The Federal Reserve is delaying rate cuts, supporting USD strength in the short term.
- Weak US consumer spending and mixed economic data are limiting the upside for the dollar.
- Risk sentiment in the market is mixed, affecting EUR/USD volatility.
3️⃣ Geopolitical & Market Impact:
- US-EU trade discussions continue, adding uncertainty to EUR/USD movements.
- Global risk appetite remains fragile, influencing safe-haven flows into the USD.
📊 Fibonacci Analysis
- Key Retracement Levels (from recent high to low):
- 38.2% Level: 1.04400
- 50.0% Level: 1.04550
- 61.8% Level: 1.04700
- Market Implication:
- If EUR/USD remains above 1.04283 (Pivot Level), a move toward the 50% or 61.8% Fibonacci level is expected.
- A break below 1.04052 (S1) could lead to deeper losses toward S2 and S3 levels.
📈 Bollinger Bands Analysis
- Current Setup:
- EUR/USD is trading near the middle Bollinger Band, suggesting a neutral to slightly bullish bias.
- The upper band at 1.04750 acts as resistance, while the lower band at 1.03850 serves as support.
- Market Implication:
- A break above 1.04550 could trigger further upside towards 1.04750.
- A break below 1.03850 may indicate a bearish continuation.
📉 Elliott Wave Analysis
- Wave Count:
- EUR/USD appears to be in a corrective phase (Wave 4) before a potential bullish continuation.
- If the price stays above 1.04250, we could see Wave 5 targeting 1.04650 – 1.04850.
- A break below 1.03900 could signal an extended correction.
⚠️ Disclaimer:
📢 Forex trading is highly volatile and involves significant risk. This report is for educational purposes only. Any financial losses from trading based on this analysis are not our responsibility. Always use proper risk management.
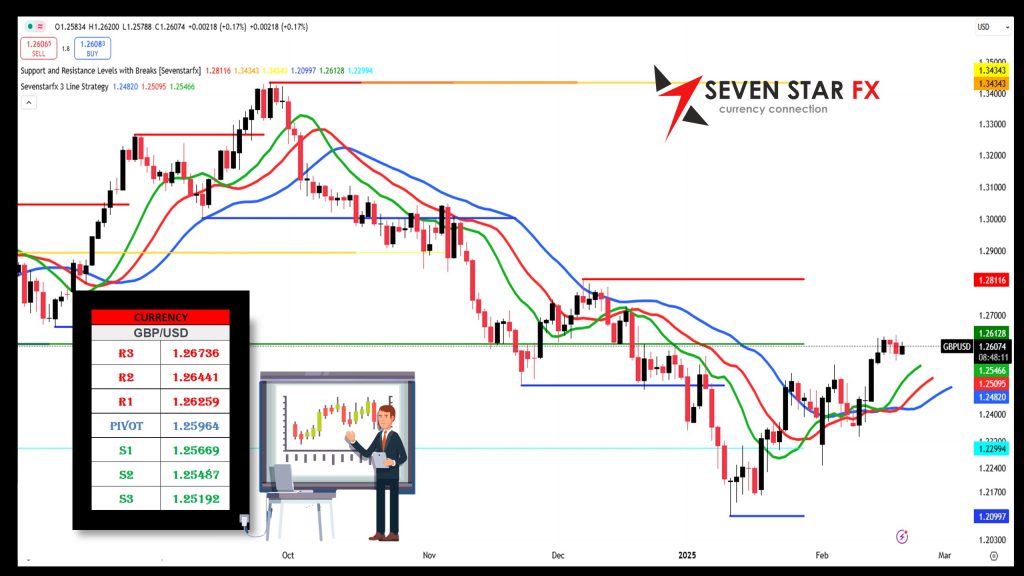
GBP/USD DAILY MARKET REPORT
📅 Date: February 20, 2025
💰 Currency Pair: GBP/USD
🎯 Current Pivot Points:
- Resistance Levels: R3: 1.24315 | R2: 1.24357 | R1: 1.24384
- Pivot Level: 1.24427
- Support Levels: S1: 1.24469 | S2: 1.24496 | S3: 1.24539
📌 Fundamental Analysis Summary
1️⃣ Bank of England (BoE) Policy & UK Economic Outlook:
- The Bank of England (BoE) remains cautious on interest rate cuts despite signs of slowing inflation.
- Recent UK inflation data showed slight easing, but wage growth remains strong, keeping the BoE in a hawkish stance.
- GDP figures for the UK indicate modest economic recovery, preventing further downside in GBP.
2️⃣ US Federal Reserve & Market Sentiment:
- The Federal Reserve’s latest statements suggest a delayed rate cut, pushing some support for the USD.
- However, weak US retail sales and inflation expectations are keeping USD gains limited.
3️⃣ Geopolitical & Market Impact:
- Brexit-related trade issues with the EU continue to create some uncertainty for GBP.
- Risk appetite remains mixed, impacting GBP/USD volatility.
📊 Fibonacci Analysis
- Key Retracement Levels (from recent high to low):
- 38.2% Level: 1.24400
- 50.0% Level: 1.24450
- 61.8% Level: 1.24490
- Market Implication:
- If GBP/USD stays above 1.24427 (Pivot Level), an attempt toward the 50% or 61.8% Fibonacci level is likely.
- A drop below 1.24469 (S1) may lead to further bearish pressure toward S2 and S3 levels.
📈 Bollinger Bands Analysis
- Current Setup:
- GBP/USD is trading near the lower Bollinger Band, indicating potential oversold conditions.
- The upper band at 1.24550 acts as resistance, while the lower band at 1.24300 serves as support.
- Market Implication:
- A break above 1.24490 could lead to bullish momentum towards 1.24550.
- A break below 1.24300 could trigger further downside movement.
📉 Elliott Wave Analysis
- Wave Count:
- GBP/USD appears to be in a corrective phase (Wave 4) before another potential bullish leg.
- If GBP/USD holds above 1.24400, we could see Wave 5 pushing towards 1.24550.
- A break below 1.24350 may suggest an extended correction before resuming the uptrend.
⚠️ Disclaimer:
📢 Forex trading is highly volatile and carries significant risk. This report is for educational purposes only. Any financial losses from trading based on this analysis are not our responsibility. Always use proper risk management.
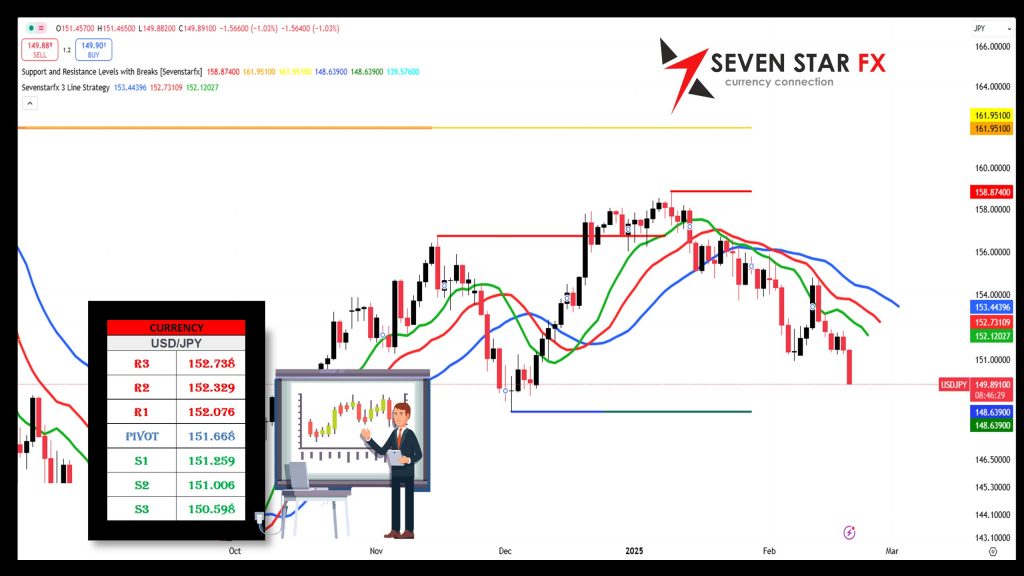
USD/JPY DAILY MARKET REPORT
📅 Date: February 20, 2025
💰 Currency Pair: USD/JPY
🎯 Current Pivot Points:
- Resistance Levels: R3: 152.738 | R2: 152.329 | R1: 152.076
- Pivot Level: 151.668
- Support Levels: S1: 151.259 | S2: 151.006 | S3: 150.598
📌 Fundamental Analysis Summary
1️⃣ Bank of Japan (BoJ) & Interest Rate Outlook:
- The Bank of Japan (BoJ) remains cautious about tightening monetary policy, though speculation continues about a potential shift away from ultra-loose policies in 2025.
- Inflation in Japan remains stable, but BoJ officials are monitoring wage growth before making policy changes.
- Yen weakness continues, as BoJ maintains low interest rates, making JPY less attractive compared to USD.
2️⃣ US Federal Reserve & USD Strength:
- The Federal Reserve has not yet signaled a clear path for rate cuts, leading to continued USD strength.
- Recent US economic data (job reports, inflation) suggest a resilient economy, reducing the urgency for the Fed to cut rates.
- Stronger USD demand is keeping USD/JPY elevated.
3️⃣ Geopolitical & Market Impact:
- The risk-off sentiment in global markets is causing safe-haven demand for both USD and JPY, leading to mixed movements.
- Any major shifts in Fed or BoJ policies could trigger large moves in USD/JPY.
📊 Fibonacci Analysis
- Key Retracement Levels (from recent high to low):
- 38.2% Level: 151.900
- 50.0% Level: 152.050
- 61.8% Level: 152.200
- Market Implication:
- If USD/JPY stays above 151.668 (Pivot Level), a move toward the 50% or 61.8% Fibonacci retracement level is possible.
- A break below 151.259 (S1) could signal a deeper correction.
📈 Bollinger Bands Analysis
- Current Setup:
- USD/JPY is trading near the upper Bollinger Band, indicating overbought conditions.
- The upper band at 152.800 acts as resistance, while the lower band at 150.900 serves as support.
- Market Implication:
- A break above 152.300 may push the pair towards 152.700 or higher.
- A break below 151.200 could trigger further downside.
📉 Elliott Wave Analysis
- Wave Count:
- USD/JPY appears to be in an impulse wave (Wave 5) with further upside potential.
- If the price stays above 151.500, the bullish wave could continue toward 152.500 – 153.000.
- A break below 151.000 could signal a corrective phase.
⚠️ Disclaimer:
📢 Forex trading is highly volatile and involves significant risk. This report is for educational purposes only. Any financial losses from trading based on this analysis are not our responsibility. Always use proper risk management.
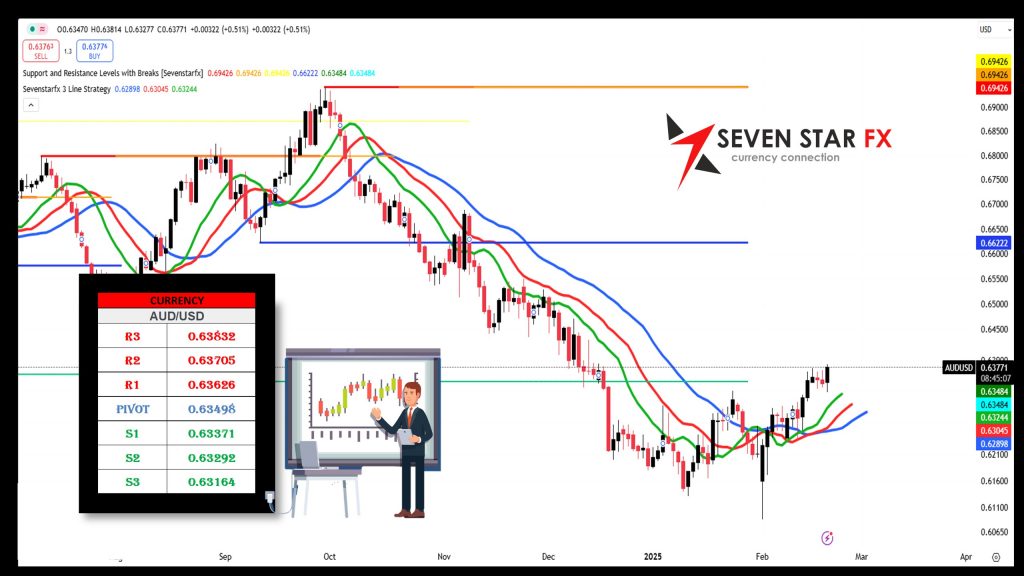
AUD/USD DAILY MARKET REPORT
📅 Date: February 20, 2025
💰 Currency Pair: AUD/USD
🎯 Current Pivot Points:
- Resistance Levels: R3: 0.63832 | R2: 0.63705 | R1: 0.63626
- Pivot Level: 0.63498
- Support Levels: S1: 0.63371 | S2: 0.63292 | S3: 0.63164
📌 Fundamental Analysis Summary
1️⃣ Reserve Bank of Australia (RBA) & Interest Rate Outlook:
- The RBA remains cautious on rate cuts, keeping a neutral stance as inflation shows signs of stabilizing.
- Australian job market data remains strong, preventing aggressive monetary policy easing.
- Any hawkish shift by the RBA could support further gains in AUD.
2️⃣ US Federal Reserve & Market Sentiment:
- The Federal Reserve remains patient on rate cuts, supporting USD strength in the short term.
- Weaker US retail sales data suggest slowing economic growth, limiting USD gains.
- Global market sentiment remains uncertain, impacting risk-sensitive currencies like AUD.
3️⃣ Geopolitical & Market Impact:
- China’s economic performance significantly influences AUD, as China is Australia’s largest trading partner.
- Recent weaker-than-expected Chinese GDP data has weighed on AUD.
- Risk appetite and commodity price movements will continue to drive AUD/USD volatility.
📊 Fibonacci Analysis
- Key Retracement Levels (from recent high to low):
- 38.2% Level: 0.63550
- 50.0% Level: 0.63610
- 61.8% Level: 0.63670
- Market Implication:
- If AUD/USD stays above 0.63498 (Pivot Level), a test of the 50% or 61.8% Fibonacci level is likely.
- A break below 0.63371 (S1) may indicate further downside movement.
📈 Bollinger Bands Analysis
- Current Setup:
- AUD/USD is trading near the lower Bollinger Band, indicating oversold conditions.
- The upper band at 0.63850 acts as resistance, while the lower band at 0.63200 serves as support.
- Market Implication:
- A break above 0.63600 could signal a recovery towards 0.63750 – 0.63800.
- A break below 0.63250 may trigger further downside pressure.
📉 Elliott Wave Analysis
- Wave Count:
- AUD/USD appears to be in a corrective phase (Wave 4) before a potential bullish continuation.
- If the price remains above 0.63450, the next Wave 5 could push the pair toward 0.63700 – 0.63800.
- A break below 0.63250 could lead to a deeper correction.
⚠️ Disclaimer:
📢 Forex trading is highly volatile and involves significant risk. This report is for educational purposes only. Any financial losses from trading based on this analysis are not our responsibility. Always use proper risk management.
CRUDE OIL DAILY MARKET REPORT
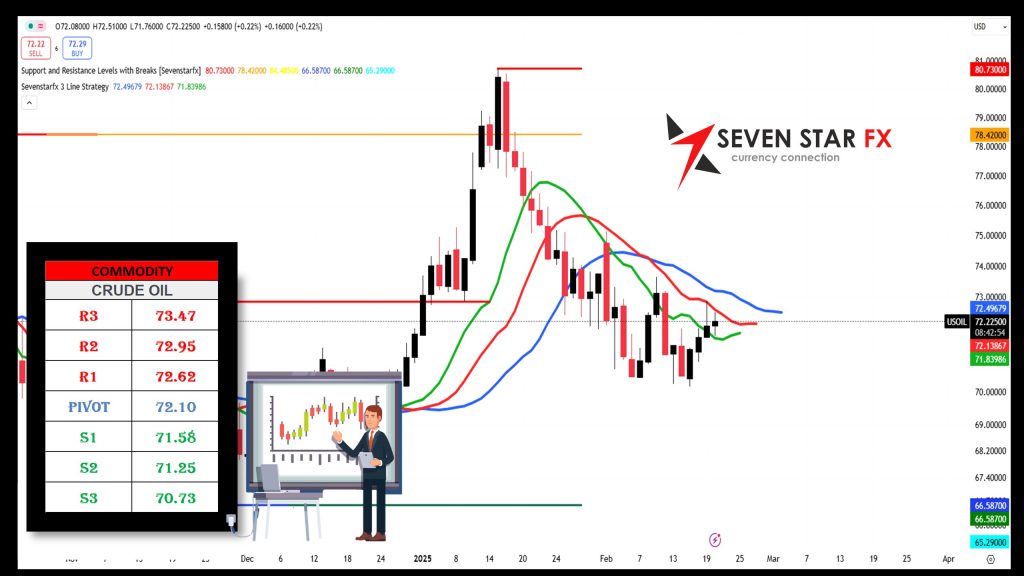
📅 Date: February 20, 2025
💰 Commodity: Crude Oil (WTI)
🎯 Current Pivot Points:
- Resistance Levels: R3: 73.47 | R2: 72.95 | R1: 72.62
- Pivot Level: 72.10
- Support Levels: S1: 71.58 | S2: 71.25 | S3: 70.73
📌 Fundamental Analysis Summary
1️⃣ Supply & Demand Factors:
- OPEC+ continues production cuts, limiting global supply and supporting prices.
- US crude oil inventories showed a slight build-up, indicating weaker demand.
- Geopolitical tensions in the Middle East remain a key driver for price volatility.
2️⃣ Macroeconomic Factors:
- The Federal Reserve’s policy stance affects oil prices through USD strength.
- A stronger USD makes oil more expensive for international buyers, potentially capping gains.
- China’s economic outlook remains uncertain, impacting global demand forecasts.
3️⃣ Market Sentiment & Risk Factors:
- Rising global inflation concerns may impact energy demand.
- Hedge funds & institutional investors are adjusting positions, increasing short-term volatility.
📊 Fibonacci Analysis
- Key Retracement Levels (from recent high to low):
- 38.2% Level: 72.30
- 50.0% Level: 72.60
- 61.8% Level: 72.90
- Market Implication:
- If crude oil stays above 72.10 (Pivot Level), a test of the 50% or 61.8% Fibonacci retracement level is possible.
- A break below 71.58 (S1) may lead to further downside pressure.
📈 Bollinger Bands Analysis
- Current Setup:
- Crude oil is trading near the middle Bollinger Band, suggesting a neutral to slightly bullish trend.
- The upper band at 73.50 acts as resistance, while the lower band at 70.80 serves as support.
- Market Implication:
- A break above 72.95 could trigger a move towards 73.50 or higher.
- A break below 71.50 may indicate further bearish momentum.
📉 Elliott Wave Analysis
- Wave Count:
- Crude oil appears to be in a corrective phase (Wave 4) after a recent uptrend.
- If the price remains above 72.00, the next Wave 5 could push crude toward 73.50 – 74.00.
- A break below 71.25 could indicate an extended correction.
⚠️ Disclaimer:
📢 Crude oil trading is highly volatile and involves significant risk. This report is for educational purposes only. Any financial losses from trading based on this analysis are not our responsibility. Always use proper risk management.
Would you like me to include trading recommendations or a risk management guide? 🚀
XAU/USD (Gold) DAILY MARKET REPORT
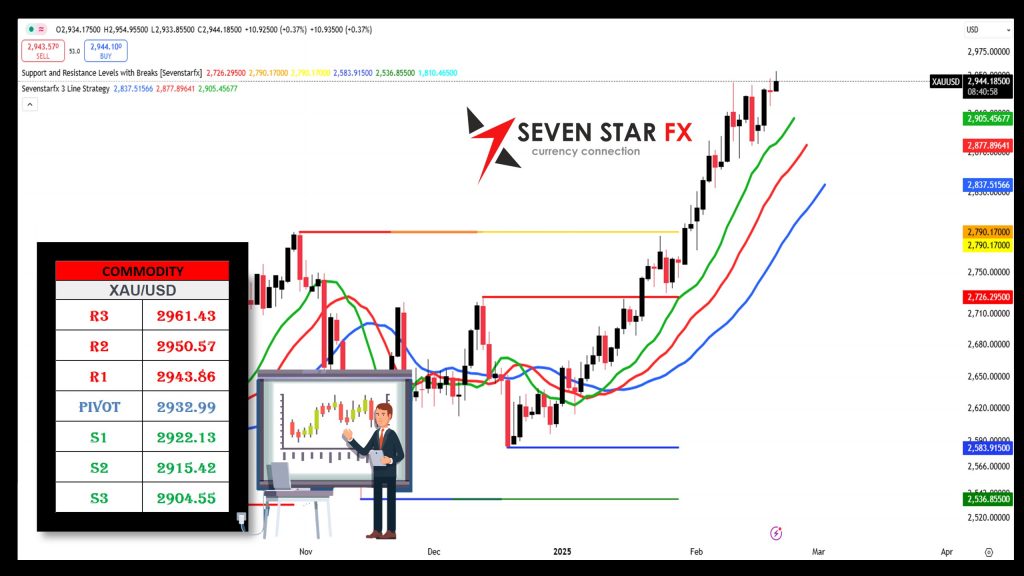
📅 Date: February 20, 2025
💰 Commodity: Gold (XAU/USD)
🎯 Current Pivot Points:
- Resistance Levels: R3: 2961.43 | R2: 2950.57 | R1: 2943.86
- Pivot Level: 2932.99
- Support Levels: S1: 2922.13 | S2: 2915.42 | S3: 2904.55
📌 Fundamental Analysis Summary
1️⃣ US Federal Reserve & Interest Rates:
- The Federal Reserve’s stance on interest rates remains a key driver for gold prices.
- Market speculation on potential rate cuts later in 2025 has kept gold supported.
- Higher inflation risks and global economic uncertainty are boosting gold’s safe-haven demand.
2️⃣ Global Economic & Geopolitical Impact:
- Rising geopolitical tensions and economic instability continue to drive gold prices higher.
- Weaker USD performance in recent sessions has given gold further upside potential.
- Central bank gold buying remains strong, supporting price stability.
3️⃣ Market Sentiment & Risk Appetite:
- Equity market volatility and recession concerns increase gold’s attractiveness.
- If risk appetite improves, gold may see temporary pullbacks.
📊 Fibonacci Analysis
- Key Retracement Levels (from recent high to low):
- 38.2% Level: 2938.00
- 50.0% Level: 2945.50
- 61.8% Level: 2953.00
- Market Implication:
- If gold remains above 2932.99 (Pivot Level), an attempt toward the 50% or 61.8% Fibonacci retracement level is likely.
- A break below 2922.13 (S1) could indicate further downside movement.
📈 Bollinger Bands Analysis
- Current Setup:
- Gold is trading near the middle Bollinger Band, indicating a neutral to slightly bullish trend.
- The upper band at 2965.00 acts as resistance, while the lower band at 2900.00 serves as support.
- Market Implication:
- A break above 2945.00 could signal an uptrend towards 2955.00 – 2960.00.
- A break below 2910.00 may indicate a bearish continuation.
📉 Elliott Wave Analysis
- Wave Count:
- Gold appears to be in a corrective phase (Wave 4) before a potential continuation to the upside.
- If the price remains above 2920.00, the next Wave 5 could push gold toward 2960.00 – 2980.00.
- A break below 2905.00 may indicate an extended correction.
⚠️ Disclaimer:
📢 Gold trading is highly volatile and involves significant risk. This report is for educational purposes only. Any financial losses from trading based on this analysis are not our responsibility. Always use proper risk management.
DOW JONES DAILY MARKET REPORT
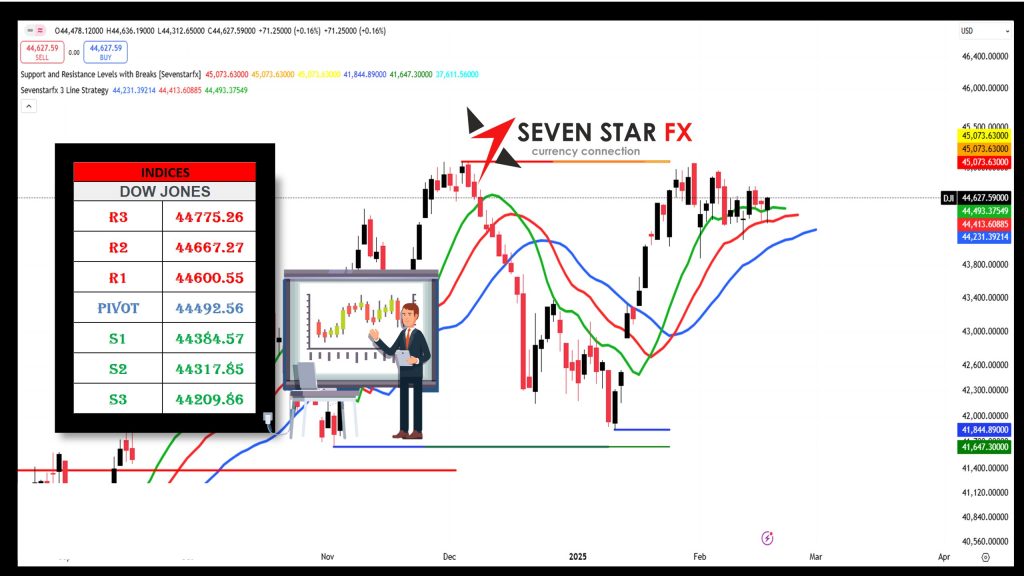
📅 Date: February 20, 2025
💰 Index: Dow Jones Industrial Average (DJIA)
🎯 Current Pivot Points:
- Resistance Levels: R3: 44,775.26 | R2: 44,667.27 | R1: 44,600.55
- Pivot Level: 44,492.56
- Support Levels: S1: 44,384.57 | S2: 44,317.85 | S3: 44,209.86
📌 Fundamental Analysis Summary
1️⃣ US Federal Reserve & Interest Rate Outlook:
- The Federal Reserve’s cautious stance on interest rates continues to influence equity markets.
- Investors are speculating on possible rate cuts in Q3 2025, supporting bullish momentum.
- Any hawkish signals from the Fed could limit gains and trigger corrections.
2️⃣ Corporate Earnings & Market Sentiment:
- Recent strong earnings reports from major Dow components have provided positive sentiment.
- The tech and financial sectors are leading gains, while energy stocks remain volatile.
- If earnings continue to outperform expectations, further upside in the Dow is possible.
3️⃣ Macroeconomic & Geopolitical Factors:
- US inflation data remains mixed, keeping uncertainty in the stock market.
- Geopolitical risks in Asia and the Middle East continue to influence investor confidence.
- Any unexpected global economic slowdown could lead to increased volatility in the index.
📊 Fibonacci Analysis
- Key Retracement Levels (from recent high to low):
- 38.2% Level: 44,550.00
- 50.0% Level: 44,600.00
- 61.8% Level: 44,650.00
- Market Implication:
- If the Dow stays above 44,492.56 (Pivot Level), we may see a move toward the 50% or 61.8% Fibonacci retracement level.
- A break below 44,384.57 (S1) may lead to increased selling pressure.
📈 Bollinger Bands Analysis
- Current Setup:
- The Dow is trading near the upper Bollinger Band, indicating bullish momentum.
- The upper band at 44,800.00 acts as resistance, while the lower band at 44,200.00 serves as support.
- Market Implication:
- A break above 44,600.00 could push the index toward 44,750.00 – 44,800.00.
- A drop below 44,300.00 may signal short-term weakness.
📉 Elliott Wave Analysis
- Wave Count:
- The Dow appears to be in an impulse wave (Wave 5), suggesting a continuation of the uptrend.
- If the price remains above 44,450.00, the next target could be 44,700.00 – 44,800.00.
- A break below 44,300.00 may indicate an early correction.
⚠️ Disclaimer:
📢 Stock market trading is highly volatile and involves significant risk. This report is for educational purposes only. Any financial losses from trading based on this analysis are not our responsibility. Always use proper risk management.
BITCOIN DAILY MARKET REPORT
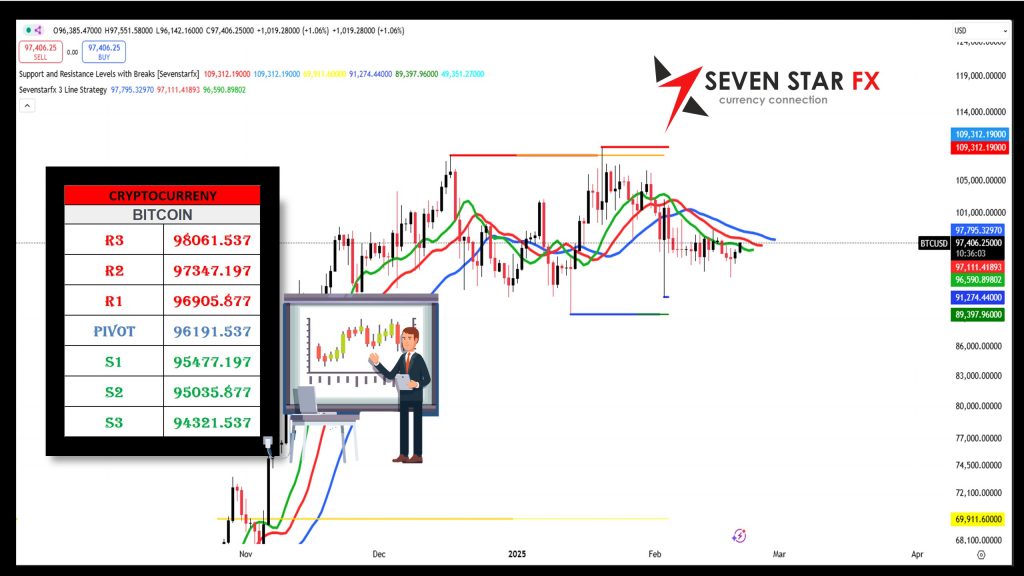
📅 Date: February 20, 2025
💰 Asset: Bitcoin (BTC/USD)
🎯 Current Pivot Points:
- Resistance Levels: R3: 98,061.54 | R2: 97,347.20 | R1: 96,905.88
- Pivot Level: 96,191.54
- Support Levels: S1: 95,477.20 | S2: 95,035.88 | S3: 94,321.54
📌 Fundamental Analysis Summary
1️⃣ Market Sentiment & Institutional Adoption:
- Bitcoin ETFs continue to attract institutional inflows, supporting price stability.
- Growing mainstream adoption and increasing Bitcoin demand could fuel the next rally.
- However, profit-taking near key resistance levels may lead to short-term pullbacks.
2️⃣ Macroeconomic Factors & Regulation:
- US Federal Reserve’s stance on interest rates plays a crucial role in Bitcoin’s price action.
- A potential Fed rate cut later in 2025 could boost BTC, as lower interest rates make risk assets more attractive.
- Global crypto regulations remain uncertain, and any restrictive policies could impact sentiment.
3️⃣ On-Chain & Technical Factors:
- Bitcoin supply on exchanges continues to decline, indicating long-term holders are accumulating.
- Upcoming Bitcoin halving (if applicable) could further reduce supply, driving bullish momentum.
📊 Fibonacci Analysis
- Key Retracement Levels (from recent high to low):
- 38.2% Level: 96,500.00
- 50.0% Level: 97,000.00
- 61.8% Level: 97,500.00
- Market Implication:
- If BTC stays above 96,191.54 (Pivot Level), a test of the 50% or 61.8% Fibonacci retracement level is possible.
- A break below 95,477.20 (S1) may lead to a stronger correction.
📈 Bollinger Bands Analysis
- Current Setup:
- Bitcoin is trading near the middle Bollinger Band, suggesting neutral to slightly bullish momentum.
- The upper band at 98,500.00 acts as resistance, while the lower band at 94,000.00 serves as support.
- Market Implication:
- A break above 97,000.00 could push BTC toward 98,000.00 – 98,500.00.
- A drop below 95,000.00 may indicate a short-term correction.
📉 Elliott Wave Analysis
- Wave Count:
- Bitcoin appears to be in an impulse wave (Wave 5), suggesting a continuation of the uptrend.
- If BTC remains above 95,500.00, the next target could be 97,500.00 – 98,500.00.
- A break below 94,500.00 may indicate a corrective phase before further upside.
⚠️ Disclaimer:
📢 Cryptocurrency trading is highly volatile and involves significant risk. This report is for educational purposes only. Any financial losses from trading based on this analysis are not our responsibility. Always use proper risk management.
Would you like me to include trading recommendations or a risk management guide? 🚀
————————————————————————————————————————————————————————————————————————————-
Notice: The data presented is derived from technical analysis and does not constitute financial advice. For those trading in forex, consulting a qualified financial advisor prior to making investment decisions is strongly recommended.
Caution: The information above reflects ongoing technical analysis and should not be interpreted as financial advice. Forex trading involves high volatility, and without proper knowledge, you risk losing all your capital. It is essential to consult with a financial advisor before investing.
Advisory: The insights shared are the result of technical analysis and are not intended as financial advice. Forex traders should seek advice from professional financial advisors before making any investment decisions. Remember, the forex market is highly volatile, and trading without adequate knowledge can lead to significant losses.
Important: The analysis provided is for informational purposes only and should not be seen as financial advice. Forex trading carries substantial risks, and it is advisable to consult financial advisors before proceeding with any investments. This content is intended solely for Wealth Management Education purposes.