Market Wrap: Stocks, Bonds, Commodities
US stocks dropped for a third straight session and suffered a second straight week of losses on Friday as fears continued to mount that the Federal Reserve’s campaign to arrest inflation would tilt the economy into a recession.
The Dow Jones Industrial Average fell 281.76 points to 32,920.46, the S&P 500 lose 1.11% to 3,852.36 and the Nasdaq Composite subtract 105.11 points to 10,705.41.
MSCI’s index of Asia-Pacific stocks outside Japan is decline 0.32% to 621.34 levels. The Australian index was lower by 0.21% to 7,133.90. Japanese Nikkei Index lose 1.05% today.
European stocks were negative on Monday, with the Stoxx Europe 50 Index fell 0.83% to 3,804.02, Germany’s DAX lose 0.67% to 13,893.07, and France’s CAC decline 1.08% to 6,452.63, and U.K.’s FTSE 100 subtract 1.27% to 7,332.12.
Benchmark 10-year U.S. Treasury fell as demand for safe assets ascend again, today 10-year bond yields are positive 0.94% to 3.515.
Oil prices reclaimed ground on Monday after tumbling more than $2 a barrel in the previous session as optimism from China’s reopening and oil demand recovery outweighed concerns of a global recession.
Spot Brent crude oil rose 0.57% to $79.49 per barrel. US West Texas Intermediate crude is up 0.60% to $74.91 a barrel.
The yellow metal gold is advance 0.16% to 1,803.05 dollars per ounce.
Market Wrap: Forex
European stock markets are expected to open marginally higher Monday after recent weakness, with the focus on the German Ifo business climate index for a gauge of the strength of the Eurozone’s dominant economy.
Today, the U.S. dollar index measures the Greenback against a trade-weighted basket of six major currencies, which slipped 0.27% to 104.055.
The Euro US Dollar (EUR/USD) is a widely traded pair that is up 0.44% today. This left the pair trading around $1.0629.
The Japanese yen was negative against the U.S. dollar on Monday. Today USD/JPY is drop 0.58% to the 135.90 level.
Another commodity-related currency positive against the U.S dollar, AUD/USD rose 0.40% to 0.6711, and NZD/USD gain 0.18% to 0.6385 level.
EUR/USD Intraday: Major trend on the upside
Our pivot point is at 1.06100
Preferable Price Action: Take long positions above pivot level with targets at 1.06390 & 1.06600 in extension.
Alternative Price Action: Below pivot looks for a further downside to 1.05810 & 1.05610.
Comment: RSI above 50 levels and Pairs above 20MA.
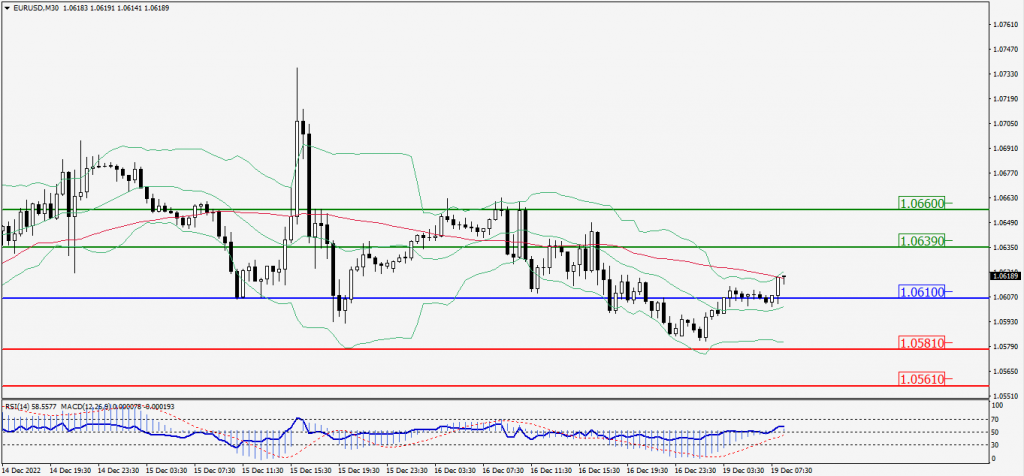
Green Lines Indicate Resistance Levels – Red Lines Indicate Support Levels
Light Blue is a Pivot Point – Black represents the price when the report was produced
GBP/USD Intraday: Support level at 1.21750
Our pivot point is at 1.21750.
Preferable Price Action: Buy positions above pivot with targets at 1.22620 & 1.23260 in extension.
Alternative Price Action: The price below pivot would call for further downside to 1.20880 & 1.20280.
Comment: RSI is above 50 levels and Pairs above 20MA.
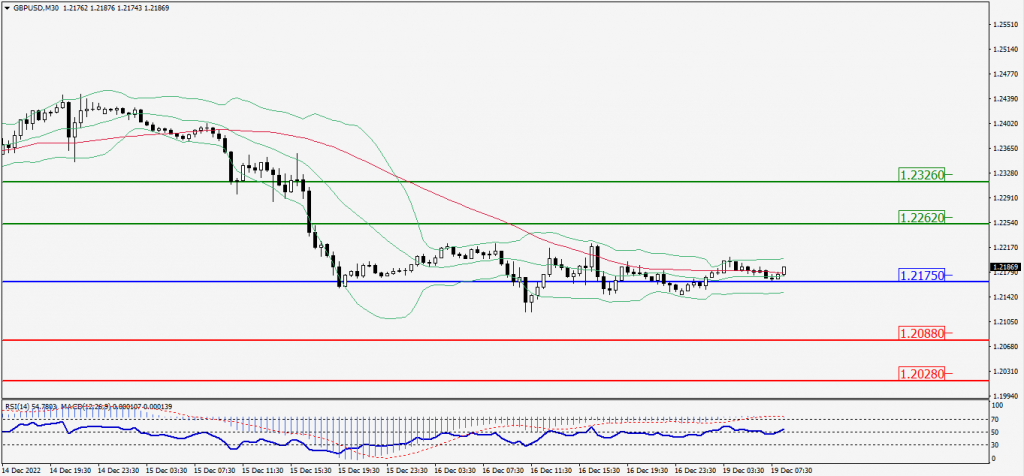
Green Lines Indicate Resistance Levels – Red Lines Indicate Support Levels
Light Blue is a Pivot Point – Black represents the price when the report was produced
USD/JPY Intraday: Trend on the downside
Our pivot point is at 136.240
Preferable Price Action: Sell position below pivot with the target at 135.660 and 135.200 in extension.
Alternative Price Action: The upside breakout of the pivot would call for 136.820 and 137.300.
Comment: MACD is negative territory and Pairs below 20MA & 55MA.
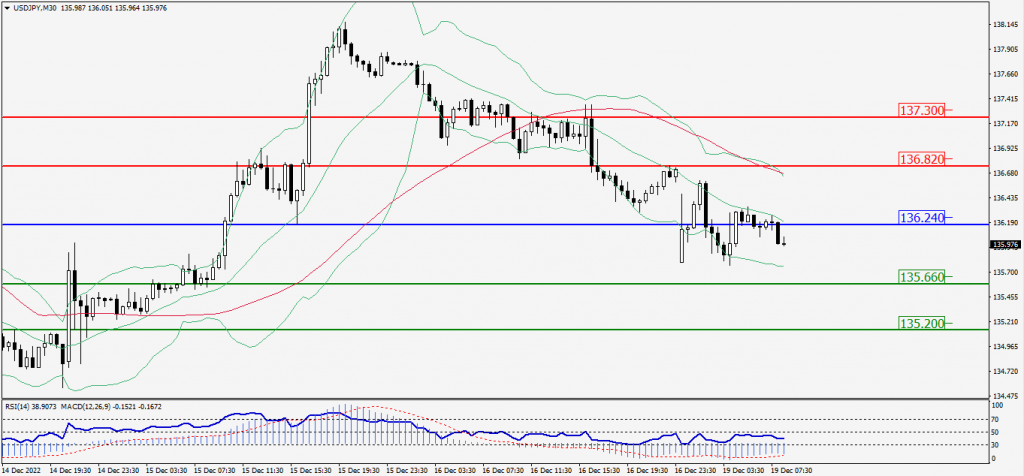
Green Lines Indicate Resistance Levels – Red Lines Indicate Support Levels
Light Blue is a Pivot Point – Black represents the price when the report was produced
AUD/USD Intraday: In a consolidation zone
Our pivot point is at 0.67190
Preferable Price Action: Sell Positions below pivot with targets at 0.66750 & 0.66460 in extension.
Alternative Price Action: Above pivot looks for a further upside with 0.67640 & 0.67930 as targets.
Comment: RSI is at 50 levels.
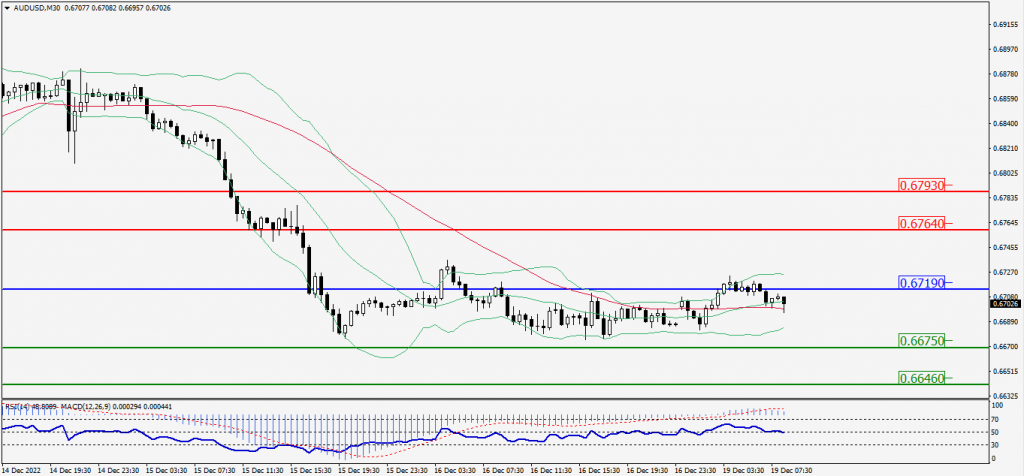
Green Lines Indicate Resistance Levels – Red Lines Indicate Support Levels
Light Blue is a Pivot Point – Black represents the price when the report was produced
CRUDEOIL Intraday: Trend on the downside
Our pivot point is at 75.21.
Preferable Price Action: Below pivots sell oil with 74.49 & 74.01 as targets.
Alternative Price Action: Buy crude up pivot with targets at 75.93 and 76.40 in extension.
Comment: MACD is negative territory and Pairs below 20MA.
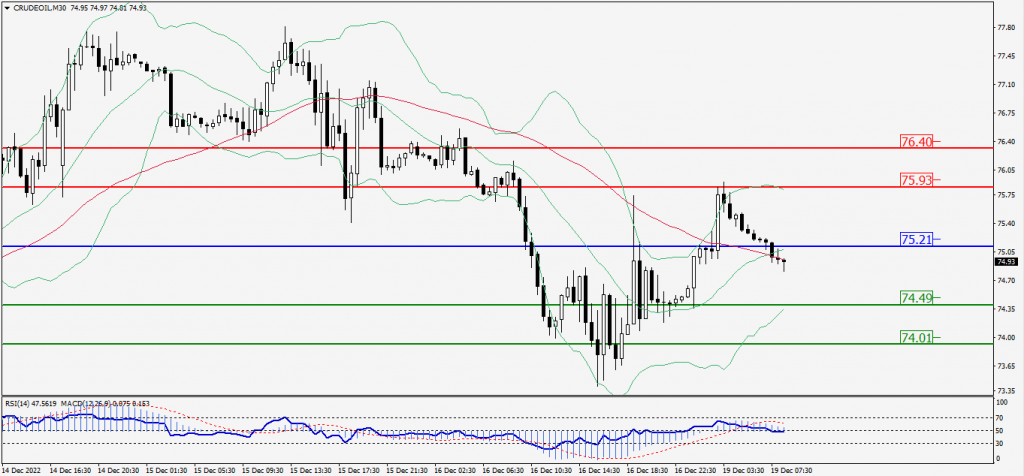
Green Lines Indicate Resistance Levels – Red Lines Indicate Support Levels
Light Blue is a Pivot Point – Black represents the price when the report was produced
XAU/USD Intraday: Trend on the upside
Our pivot point is 1792.00
Preferable Price Action: Further upside to 1797.50 and 1801.80
Alternative Price Action: If the price gives a downside breakout of a pivot, then the price extends to 1786.60 and 1782.10.
Comment: MACD is positive territory and Pairs above 55MA.
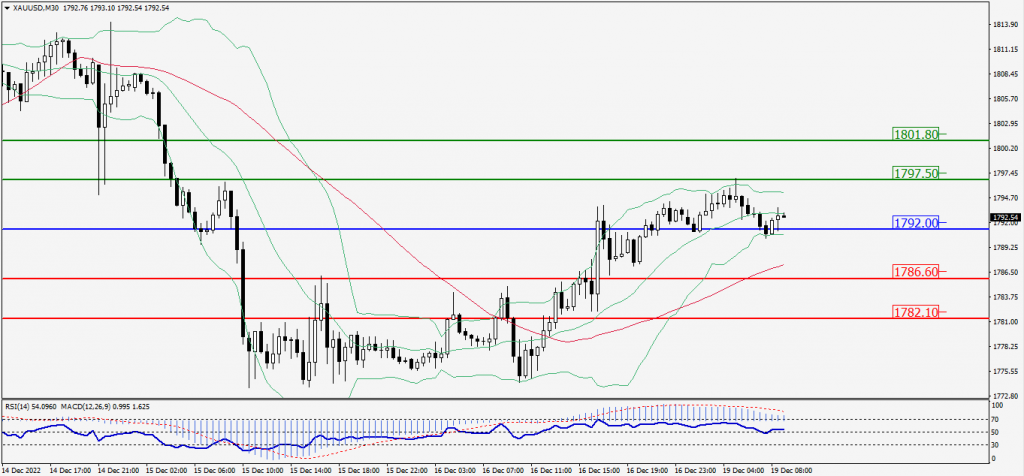
Green Lines Indicate Resistance Levels – Red Lines Indicate Support Levels
Light Blue is a Pivot Point – Black represents the price when the report was produced
Dow Jones Intraday: Trend on the upside
Our pivot point is 32,925.00
Preferable Price Action: Take buy positions above the pivot with targets at 33,232.00 & 33,431.00.
Alternative Price Action: Below 32,925.00 looks for further downside to 32,623.00 & 32,424.00.
Comment: RSI is above 50 levels and Pairs above 20MA & 55MA.
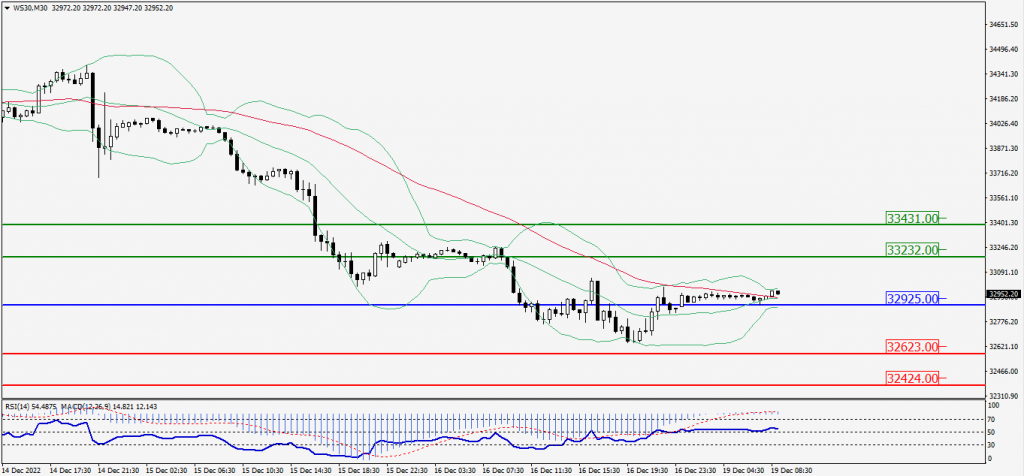
Green Lines Indicate Resistance Levels – Red Lines Indicate Support Levels
Light Blue is a Pivot Point – Black represents the price when the report was produced