Market Wrap: Stocks, Bonds, Commodities
The European Central Bank holds its latest policy-setting meeting later this week, and Citigroup advises selling any rallies in the euro around this key event.
The Dow Jones Industrial Average rose 337.28 points to 43,077.70, the S&P 500 gain 0.47% to 5,842.47 and the Nasdaq Composite ascend 51.49 points to 18,367.08.
MSCI’s index of Asia-Pacific stocks outside Japan is down 1.08% to 740.32 levels. The Australian index was higher by 0.86% to 8,355.90. Japanese Nikkei Index decrease 0.65% today.
European stocks were mixed on Thursday, with the Stoxx Europe 50 Index increase 0.37% to 4,926.75 Germany’s DAX ascend 0.35% to 19,518.65, and France’s CAC higher 0.48% to 7,527.81 and U.K.’s FTSE 100 loss 0.05% to 8,325.25.
Benchmark 10-year U.S. Treasury rose as demand for safe assets slipped again, today 10-year bond yields 0.53% to 4.0370.
Oil prices traded flat on Thursday as investors eye developments in the Middle East and more details on China’s stimulus plans, and await the release of official U.S. oil inventory data.
Spot Brent crude oil decrease 0.12% to $74.13 per barrel. US West Texas Intermediate crude is decrease 0.11% to $70.31 a barrel.
The yellow metal gold is up 0.25% to 2,698.10 dollars per ounce.
Market Wrap: Forex
The US dollar has gained more ground as the US presidential election draws near, UBS noted, with the market seeing rising odds of a win for Republican candidate Donald Trump.
Today, the U.S. dollar index measures the Greenback against a trade-weighted basket of six major currencies, which increase 0.05% to 103.447.
The Euro US Dollar (EUR/USD) is a widely traded is down 0.08% today. This left the pair trading around $1.08520.
The Japanese yen was will move positive against the U.S. dollar on Thursday. Today USD/JPY is trades pair that increase 0.06% to the 149.700 level.
Another commodity-related currency mixed against the U.S dollar, AUD/USD gain 0.16% to 0.66760, and NZD/USD decrease 0.10% to 0.60490 level.
EUR/USD Intraday: Trend on the downside
Our pivot point is at 1.08640
Preferable Price Action: Take sell positions below pivot level with targets at 1.08470 & 1.08340 in extension.
Alternative Price Action: Buy pivot looks for a further upside to 1.08810 & 1.08960.
Comment: RSI is below 50 levels and pairs below its 55MA & 20MA.
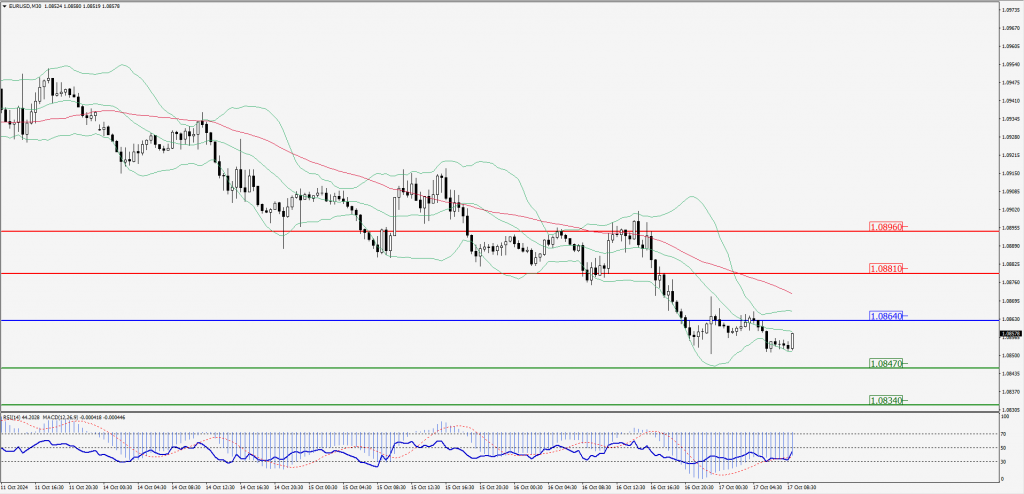
Green Lines Indicate Resistance Levels – Red Lines Indicate Support Levels
Light Blue is a Pivot Point – Black represents the price when the report was produced
GBP/USD Intraday: Trend on the downside
Our pivot point is at 1.29910
Preferable Price Action: Sell positions below pivot with targets at 1.29730 & 1.29550 in extension.
Alternative Price Action: The price above pivot would call for further upside to 1.30110 & 1.30290.
Comment: RSI is below 50 levels and pairs below its 20MA & 55MA.
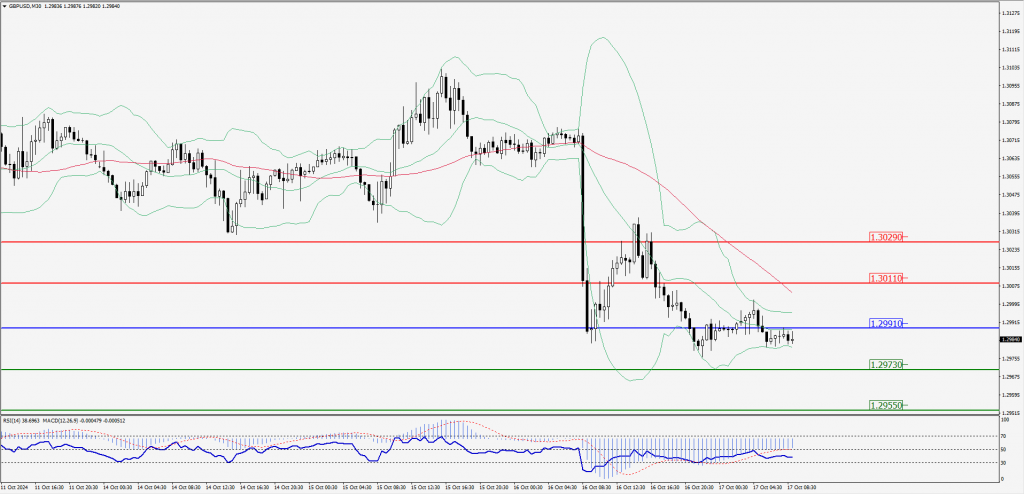
Green Lines Indicate Resistance Levels – Red Lines Indicate Support Levels
Light Blue is a Pivot Point – Black represents the price when the report was produced
USD/JPY Intraday: Trend on the upside
Our pivot point is at 149.550
Preferable Price Action: Buy position above pivot with the target at 149.710 and 149.850 in extension.
Alternative Price Action: The downside breakout of the pivot would call for 149.390 and 149.240.
Comment: MACD is above 50 levels and pairs above its 20MA & 55MA.
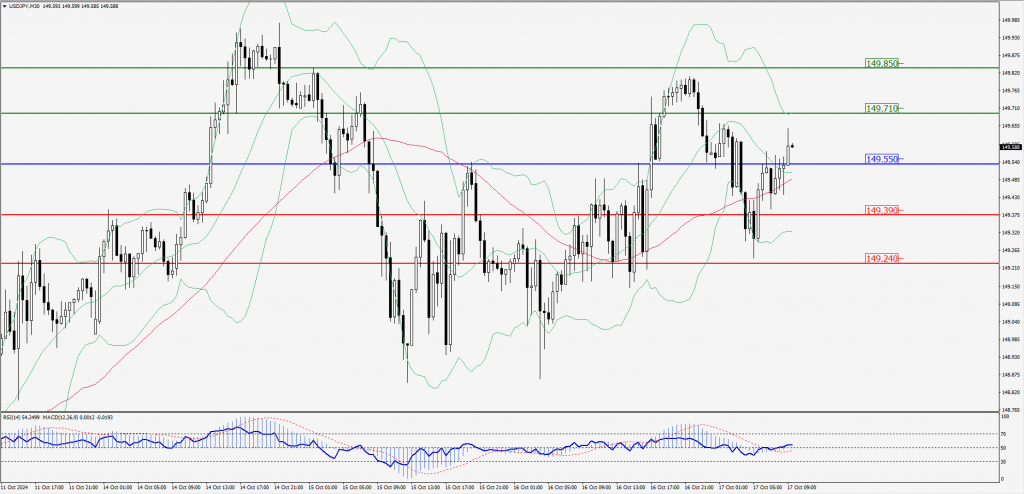
Green Lines Indicate Resistance Levels – Red Lines Indicate Support Levels
Light Blue is a Pivot Point – Black represents the price when the report was produced
AUD/USD Intraday: Trend on the upside
Our pivot point is at 0.66840
Preferable Price Action: Buy positions above pivot with targets at 0.66980 & 0.67100 in extension.
Alternative Price Action: Below pivot a further downside with 0.66710 & 0.66580 as targets.
Comment: RSI is above 50 levels and pairs above its 55MA & 20MA.
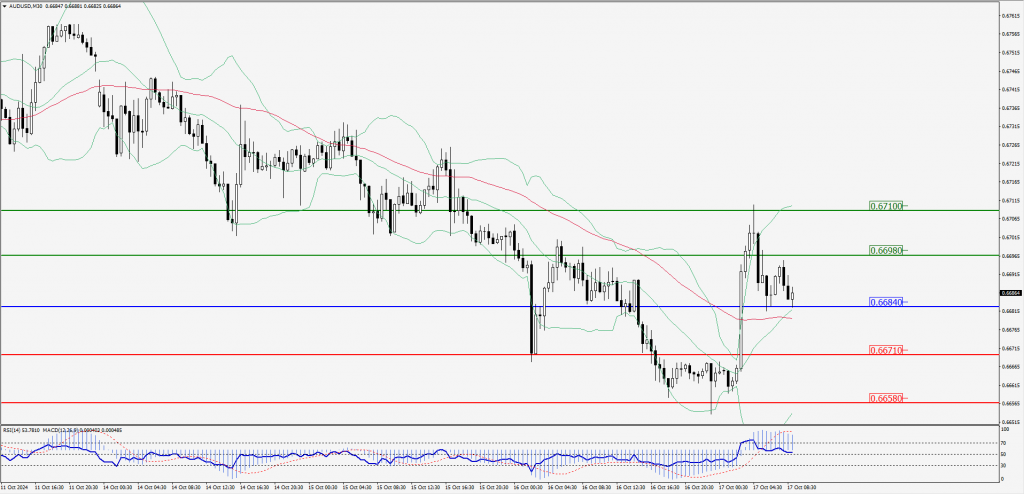
Green Lines Indicate Resistance Levels – Red Lines Indicate Support Levels
Light Blue is a Pivot Point – Black represents the price when the report was produced
CRUDEOIL Intraday: Resistance level at 70.09
Our pivot point is at 70.09
Preferable Price Action: Below pivot sell oil with 69.16 & 68.37 as targets.
Alternative Price Action: Buy crude above pivot with targets at 71.02 & 71.86 in extension.
Comment: RSI is at below 50 levels and pairs below its 20MA & 55MA.
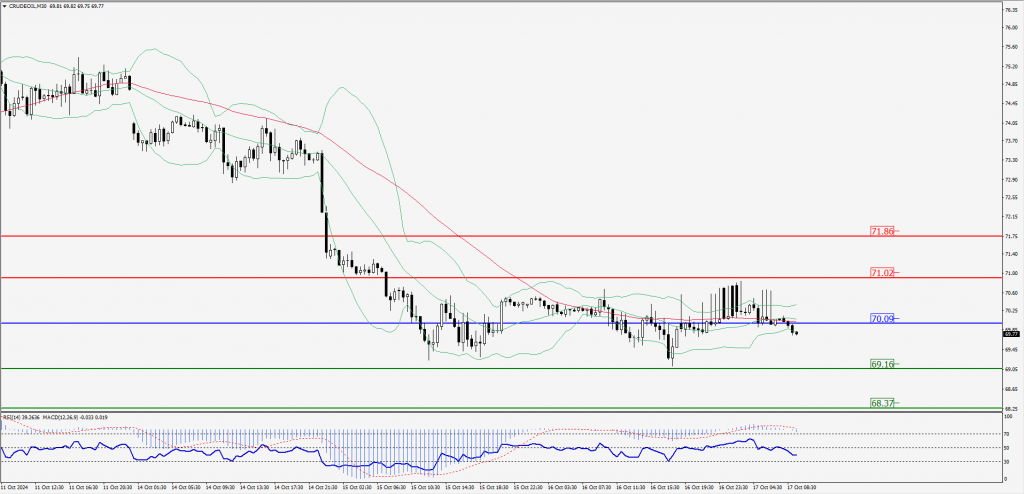
Green Lines Indicate Resistance Levels – Red Lines Indicate Support Levels
Light Blue is a Pivot Point – Black represents the price when the report was produced
XAU/USD Intraday: Trend on the upside
Our pivot point is at 2680.60
Preferable Price Action: Further upside to 2689.30 and 2697.10.
Alternative Price Action: If the price gives an upside breakout of a pivot, then the price extends to 2672.20 and 2664.10.
Comment: MACD is above 50 levels and pairs above its 55MA & 20MA.
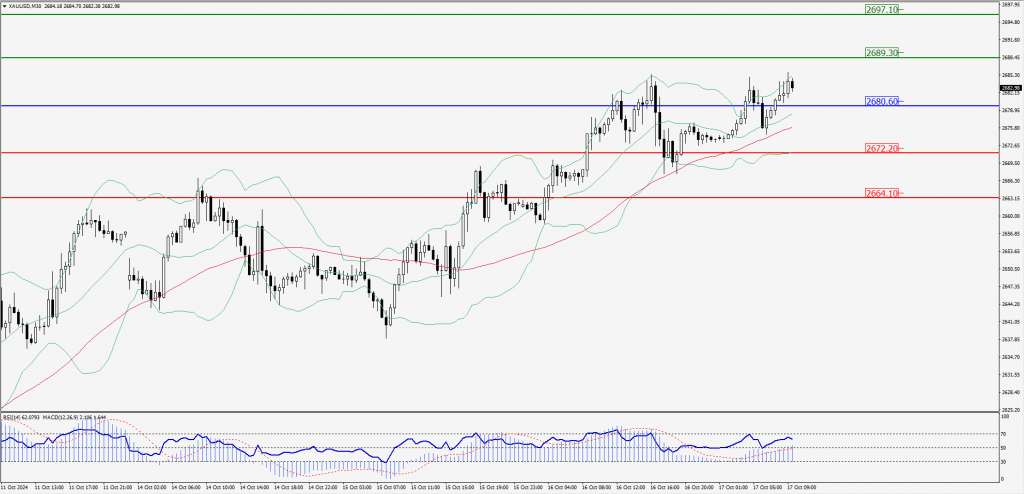
Green Lines Indicate Resistance Levels – Red Lines Indicate Support Levels
Light Blue is a Pivot Point – Black represents the price when the report was produced
Dow Jones Intraday: Trend on the upside
Our pivot point is 43,015.00
Preferable Price Action: Take buy positions above the pivot with targets at 43,110.20 & 43,186.70.
Alternative Price Action: Below 43,015.00 looks for further downside to 42,919.90 & 42,843.30.
Comment: RSI is above 50 levels and pairs above its 55MA.
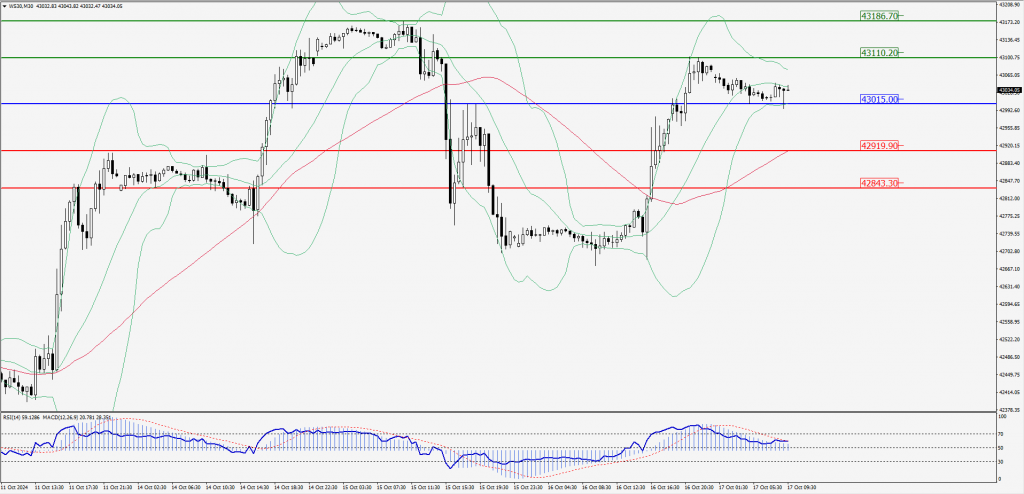
Green Lines Indicate Resistance Levels – Red Lines Indicate Support Levels
Light Blue is a Pivot Point – Black represents the price when the report was produced