Market Wrap: Stocks, Bonds, Commodities
The U.S. dollar is on track for a hefty weekly fall on renewed dovish hopes for the Federal Reserve, but this selling “looks exaggerated”, according to HSBC.
The Dow Jones Industrial Average fell 38.62 points to 39,869.38, the S&P 500 loss 0.21% to 5,297.10and the Nasdaq Composite drop 44.07 points to 16,698.32.
MSCI’s index of Asia-Pacific stocks outside Japan is surged 0.06% to 700.85 levels. The Australian index was high by 0.85% to 7,814.40. Japanese Nikkei Index decrease 0.40% today.
European stocks were negative on Friday, with the Stoxx Europe 50 Index decrease 0.40% to 5,051.95, Germany’s DAX drop 0.27% to 18,674.25, and France’s CAC lower 0.39% to 8,156.81 and U.K.’s FTSE 100 loss 0.30% to 8,412.96.
Benchmark 10-year U.S. Treasury rose as demand for safe assets slipped again, today 10-year bond yields increace 0.32% to 4.389.
Oil prices rose in Asian trading hours on Friday, with global benchmark Brent set for its first weekly increase in three weeks on signs of improving global demand and slowing inflation in top oil consumer the United States.
Spot Brent crude oil drop 0.04% to $83.30 per barrel. US West Texas Intermediate crude is down 0.11% to $79.14 a barrel.
The yellow metal gold is decrease 0.10% to 2,387.85 dollars per ounce.
Market Wrap: Forex
The U.S. dollar edged higher in European trade Friday, but was on track for a hefty weekly fall after cooling inflation and weak retail sales brought Federal Reserve rate cuts back into focus.
Today, the U.S. dollar index measures the Greenback against a trade-weighted basket of six major currencies, which surged 0.26% to 104.620.
The Euro US Dollar (EUR/USD) is a widely traded pair that is decrease 0.18% today. This left the pair trading around $1.2845.
The Japanese yen was negative against the U.S. dollar on Thursday. Today USD/JPY is higer 0.28% to the 155.82 level.
Another commodity-related currency negative against the U.S dollar, AUD/USD fell 0.35% to 0.6653, and NZD/USD descend 0.17% to 0.6109 level.
EUR/USD Intraday: Trend on the downside
Our pivot point is at 1.08560
Preferable Price Action: Take sell positions below pivot level with targets at 1.08340 & 1.08150 in extension.
Alternative Price Action: Above pivot looks for a further upside to 1.08770 & 1.08960.
Comment: RSI is below 50 levels and pairs below its 20MA & 55MA.
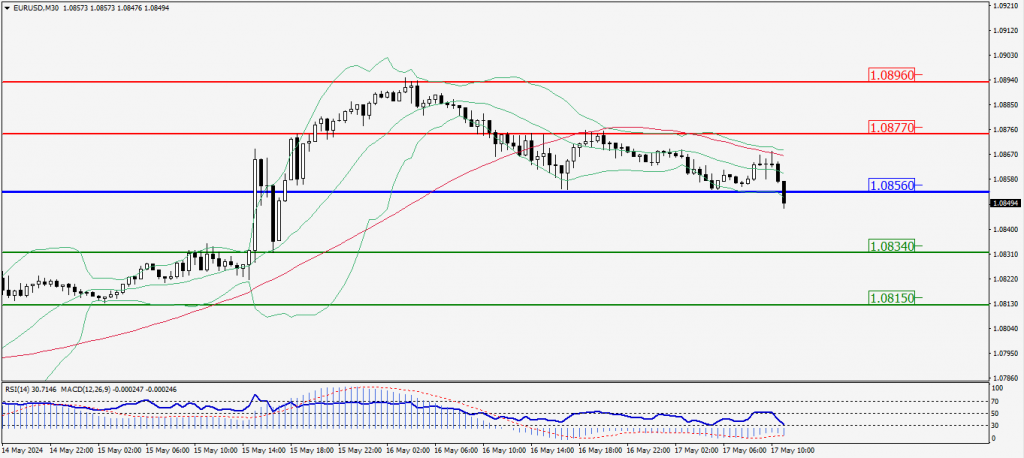
Green Lines Indicate Resistance Levels – Red Lines Indicate Support Levels
Light Blue is a Pivot Point – Black represents the price when the report was produced
GBP/USD Intraday: Trend on the downside
Our pivot point is at 1.26660
Preferable Price Action: Sell positions below pivot with targets at 1.26290 & 1.25980 in extension.
Alternative Price Action: The price above pivot would call for further upside to 1.27030 & 1.27300.
Comment: RSI is below 50 levels and pairs below its 20MA & 55MA.
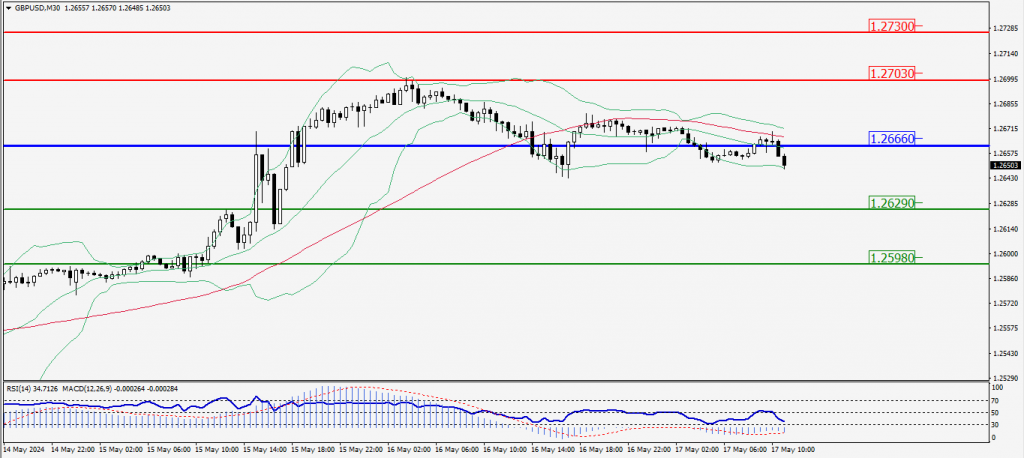
Green Lines Indicate Resistance Levels – Red Lines Indicate Support Levels
Light Blue is a Pivot Point – Black represents the price when the report was produced
USD/JPY Intraday: Trend on the upside
Our pivot point is at 155.800
Preferable Price Action: Buy position above pivot with the target at 156.300 and 156.720 in extension.
Alternative Price Action: The downside breakout of the pivot would call for 153.310 and 154.880.
Comment: MACD is above 50 levels and pairs above its 20MA & 55MA.
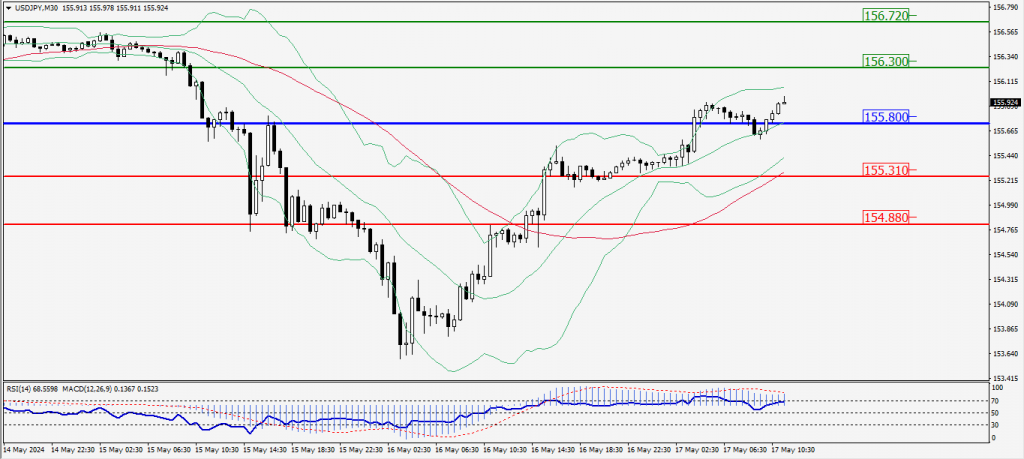
Green Lines Indicate Resistance Levels – Red Lines Indicate Support Levels
Light Blue is a Pivot Point – Black represents the price when the report was produced
AUD/USD Intraday: Major trend on the downside
Our pivot point is at 0.66610
Preferable Price Action: Sell positions below pivot with targets at 0.66440 & 0.66300 in extension.
Alternative Price Action: Above pivot looks for a further upside with 0.66810 & 0.66950 as targets.
Comment: RSI is below 50 levels and pairs below its 20MA & 55MA.
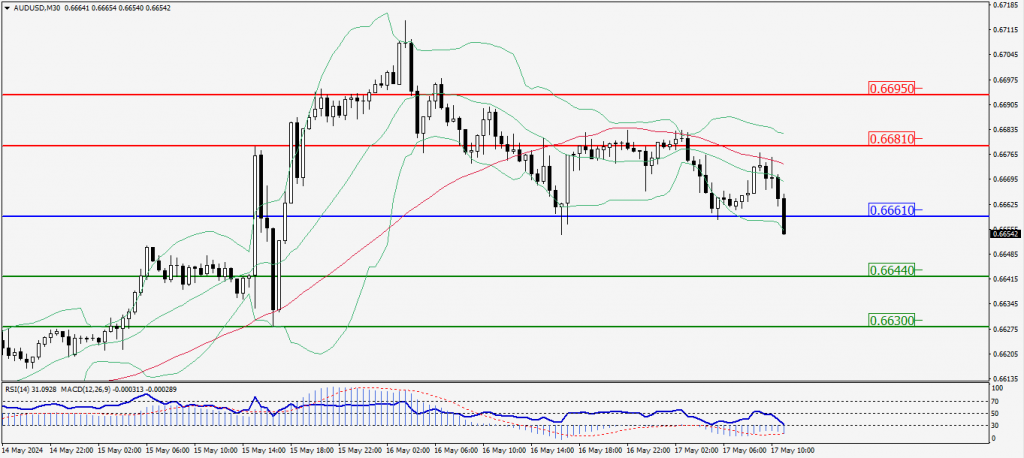
Green Lines Indicate Resistance Levels – Red Lines Indicate Support Levels
Light Blue is a Pivot Point – Black represents the price when the report was produced
CRUDEOIL Intraday: Support level at 78.84
Our pivot point is at 78.84
Preferable Price Action: Above pivot buy oil with 79.63 & 80.22 as targets.
Alternative Price Action: Sell crude below pivot with targets at 78.08 and 77.42 in extension.
Comment: MACD is positive territory and pairs above its 55MA.
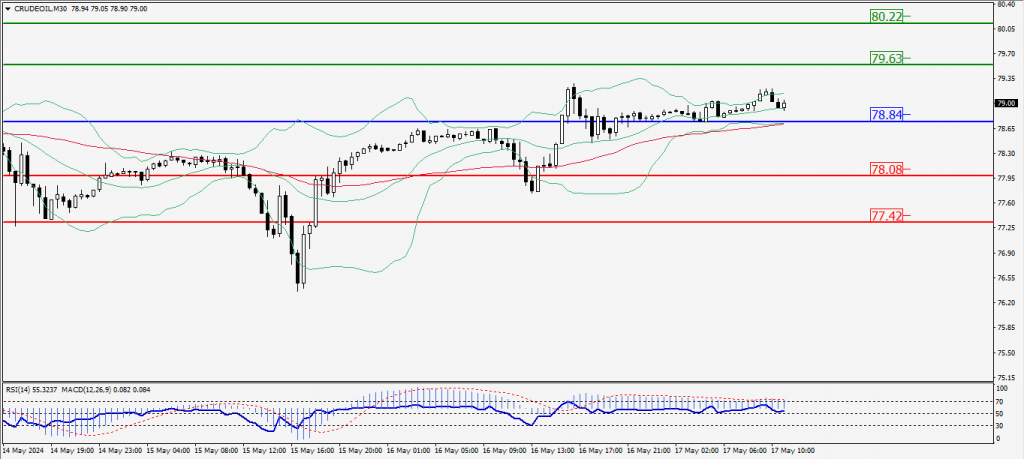
Green Lines Indicate Resistance Levels – Red Lines Indicate Support Levels
Light Blue is a Pivot Point – Black represents the price when the report was produced
XAU/USD Intraday: Trend on the upside
Our pivot point is 2380.50
Preferable Price Action: Further upside to 2394.90 and 2404.80.
Alternative Price Action: If the price gives an upside breakout of a pivot, then the price extends to 2366.80 and 2356.30.
Comment: MACD is above 50 levels and pairs above its 20MA.
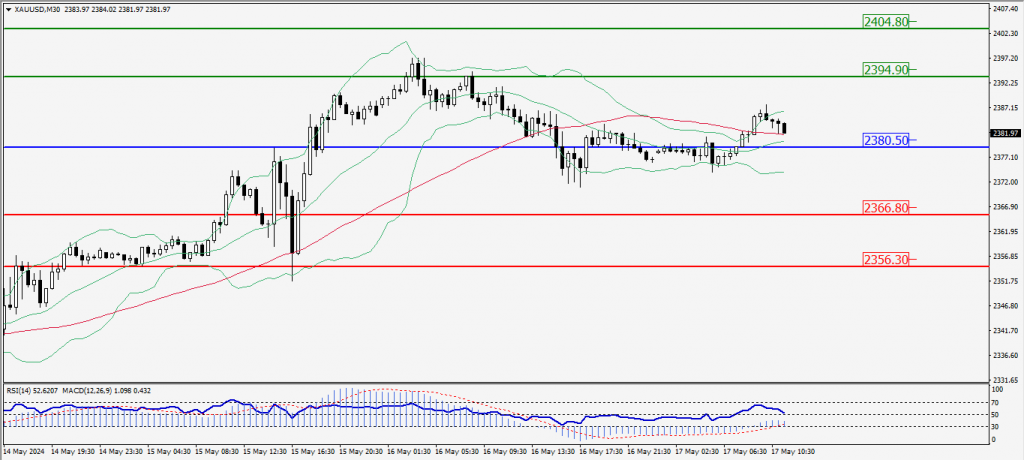
Green Lines Indicate Resistance Levels – Red Lines Indicate Support Levels
Light Blue is a Pivot Point – Black represents the price when the report was produced
Dow Jones Intraday: Trend on the downside
Our pivot point is 39,910.60
Preferable Price Action: Take sell positions below the pivot with targets at 39,723.30 & 39,603.70.
Alternative Price Action: Above 39,910.60 looks for further upside to 40,080.90 & 40,184.60.
Comment: RSI is below 50 levels and pairs below its 20MA & 55MA.
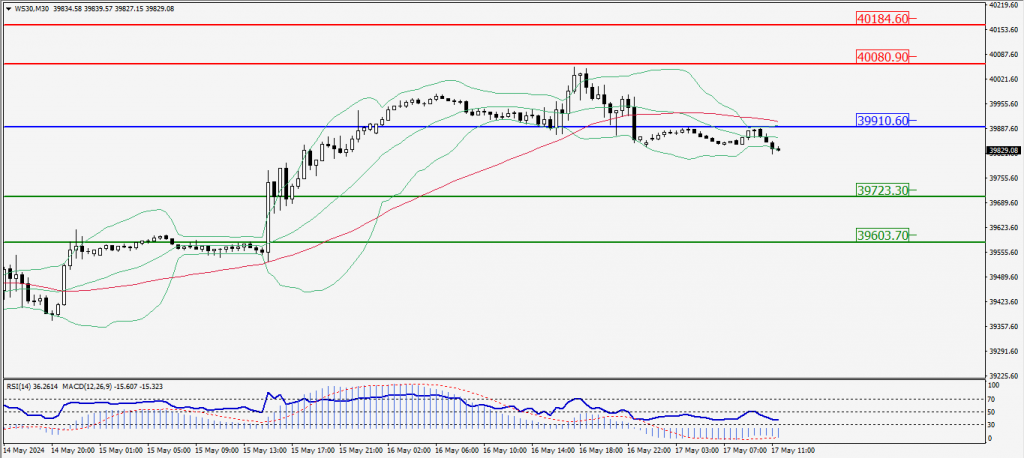
Green Lines Indicate Resistance Levels – Red Lines Indicate Support Levels
Light Blue is a Pivot Point – Black represents the price when the report was produced