Market Wrap: Stocks, Bonds, Commodities
The Dow closed lower on Monday with a big drag from financial stocks as investors were disappointed by the fourth-quarter results from big US banks, which cast a shadow over the earnings season kick-off.
The S&P 500 Gain (0.08%) ends at 4,662.85 points, while the Nasdaq Composite gain 86.90 points (0.59%) to 14,893.80. The Dow Jones Industrial fell (0.56%) to 35,911.81.
MSCI’s index of Asia-Pacific stocks outside Japan fell 0.32%, to 801.25 levels. Australian index up 0.32% to 7,417.30. Japanese Nikkei Index rose 0.74% to 28,333.52.
European stocks were positive on Monday, with the Stoxx Europe 50 Index collected 0.30% to 4,285.05 Germany’s DAX stair up 0.25% to 15,922.24, and France’s CAC Gain 0.39% to 7,171.10, and U.K.’s FTSE 100 pulled up 0.67% to 7,593.51.
Benchmark 10-year U.S. Treasury ascend as demand for safe assets gains again, today 10-year bond yields rose to 1.19% to 1.793.
Oil prices rose on Monday, with Brent crude futures at their highest in more than three years, as investors bet supply will remain tight amid restrained output by major producers with global demand unperturbed by the Omicron coronavirus variant.
Spot Brent crude oil lost 0.05% to $86.02 per barrel. US West Texas Intermediate crude up to $83.47 a barrel.
The yellow metal gold is rose 0.32% to 1,822.35 dollars per ounce.
Market Wrap: Forex
The dollar clung to a late-week bounce on Monday as investors braced for January’s U.S. Federal Reserve meeting and raised bets it will chart a year ahead holding several rate hikes, while China surprised analysts with a benchmark cut.
Today, the U.S. dollar index measures the greenback against a trade-weighted basket of six major currencies, which is dropped 0.06% to 95.110.
The Euro US Dollar (EUR/USD) is a widely traded pair that is gained today. This left the pair trading around $1.14290.
The Japanese yen rose against the U.S. dollar on Monday as the stock pushes the upper. Today USD/JPY is up 0.11% at 114.320 level.
Another commodity-related currency Gain against the U.S dollar, AUD/USD up 0.16% to 0.72180, and NZD/USD rose 0.27% to 0.68160 level.
EUR/USD Intraday: Trend on The Downside
Our pivot point is at 1.14460
Preferable Price Action: Take Short positions below pivot level with targets at 1.13850 & 1.13290 in extension.
Alternative Price Action: Above pivot looks for a further Upside to 1.15070 & 1.15630.
Comment: Pair Below 55MA and RSI at 50 levels.
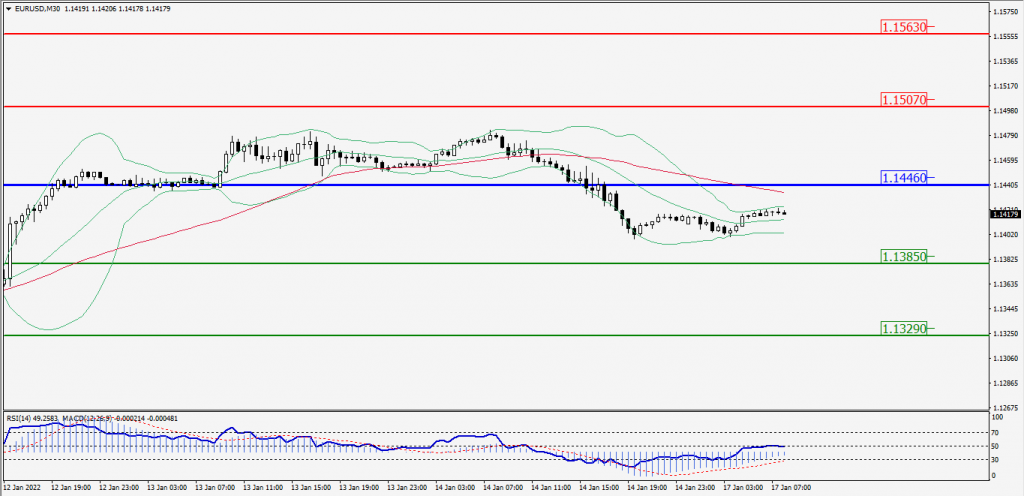
Green Lines Indicate Resistance Levels – Red Lines Indicates Support Levels
Light Blue is a Pivot Point – Black represents the price when the report was produced
GBP/USD Intraday: Major Resistance at 1.37090
Our pivot point is at 1.37090
Preferable Price Action: Sell positions Below pivot with targets at 1.36300 & 1.35710 in extension.
Alternative Price Action: The price Above pivot would call for further Upside to 1.37880 & 1.38470.
Comment: Pair Below 55MA and RSI below 50 levels.
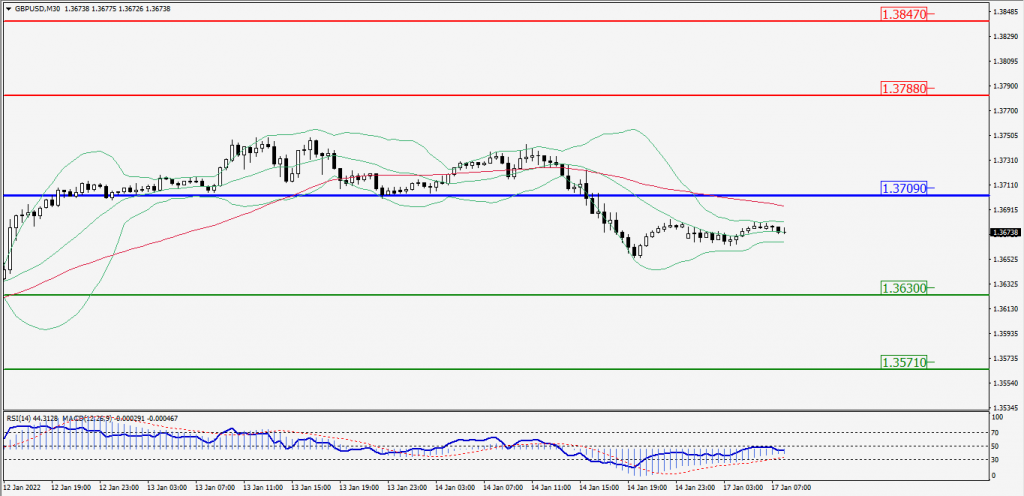
Green Lines Indicate Resistance Levels – Red Lines Indicates Support Levels
Light Blue is a Pivot Point – Black represents the price when the report was produced
USD/JPY Intraday: Major Support at 114.050
Our pivot point is at 114.050
Preferable Price Action: Buy position Above pivot with the target at 115.650 and 116.960 in extension.
Alternative Price Action: The Downside breakout of the pivot would call for 112.450 and 111.140.
Comment: Pair Above its 55MA & 20MA and MACD in positive territory.
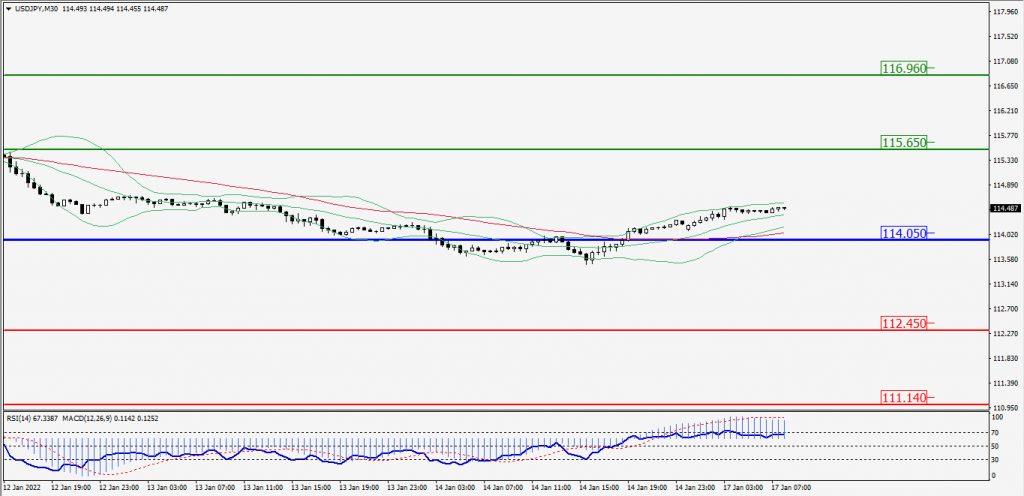
Green Lines Indicate Resistance Levels – Red Lines Indicates Support Levels
Light Blue is a Pivot Point – Black represents the price when the report was produced
AUD/USD Intraday: Major Trend on the Downside
Our pivot point is at 0.72490
Preferable Price Action: Sell Positions Below pivot with targets at 0.71720 & 0.71140 in extension.
Alternative Price Action: Above pivot looks for a further Upside with 0.73220 & 0.73810 as targets.
Comment: Pair Below its 55MA & 20MA and RSI Below 50 levels.
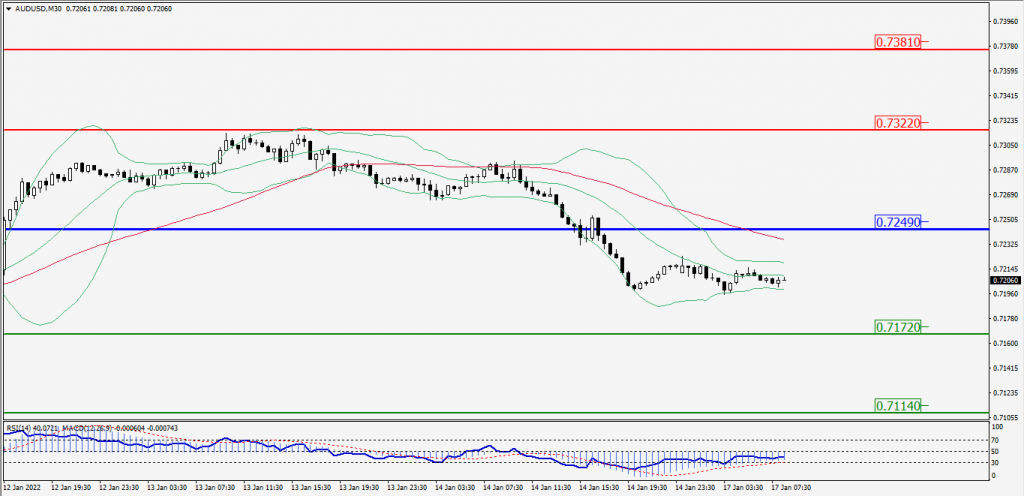
Green Lines Indicate Resistance Levels – Red Lines Indicates Support Levels
Light Blue is a Pivot Point – Black represents the price when the report was produced
CRUDEOIL Intraday: Strong Trend on the Upside
Our pivot point is at 82.60
Preferable Price Action: Above pivots Buy Oil with 86.10 & 87.90 as targets.
Alternative Price Action: Sell crude Below pivot with targets at 79.10 and 77.20 in extension.
Comment: Price Above 55MA and MACD is in the positive territory.
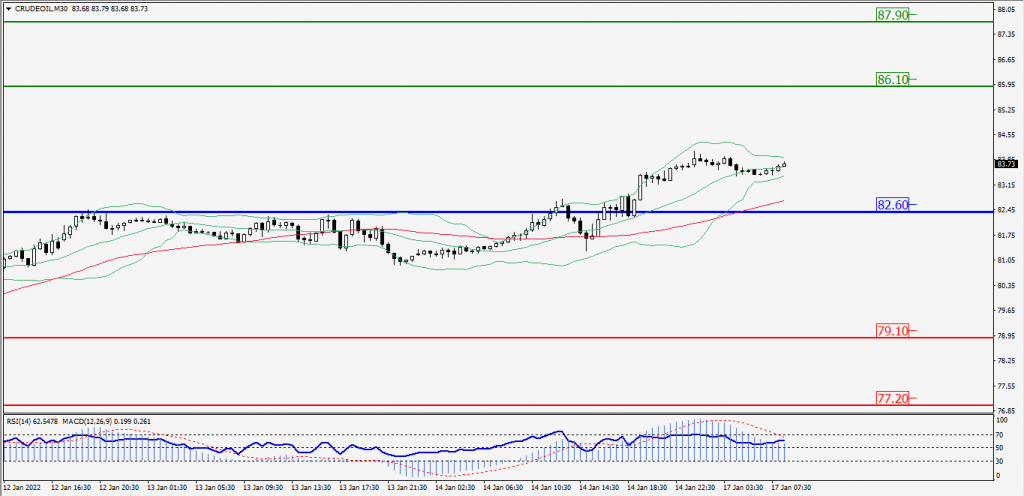
Green Lines Indicate Resistance Levels – Red Lines Indicates Support Levels
Light Blue is a Pivot Point – Black represents the price when the report was produced
XAU/USD Intraday: In Consolidation Zone
Our pivot point is 1826.20
Preferable Price Action: Further Downside to 1808.70 and 1796.80.
Alternative Price Action: If the price gives an Upside breakout of a pivot, then the price extends to 1843.70 and 1855.60.
Comment: MACD is in positive territory and the price is below 55MA.
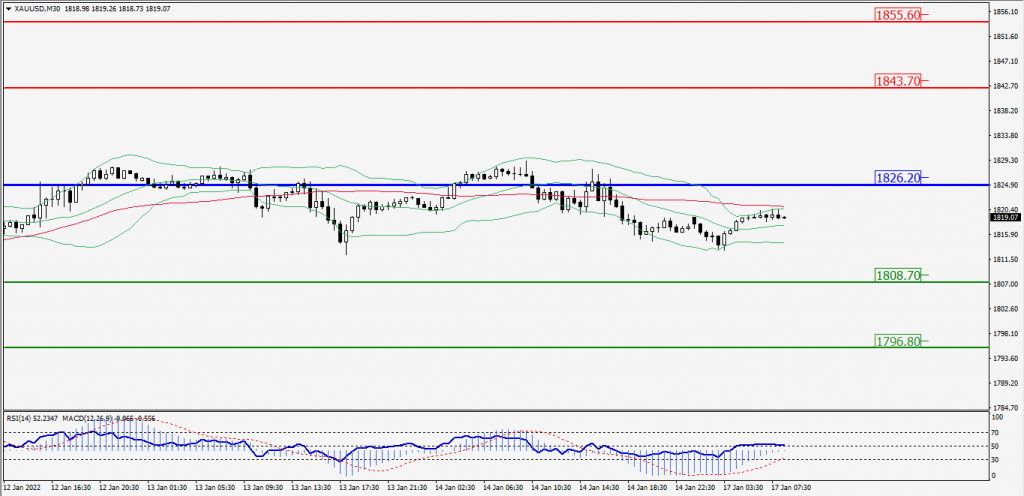
Green Lines Indicate Resistance Levels – Red Lines Indicates Support Levels
Light Blue is a Pivot Point – Black represents the price when the report was produced
Dow Jones Intraday: Resistance at 36,105.00
Our pivot point is 36,105.00
Preferable Price Action: Take Short positions Below pivot with targets at 35,518.00 & 35,114.00.
Alternative Price Action: Above 36,105.00 looks for further Upside to 36,692.00 & 37,096.00.
Comment: RSI at 50 levels And price is Below 55MA.
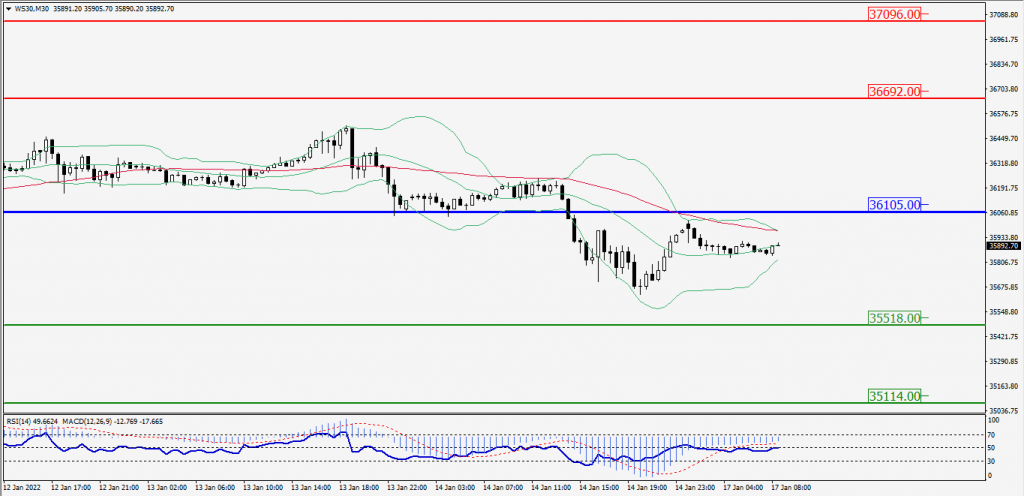
Green Lines Indicate Resistance Levels – Red Lines Indicates Support Levels
Light Blue is a Pivot Point – Black represents the price when the report was produced