DAILY FOREX MARKET TECHNICAL ANALYZING REPORT
EUR/USD Technical Analysis Report with Fundamental Overview
Technical Analysis
Interpretation:
-
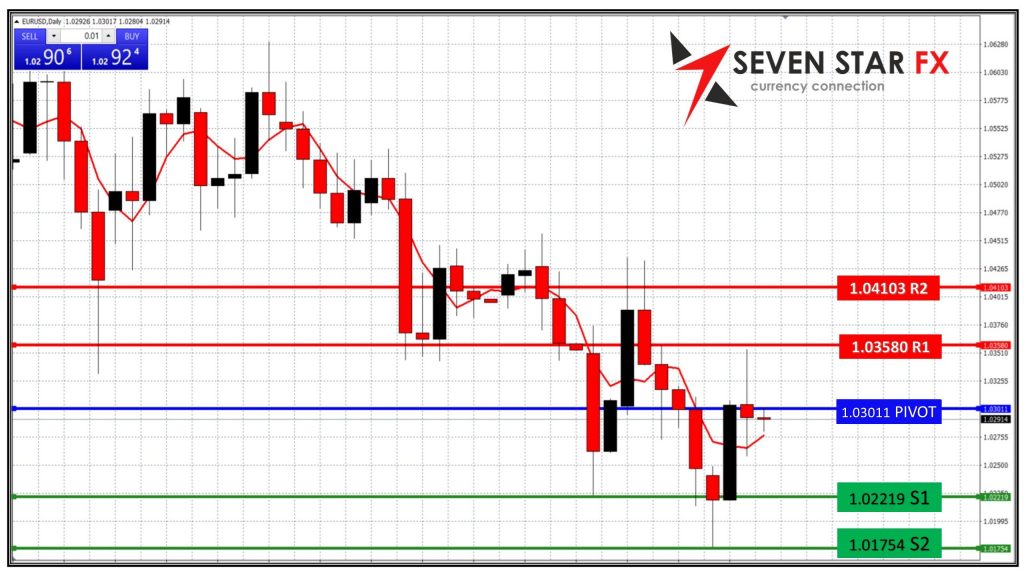
Pivot Point (P):
- The pivot point at 1.03011 is the central reference for the current trading range. If the price is above this point, bullish sentiment is suggested, while a price below indicates bearish sentiment. The current price closing near the pivot point indicates indecision in the market, where traders are waiting for a clearer direction.
-
Support Levels:
- S1 at 1.02490: A slight decline towards this level could see buying interest emerge. If the price moves below 1.02490, further support may be found at S2.
- S2 at 1.02055: A deeper move could suggest a stronger shift in market sentiment toward bearishness, though buying interest is expected around this level.
-
Resistance Levels:
- R1 at 1.03446: The first resistance level, where selling pressure could start to limit upward movements. If the price breaks this level, it would suggest more upside potential.
- R2 at 1.03967: A higher resistance that may contain any sharp rallies, as selling pressure could intensify beyond this point.
Current Market Sentiment:
- Bearish to Neutral: The price action today is contained within a narrow range between support and resistance levels, signaling consolidation or market indecision. The pivot point at 1.03011 plays a crucial role in determining the next potential movement.
Fundamental News:
-
European Central Bank (ECB) Policy:
- The ECB continues to adopt a dovish stance, with markets anticipating no aggressive rate hikes in the near term. Recent ECB comments emphasize the ongoing battle with inflation, although the current outlook remains neutral. This has placed downward pressure on the euro as market expectations shift towards lower rates.
-
Inflation Outlook in the Eurozone:
- Inflation in the Eurozone remains a key topic of concern. Recent data showed that inflation increased slightly to 2.4% in December, which is within the ECB’s target range. However, the ECB will continue to monitor inflation trends closely as it decides on future policy moves. Any unexpected rises in inflation could drive the ECB to maintain a hawkish stance, which would support the euro.
-
Economic Indicators:
- Trade Surplus: The Eurozone continues to post trade surpluses, which provides some support to the euro, as strong exports bolster the region’s economic position.
- Manufacturing PMI: Manufacturing activity remains subdued in key eurozone countries, with PMI figures suggesting contraction in the sector. This slowdown could weigh on future economic growth and the euro’s outlook.
Summary:
-
Technical Outlook: The EUR/USD is currently in a neutral to slightly bearish trend, with the price consolidating around the pivot point. Support levels at 1.02490 and 1.02055 should be watched closely for any signs of further weakness, while resistance at 1.03446 and 1.03967 could cap upside potential unless broken.
-
Fundamental Overview: While the ECB’s dovish outlook on interest rates and moderate inflation offer a mixed fundamental picture, economic indicators such as trade surpluses provide support to the euro. However, ongoing economic challenges, including subdued manufacturing activity, keep the currency’s outlook uncertain.
Disclaimer: This content is for informational purposes only and should not be construed as financial advice. Always conduct your own research or consult with a financial advisor before making any trading decisions.
GBP/USD Trading Strategy: Daily Analysis
GBP/USD Technical Analysis Report with Fundamental Overview
Technical Analysis
Interpretation:
-
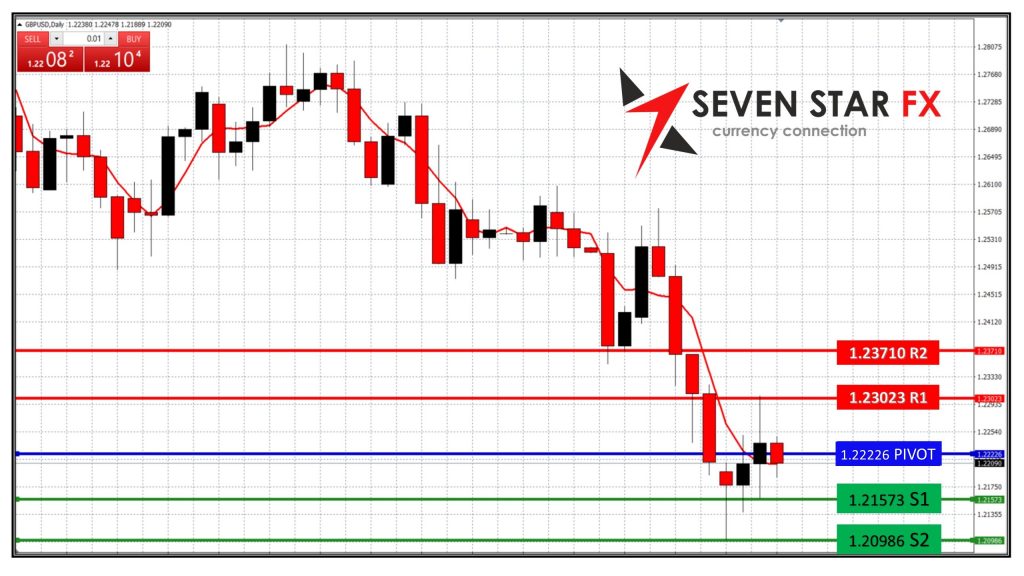
Pivot Point (P):
- The pivot point at 1.22229 is a significant reference for market sentiment. If the price is trading above this level, it implies a bullish outlook, while a price below suggests bearish sentiment. As the current close is slightly below this point, the market sentiment is somewhat neutral to bearish.
-
Support Levels:
- S1 at 1.21431: The first support level to watch. A break below this could signal further downward movement, and S2 becomes the next level to test.
- S2 at 1.20773: A deeper support level that could help slow a bearish move if the price continues to fall. Traders will look for buying interest around this level.
-
Resistance Levels:
- R1 at 1.22887: This is the first resistance level, where any upward move could face challenges. If the price breaches this level, it may signal a potential reversal or continuation of an uptrend.
- R2 at 1.23685: The higher resistance level that could hold back any significant upward momentum. A break above R2 would suggest more significant bullish potential.
Current Market Sentiment:
- Bearish to Neutral: The current price is trading just below the pivot point, indicating a more cautious or bearish sentiment. A move back above the pivot point at 1.22229 could indicate a shift to a bullish sentiment, targeting R1 and beyond.
Fundamental News:
-
Bank of England (BoE) Policy:
- The BoE’s monetary policy has been relatively cautious, given ongoing inflation concerns and slower economic growth in the UK. While the bank has indicated it may continue tightening rates to combat inflation, any signals of economic slowdown may prevent aggressive rate hikes. The BoE’s decisions remain highly data-dependent, with future inflation reports playing a significant role in GBP’s direction.
-
Inflation and Economic Data:
- The UK’s inflation remains above target, but it has shown signs of stabilization, which could influence the BoE’s stance on interest rates. Retail sales and employment data are critical to understanding the economic resilience of the UK. Stronger-than-expected data could provide support for the GBP, while weaker figures could reinforce bearish trends.
-
Brexit-Related Developments:
- The Brexit aftermath continues to influence the GBP. The UK’s economic relations with the European Union and any significant trade developments could either support or weigh on the pound. A positive shift in post-Brexit trade relations may help boost the currency, while any setbacks or regulatory concerns could dampen sentiment.
-
UK Economic Outlook:
- The UK economy has faced challenges in recent months, with growth slowing in key sectors. While the trade balance remains positive, the economy’s performance in the coming months will be crucial in determining the outlook for GBP. Economic growth figures, particularly in industrial production and services, will be key drivers for the currency.
Summary:
-
Technical Outlook: The GBP/USD remains in a neutral to slightly bearish stance. The key levels to watch are the pivot point at 1.22229 and support at 1.21431. If the price breaks through resistance at 1.22887, it could signal a reversal towards a more bullish outlook.
-
Fundamental Overview: The BoE’s cautious approach, inflation concerns, and ongoing Brexit developments continue to impact GBP. Any unexpected changes in economic data or BoE policy could lead to significant fluctuations in the currency.
Disclaimer: This content is for informational purposes only and should not be construed as financial advice. Always conduct your own research or consult with a financial advisor before making any trading decisions.
USD/JPY Trading Strategy: Daily Analysis
USD/JPY Technical Analysis Report with Fundamental Overview
Technical Analysis
Interpretation:
-
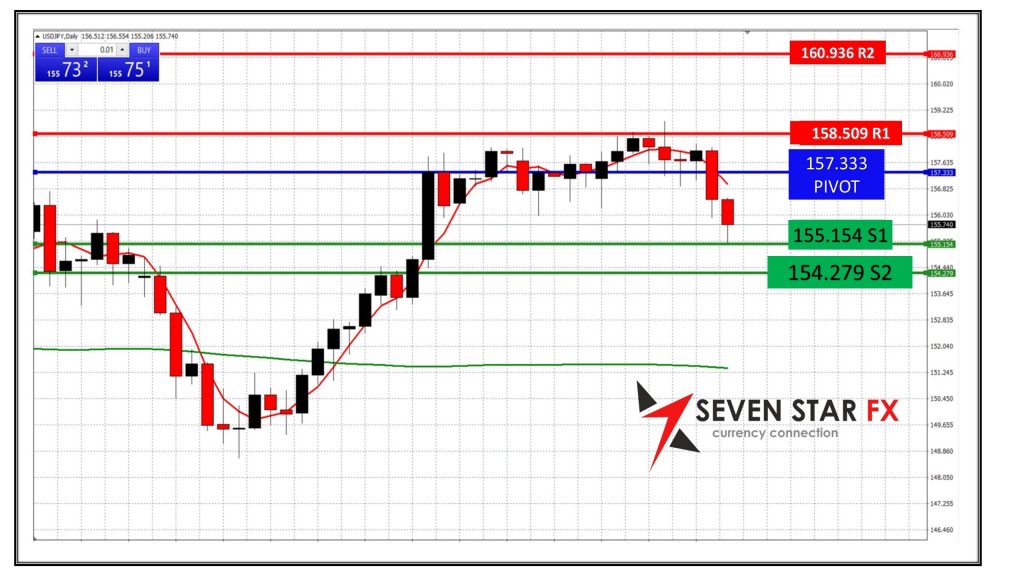
Pivot Point (P):
- The pivot point at 157.333 serves as the main point of reference for market sentiment. A price above this point indicates a bullish outlook, while below suggests bearish sentiment. With the current price near the pivot, market sentiment remains neutral, indicating consolidation with potential for either direction.
-
Support Levels:
- S1 at 156.195: A decline to this level could attract buying interest, preventing further downward movement. If broken, support at S2 becomes the next critical area.
- S2 at 154.862: A more substantial support level where buying interest might intensify, signaling a strong potential reversal if tested.
-
Resistance Levels:
- R1 at 158.661: The first resistance level, above which bullish momentum may gain strength. Breaking through this level would likely push prices higher.
- R2 at 159.794: A higher resistance level, where further selling pressure could potentially emerge, capping any rallies.
Current Market Sentiment:
- Neutral to Bullish: With the price trading near the pivot point of 157.328, the market sentiment remains largely neutral. A break above R1 would signal bullish momentum, while a decline below S1 would indicate a bearish trend.
Fundamental News:
-
Bank of Japan (BoJ) Policy:
- The BoJ’s monetary policy remains a key factor in driving JPY movements. The central bank has maintained a very accommodative stance, with ultra-low interest rates to support economic growth and inflation targets. Any signs that the BoJ may consider tightening its monetary policy would likely strengthen the JPY. However, there has been no indication that the BoJ will move towards tightening in the near future, continuing to weigh on the yen.
-
Inflation and Economic Data:
- Japan’s inflation has been moderate compared to other major economies. However, the BoJ’s policy has kept inflationary pressures in check, and the central bank has not shown signs of changing its course. If inflation expectations rise or the economy shows more robust growth, the BoJ may consider tightening, which would provide support for the yen.
- Economic Data such as GDP growth, industrial production, and export performance remain important to monitor. Better-than-expected data could suggest a stronger recovery and lend strength to the JPY, while disappointing figures could exacerbate the weak yen.
-
Global Risk Sentiment:
- The JPY is a safe-haven currency, which tends to strengthen in times of geopolitical tension or market volatility. If global risk sentiment worsens, the JPY could appreciate as investors seek safe assets. Conversely, if global risk sentiment improves and investors move toward riskier assets, the yen could weaken further.
-
Japan’s Trade Balance and Global Relations:
- Japan’s trade balance and export performance remain crucial for the strength of the JPY. Any disruptions to trade or slower-than-expected growth in major export markets could have a negative impact on the currency.
Summary:
-
Technical Outlook: The JPY/USD pair is in a neutral trend, with the pivot point at 157.328 indicating indecision. If the price breaks above resistance at 158.661, a bullish trend is likely. Conversely, if it falls below support at 156.195, a bearish outlook may be established.
-
Fundamental Overview: The BoJ’s dovish stance and moderate inflation continue to weigh on the yen, while any signs of global risk aversion or unexpected economic data may provide support for the currency. Global economic conditions and Japan’s trade data will be key to the JPY’s direction.
Disclaimer: This content is for informational purposes only and should not be construed as financial advice. Always conduct your own research or consult with a financial advisor before making any trading decisions.
AUD/USD Trading Strategy: Daily Analysis
AUD/USD Technical Analysis Report with Fundamental Overview
Technical Analysis
Interpretation:
-
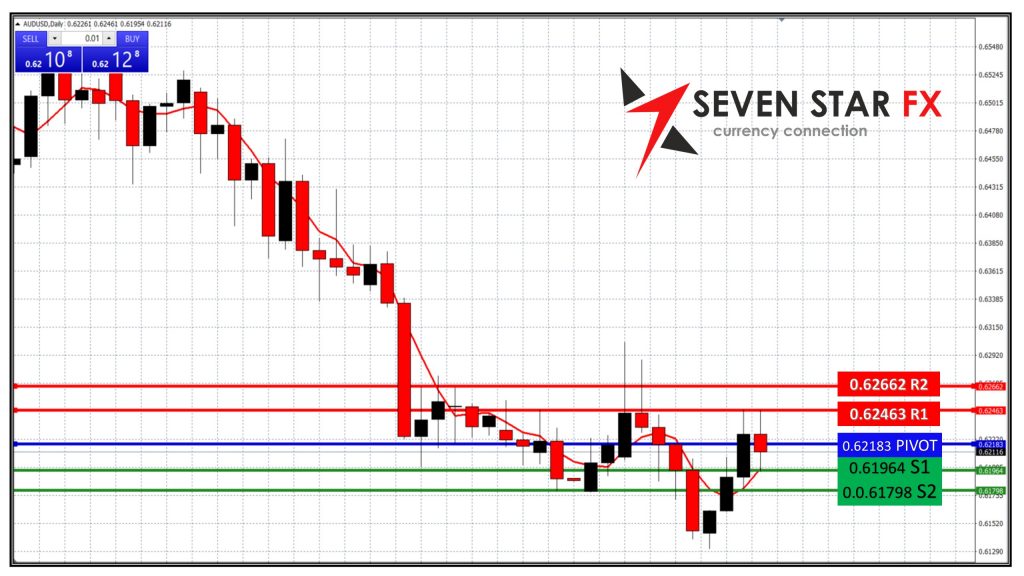
Pivot Point (P):
- The pivot point at 0.62183 acts as the central reference for market sentiment. If the price is trading above the pivot, a bullish outlook is suggested, whereas below it signals a bearish sentiment. The current price is near the pivot point, showing consolidation and indecision in the market.
-
Support Levels:
- S1 at 0.61948: A decline to this level may trigger buying interest, providing support if the market tests lower levels. A break below this could open the door for further downside movement, with S2 acting as the next line of defense.
- S2 at 0.61621: A deeper level of support where strong buying interest could emerge, potentially preventing further depreciation of the AUD.
-
Resistance Levels:
- R1 at 0.62410: The first resistance level to watch. If the price rises above this level, it may signal a continuation of the upward movement, with potential to test R2.
- R2 at 0.62653: A higher resistance level where further price increases could face selling pressure. Breaking this level would suggest that the pair could move higher in the medium term.
Current Market Sentiment:
- Neutral to Slightly Bullish: The price is hovering around the pivot point, indicating market indecision. A break above 0.62410 (R1) could signal the start of a bullish trend, while a drop below 0.61948 (S1) would reinforce a bearish sentiment.
Fundamental News:
-
Reserve Bank of Australia (RBA) Policy:
- The RBA’s monetary policy is crucial in determining the strength of the AUD. The central bank has been cautious with interest rate hikes, given the uncertain global economic outlook and domestic economic conditions. The RBA is likely to keep its policy accommodative for the time being, with a focus on supporting economic growth and addressing inflationary pressures. Any surprise rate hikes could offer short-term support to the AUD.
-
Economic Data:
- Australia’s inflation rate remains a key driver for the RBA’s decisions. While inflationary pressures have moderated in recent months, the central bank remains vigilant, especially with rising global commodity prices.
- Employment Data and Retail Sales are key indicators to monitor for insights into the overall health of the Australian economy. Strong data could provide upward pressure on the AUD, while disappointing figures could limit the currency’s potential to rise.
-
Global Commodity Prices:
- As a major exporter of commodities, especially iron ore, coal, and gold, fluctuations in global commodity prices can significantly impact the Australian dollar. If commodity prices strengthen, the AUD tends to appreciate, while any downturns in the commodity market could weigh on the currency.
-
China’s Economic Outlook:
- Australia’s trade relationship with China is an essential aspect of the AUD’s performance. China’s economic growth affects demand for Australian exports. Any signs of slowdown or political tensions between the two nations could weigh on the AUD, while strong growth in China could provide support.
-
Global Risk Sentiment:
- The AUD is often viewed as a risk-sensitive currency. If global risk sentiment turns positive, driven by market optimism or improved economic data, the AUD may appreciate as investors seek higher returns. Conversely, any rise in global risk aversion or uncertainty could lead to a weakening of the AUD as investors flock to safer assets.
Summary:
-
Technical Outlook: The AUD/USD remains in a neutral range with consolidation around the pivot point at 0.62181. The key levels to watch are 0.62410 (R1) for potential bullish breakout and 0.61948 (S1) for further downside. The pair is likely to stay range-bound unless a clear break occurs at these levels.
-
Fundamental Overview: The RBA’s cautious approach to monetary policy, ongoing inflation concerns, and Australia’s trade relationships with China and global commodity market trends will play a crucial role in determining the AUD’s trajectory. Economic data such as employment and retail sales will be key factors in assessing the currency’s outlook.
Disclaimer: This content is for informational purposes only and should not be construed as financial advice. Always conduct your own research or consult with a financial advisor before making any trading decisions.
Crude Oil Trading Strategy: Daily Analysis
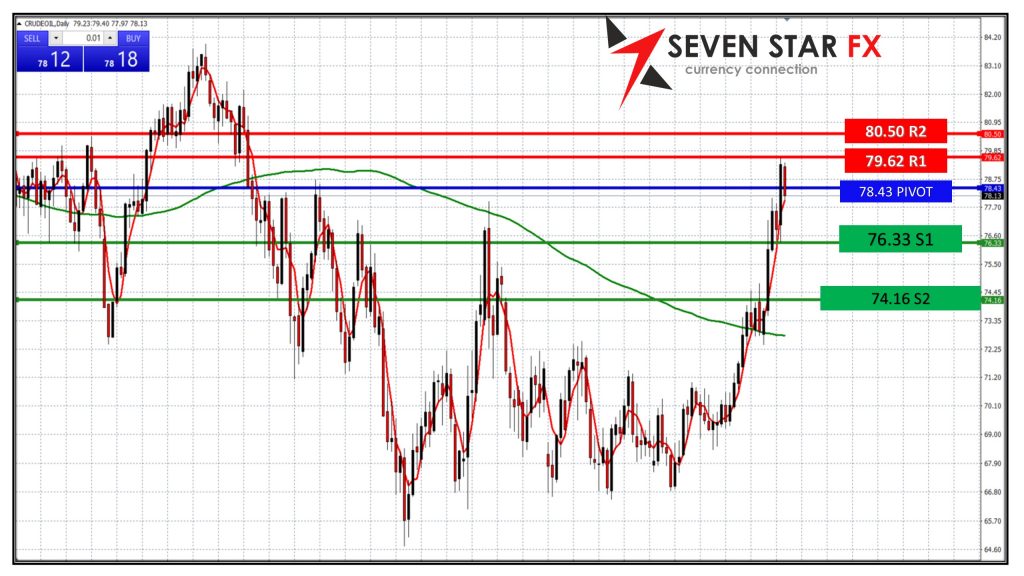
Crude Oil Technical Analysis Report with Fundamental Overview
Technical Analysis
Interpretation:
-
Pivot Point (P):
- The pivot point at 78.43 is central to determining market sentiment. A price above this level suggests a bullish outlook, whereas trading below it may indicate a bearish bias. The current close at 79.34 suggests a neutral to slightly bullish sentiment, as it is trading above the pivot.
-
Support Levels:
- S1 at 77.62: The first support level, which could act as a base for further upward movement if tested. If this level is breached, support at S2 would become more significant.
- S2 at 76.11: A more significant support level. If prices move lower and break S1, S2 would be the next major level where buying pressure could emerge.
-
Resistance Levels:
- R1 at 80.21: The first resistance level. A break above this level would likely signal continued bullish momentum, potentially leading the price towards R2.
- R2 at 81.52: The higher resistance level where any rallies could face strong selling pressure. Breaking this level could set the stage for a more significant upward move.
Current Market Sentiment:
- Neutral to Slightly Bullish: The price is currently trading above the pivot point, suggesting a neutral to slightly bullish market sentiment. If crude oil prices continue to trade above 79.34 and break above R1 at 80.21, a more sustained bullish trend could emerge. However, the support levels at 77.62 and 76.11 may contain any downward movements.
Fundamental News:
-
OPEC+ Decisions:
- The most recent OPEC+ meeting saw the organization maintaining production cuts in an effort to stabilize prices amidst fluctuating demand. Any signals from OPEC+ about adjusting production targets, whether increasing or decreasing, will likely have a significant impact on crude oil prices. The group’s actions are closely watched, as they can influence global supply and, consequently, market sentiment.
-
Global Demand Outlook:
- Global oil demand continues to be a critical factor for crude oil prices. Demand from major economies such as the United States, China, and India plays a large role in driving prices. Any signs of economic slowdowns or disruptions in major energy-consuming countries could weigh on demand and pressure prices lower. On the other hand, stronger-than-expected economic recovery could push prices higher.
-
U.S. Dollar Movement:
- The U.S. dollar typically has an inverse relationship with oil prices. A stronger dollar tends to pressure oil prices lower, while a weaker dollar can boost oil prices as it makes crude oil cheaper for foreign buyers. Thus, any shifts in dollar strength or weakness can have a notable impact on oil market dynamics.
-
Geopolitical Tensions:
- Geopolitical instability in key oil-producing regions, such as the Middle East, can lead to supply disruptions, which typically push oil prices higher. Conversely, easing tensions or increased stability could reduce the risk premium on oil, possibly causing prices to fall.
-
Energy Transition and Supply Chain Issues:
- Energy transition efforts, particularly in terms of moving toward cleaner energy sources, continue to shape long-term oil market dynamics. Additionally, supply chain disruptions (such as transportation bottlenecks or logistical challenges) can impact crude oil availability, influencing short-term pricing volatility.
-
U.S. Crude Oil Inventory Data:
- Weekly reports on U.S. crude oil inventories provide crucial information about supply levels. A rise in inventories suggests lower demand or oversupply, which typically puts downward pressure on oil prices. A decline in inventories indicates strong demand, which can help support higher prices.
Summary:
-
Technical Outlook: The crude oil market is currently in a neutral to slightly bullish phase. The key levels to watch are the pivot point at 78.43, with resistance at 80.21 (R1) and support at 77.62 (S1). A break above resistance may signal the continuation of the upward trend, while a move below support levels could lead to a bearish outlook.
-
Fundamental Overview: The ongoing actions by OPEC+, global economic recovery, U.S. dollar movements, and geopolitical tensions are all major factors affecting crude oil prices. The market is highly sensitive to shifts in demand from key economies, and any disruption in supply chains or geopolitical events could lead to price volatility.
Disclaimer: This content is for informational purposes only and should not be considered financial advice. Always perform your own research or consult with a qualified financial advisor before making any trading decisions.
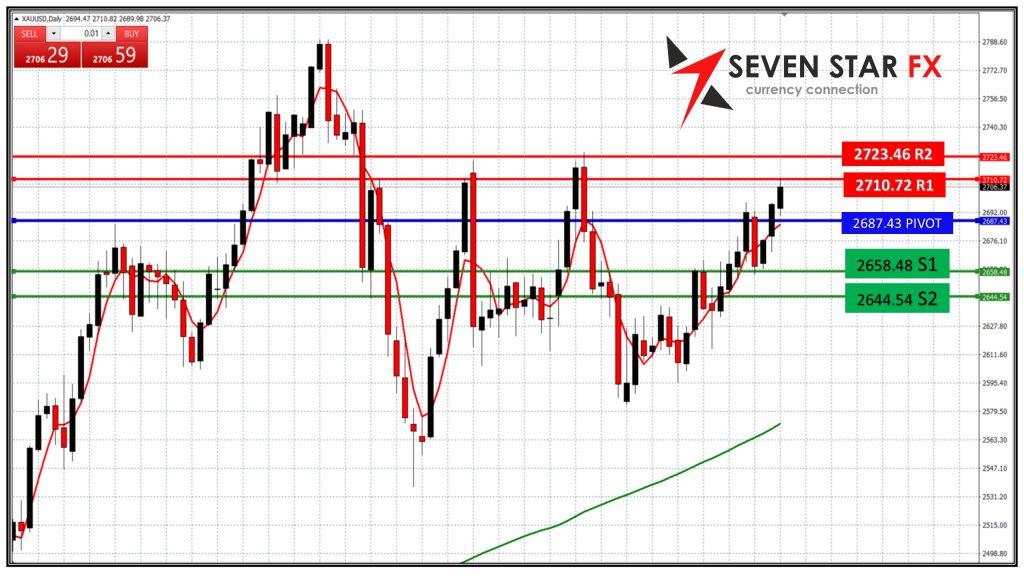
XAU/USD Trading Strategy: Daily Analysis
XAU/USD Technical Analysis Report with Fundamental Overview
Technical Analysis
Interpretation:
-
Pivot Point (P):
- The pivot point at 2687.43 is the key reference for market sentiment. Trading above this level generally indicates a bullish outlook, while trading below it signals a bearish trend. The current close at 2696.16 is above the pivot, suggesting that the sentiment is slightly bullish for gold.
-
Support Levels:
- S1 at 2674.57: The first support level that may provide buying interest if the price drops. A breach below this level would expose the next support at S2.
- S2 at 2661.70: A more significant support level. If prices fall further, this level may attract stronger buying pressure, preventing further downside.
-
Resistance Levels:
- R1 at 2703.03: The first resistance level. A break above this would signal continued bullish momentum, potentially pushing gold prices towards R2.
- R2 at 2714.91: A higher resistance level that could potentially halt upward movement. A break above R2 would suggest an extended bullish rally in the near term.
Current Market Sentiment:
- Neutral to Slightly Bullish: Gold is trading above the pivot point, suggesting a neutral to slightly bullish outlook. If the price continues to hold above the pivot and breaks through R1 at 2703.03, further upside could be expected. A fall below S1 at 2674.57 would indicate potential downside pressure.
Fundamental News:
-
U.S. Dollar and Gold Prices:
- The U.S. dollar is inversely correlated with gold. A stronger dollar typically puts downward pressure on gold prices, while a weaker dollar provides upward support for the precious metal. The current price action in the dollar, driven by U.S. economic data and Federal Reserve policies, will likely continue to influence gold prices.
-
Federal Reserve Policy:
- The U.S. Federal Reserve’s monetary policy remains a crucial factor for gold. If the Fed maintains a dovish stance with lower interest rates, it supports the price of gold as an alternative investment. Conversely, if the Fed signals tightening or increases interest rates, gold could face downward pressure.
- Inflation concerns in the U.S. also play a role in gold’s appeal as a hedge against inflation. Any signs that inflation is accelerating could provide support for gold, driving its price higher.
-
Geopolitical Tensions and Safe-Haven Demand:
- Gold is often seen as a safe-haven asset in times of geopolitical uncertainty or market volatility. Any geopolitical tension, such as conflicts in the Middle East, or financial instability, can boost demand for gold as a protective measure. Similarly, if global economic conditions worsen, investors tend to flock to gold.
-
Economic Data and Gold Demand:
- U.S. economic data, such as GDP growth, employment reports, and retail sales, can directly impact gold prices. Strong data can reduce the demand for gold as a safe-haven, while weak data may increase demand for the precious metal.
- Additionally, global gold demand from central banks, investors, and jewelry sectors plays a role in determining gold prices. A pickup in gold purchases by central banks or increased investor interest can support higher prices.
-
Global Inflation and Central Bank Policies:
- Global inflation trends continue to impact gold’s role as an inflation hedge. As inflation concerns rise, investors often turn to gold as a store of value. Central bank policies, especially in major economies like the U.S., the Eurozone, and China, will affect global inflation expectations and, consequently, gold demand.
Summary:
-
Technical Outlook: Gold is currently in a neutral to slightly bullish phase, trading above the pivot point at 2687.53. The key levels to watch are R1 at 2703.03 for potential bullish continuation, and S1 at 2674.57 as a critical support level. A break above R2 at 2714.91 would signal a more substantial rally, while a decline below S1 may suggest further downside pressure.
-
Fundamental Overview: The Federal Reserve’s policy stance, U.S. dollar movements, geopolitical tensions, and global inflation concerns will continue to be the primary drivers of gold prices. The demand for gold as a safe-haven asset, coupled with central bank and inflation dynamics, will determine the near-term outlook for the precious metal.
Disclaimer: This content is for informational purposes only and does not constitute financial advice. Always conduct your own research or consult with a financial advisor before making any trading decisions.
Dow Jones Trading Strategy: Daily Analysis
Dow Jones Technical Analysis Report with Fundamental Overview
Technical Analysis
Interpretation:
-
Pivot Point (P):
- The pivot point at 43023.54 is the key reference for the market’s current sentiment. Trading above this level indicates a bullish outlook, while trading below it suggests a bearish sentiment. With the current close at 43222.75, which is slightly above the pivot, market sentiment leans toward being bullish.
-
Support Levels:
- S1 at 42905.29: If the market tests lower levels, this support may provide some buying interest and act as a buffer against further downside. A break below this level would open up the next support level at S2.
- S2 at 42688.48: This is a stronger support level where buying activity may intensify. A fall to this level could signal a significant correction, and traders may look for buying opportunities at or near this level.
-
Resistance Levels:
- R1 at 43439.84: A key resistance level. If the price breaks above this level, it could signal the continuation of bullish momentum, driving the index toward R2.
- R2 at 43657.97: The next resistance level. If the market reaches this level and struggles to break through, selling pressure could emerge, potentially capping any upward movement.
Current Market Sentiment:
- Neutral to Bullish: With the Dow Jones trading just above the pivot point, market sentiment remains neutral to slightly bullish. If the index breaks above R1 at 43439.84, bullish momentum is likely to continue. However, if it falls below the pivot and S1 at 42905.29, a more bearish outlook could emerge.
Fundamental News:
-
U.S. Economic Data:
- Economic indicators such as GDP growth, unemployment rates, and consumer spending will play a crucial role in shaping investor sentiment for the Dow Jones. Strong economic data generally supports the equity market, while weaker-than-expected data can lead to a sell-off, impacting the performance of the index.
-
Federal Reserve Policy:
- The Federal Reserve’s monetary policy has a significant impact on the stock market, particularly on large-cap companies that dominate the Dow. Interest rate decisions, statements about economic growth, and inflation targets are all factors that influence market direction. The Fed’s stance on inflation, particularly whether they will raise or lower rates, will impact investor confidence in the stock market.
-
Corporate Earnings Season:
- The corporate earnings reports from major Dow-listed companies are important drivers of the index’s movement. Strong earnings results typically lead to bullish sentiment, while weak results can weigh on the index. Earnings projections, profit margins, and revenue growth are particularly significant.
-
Global Trade and Geopolitical Events:
- Global trade tensions and geopolitical instability can influence the Dow Jones. Events such as changes in trade policies, tariffs, or major geopolitical events like military conflicts can cause market uncertainty. In particular, trade relations between the U.S. and key economies, such as China or the European Union, could have a significant impact.
-
Inflation and Consumer Confidence:
- Inflationary pressures have been a key concern for the broader economy. High inflation can reduce consumer spending and affect corporate profits. Monitoring inflation rates and consumer confidence indexes will provide insights into future market movements. Rising inflation could also influence the Fed’s policy decisions, which in turn will affect the market.
-
Global Economic Conditions:
- The global economic outlook, particularly in major economies such as China, the Eurozone, and emerging markets, can impact U.S. multinational companies. A slowdown in global growth or trade disruptions could weigh on the performance of Dow-listed companies with significant international exposure.
-
U.S. Dollar Strength:
- The strength of the U.S. dollar has an inverse relationship with the stock market. A stronger dollar can make U.S. exports more expensive, potentially reducing profits for multinational companies. Conversely, a weaker dollar can benefit exporters and potentially support higher equity prices.
Summary:
-
Technical Outlook: The Dow Jones index is showing a neutral to slightly bullish outlook, with key resistance at 43439.84 (R1) and support at 42905.29 (S1). A break above resistance could signal a continuation of the upward trend, while a move below support levels would indicate potential downside risk.
-
Fundamental Overview: Economic data, Federal Reserve policy, corporate earnings, geopolitical developments, and inflationary pressures are crucial to the Dow’s performance. The market’s reaction to economic reports and central bank policy will drive the index’s movements in the short to medium term.
————————————————————————————————————————————————————————————————————————————-
Disclaimer: This content is for informational purposes only and should not be considered as financial advice. Always perform your own research or consult a financial advisor before making any trading decisions.
Disclaimer: The figures provided are based on current technical analysis and should not be considered financial advice. Always seek guidance from a professional financial advisor before engaging in forex trading.
Notice: The data presented is derived from technical analysis and does not constitute financial advice. For those trading in forex, consulting a qualified financial advisor prior to making investment decisions is strongly recommended.
Caution: The information above reflects ongoing technical analysis and should not be interpreted as financial advice. Forex trading involves high volatility, and without proper knowledge, you risk losing all your capital. It is essential to consult with a financial advisor before investing.
Advisory: The insights shared are the result of technical analysis and are not intended as financial advice. Forex traders should seek advice from professional financial advisors before making any investment decisions. Remember, the forex market is highly volatile, and trading without adequate knowledge can lead to significant losses.
Important: The analysis provided is for informational purposes only and should not be seen as financial advice. Forex trading carries substantial risks, and it is advisable to consult financial advisors before proceeding with any investments. This content is intended solely for Wealth Management Education purposes.