Market Wrap: Stocks, Bonds, Commodities
Wall Street’s main indices gained on Tuesday, shaking off an unconfirmed report of Russian missiles crossing into Poland that sparked volatility, as investors seized on softer-than-expected inflation data that raised hopes of a pullback in rate hikes by the US Federal Reserve.
The Dow Jones Industrial Average rose 56.22 points to 33,592.92, the S&P 500 gain 34.48 points to 3,991.73 and the Nasdaq Composite add 162.19 points to 11,358.41.
MSCI’s index of Asia-Pacific stocks outside Japan is drop 0.70% to 608.77 levels. Australian index lower 0.27% to 7,122.20. Japanese Nikkei Index ascend 0.14% to 28,028.30.
European stocks were mixed on Wednesday, with the Stoxx Europe 50 Index fell 0.13% to 3,909.85, Germany’s DAX drop 0.26% to 14,342.28, and France’s CAC down 0.13% to 6,633.09, and U.K.’s FTSE 100 surged 0.12% to 7,377.87.
Benchmark 10-year U.S. Treasury fell as demand for safe assets ascend again, today 10-year bond yields a positive 0.45% to 3.8160.
Oil prices rose on Tuesday and settled higher after news that oil supply to Hungary via the Druzhba oil pipeline has been temporarily suspended due to a fall in pressure.
Spot Brent crude oil subtract 0.37% to $93.53 per barrel. US West Texas Intermediate crude is down 0.55% to $86.45 a barrel.
The yellow metal gold is advance 0.15% to 1,779.60 dollars per ounce.
Market Wrap: Forex
The safe-haven U.S. dollar’s early gains fizzled following volatile trading on Wednesday as traders took comfort from U.S. President Joe Biden’s remarks that a missile that caused a explosion in Poland may not have been fired from Russia.
Today, the U.S. dollar index measures the Greenback against a trade-weighted basket of six major currencies, which is fell 0.16% to 106.130.
The Euro US Dollar (EUR/USD) is a widely traded pair that is up 0.46% today. This left the pair trading around $1.03960.
The Japanese yen was positive against the U.S. dollar on Wednesday as the stock up. Today USD/JPY is ascend 0.20% to 139.560 level.
Another commodity-related currency positive against the U.S dollar, AUD/USD surged 0.19% to 0.67680, and NZD/USD up 0.15 to 0.61660 level.
EUR/USD Intraday: Major support level at 1.03520
Our pivot point is at 1.03520
Preferable Price Action: Take buy positions above pivot level with targets at 1.04970 & 1.06180 in extension.
Alternative Price Action: Below pivot looks for a further downside to 1.02330 & 1.01380.
Comment: RSI above 50 levels and Pairs above its 20MA & 55MA.
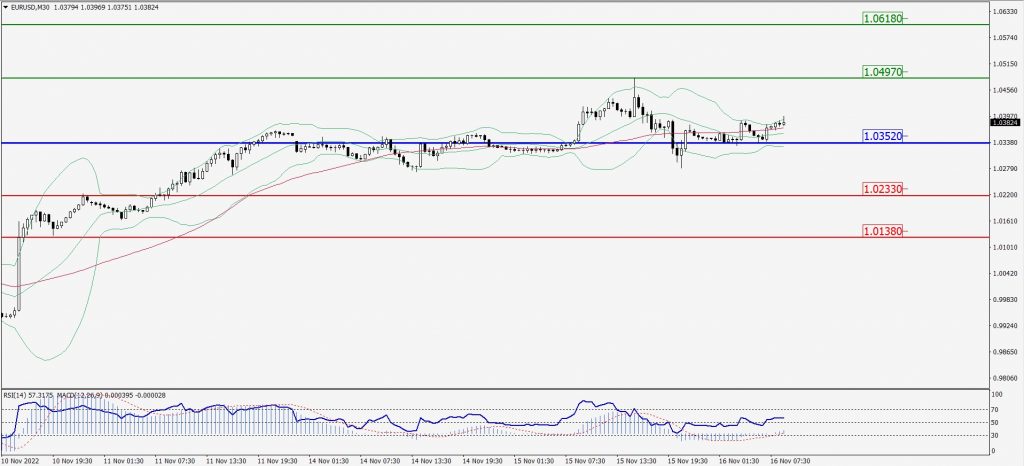
Green Lines Indicate Resistance Levels – Red Lines Indicate Support Levels
Light Blue is a Pivot Point – Black represents the price when the report was produced
GBP/USD Intraday: Resistance level at 1.19030
Our pivot point is at 1.19030
Preferable Price Action: Sell positions below pivot with targets at 1.17520 & 1.16390 in extension.
Alternative Price Action: The price above pivot would call for further upside to 1.20440 & 1.21570.
Comment: RSI below 50 levels and Pairs below 20MA.
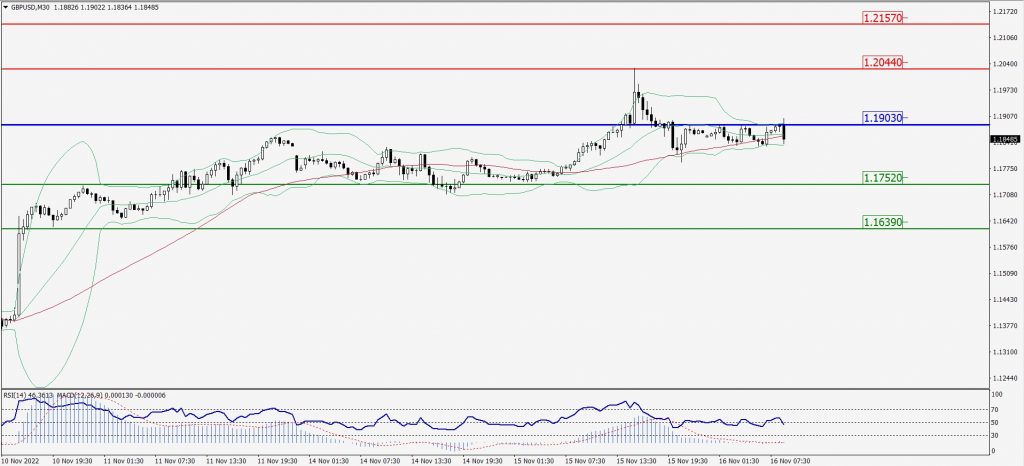
Green Lines Indicate Resistance Levels – Red Lines Indicate Support Levels
Light Blue is a Pivot Point – Black represents the price when the report was produced
USD/JPY Intraday: Trend on the upside
Our pivot point is at 139.310
Preferable Price Action: Buy position above pivot with the target at 141.250 and 142.700 in extension.
Alternative Price Action: The downside breakout of the pivot would call for 137.550 and 136.280.
Comment: MACD is positive territory and Pairs above its 20MA & 55MA.
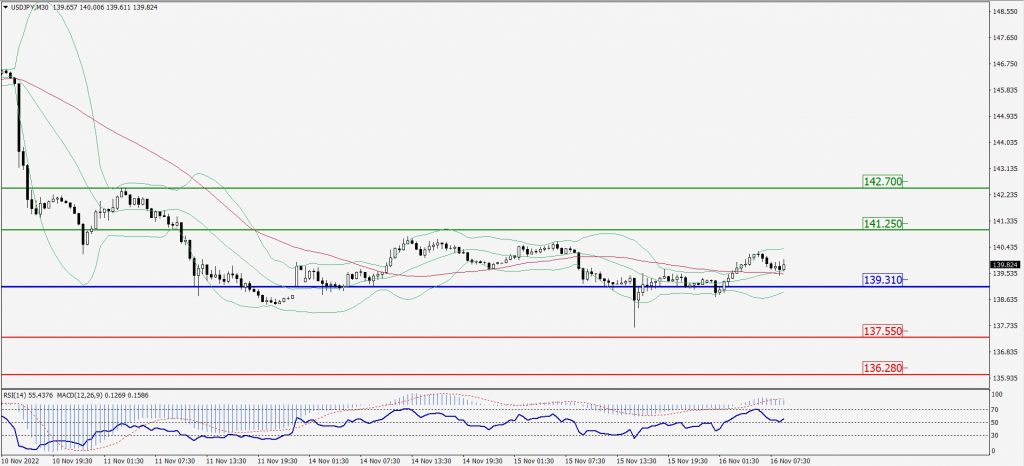
Green Lines Indicate Resistance Levels – Red Lines Indicate Support Levels
Light Blue is a Pivot Point – Black represents the price when the report was produced
AUD/USD Intraday: Trend on the upside
Our pivot point is at 0.67470
Preferable Price Action: Buy Positions above pivot with targets at 0.68380 & 0.69170 in extension.
Alternative Price Action: Below pivot looks for a further downside with 0.66610 & 0.65930 as targets.
Comment: RSI above 50 levels and Pairs above its 20MA & 55MA.
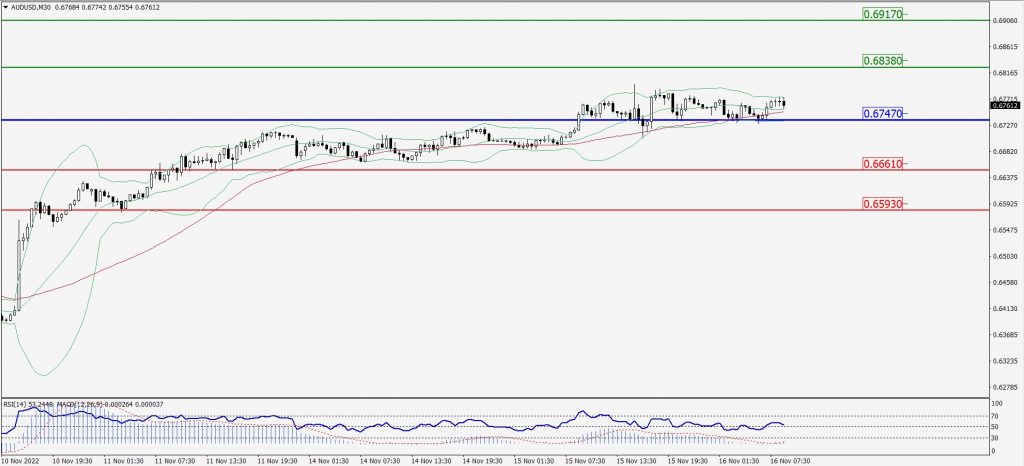
Green Lines Indicate Resistance Levels – Red Lines Indicate Support Levels
Light Blue is a Pivot Point – Black represents the price when the report was produced
CRUDEOIL Intraday: Trend on the downside
Our pivot point is at 86.49
Preferable Price Action: Below pivots sell oil with 83.98 & 82.17 as targets.
Alternative Price Action: Buy crude above pivot with targets at 88.63 and 90.42 in extension.
Comment: MACD is in the negative territory and Pairs below 20MA.
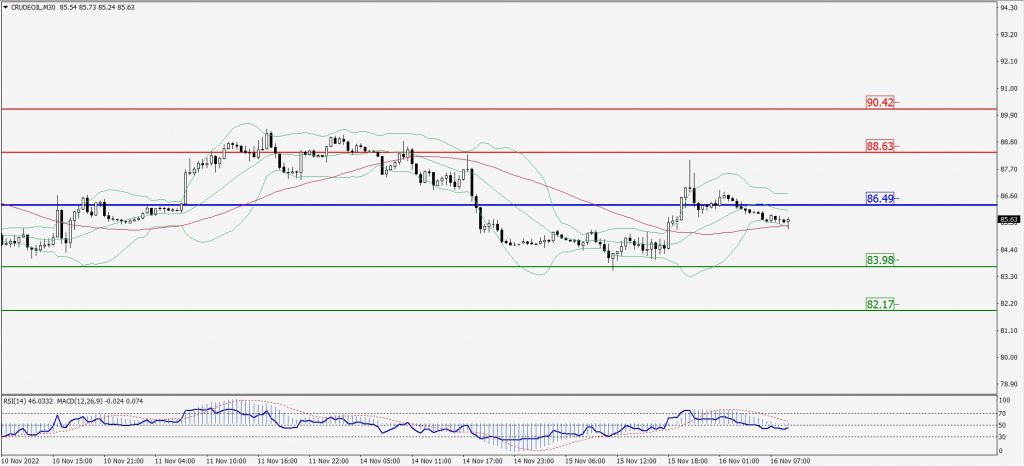
Green Lines Indicate Resistance Levels – Red Lines Indicate Support Levels
Light Blue is a Pivot Point – Black represents the price when the report was produced
XAU/USD Intraday: Major support level at 1781.40
Our pivot point is 1781.40
Preferable Price Action: Further downside to 1761.90 and 1749.50
Alternative Price Action: If the price gives an upside breakout of a pivot, then the price extends to 1796.10 and 1809.90.
Comment: MACD is negative territory and Pairs below its 20MA & 55MA.
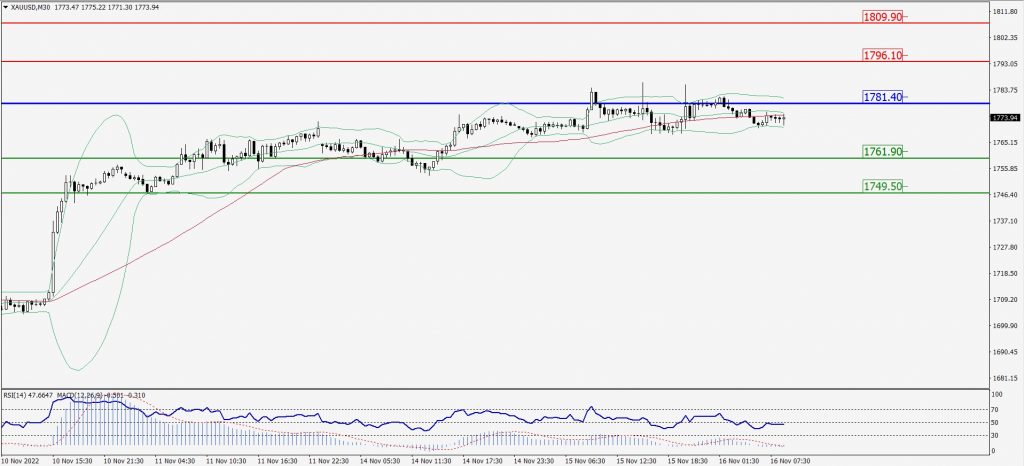
Green Lines Indicate Resistance Levels – Red Lines Indicate Support Levels
Light Blue is a Pivot Point – Black represents the price when the report was produced
Dow Jones Intraday: In a consolidation zone
Our pivot point is 33,580.00
Preferable Price Action: Take buy positions above pivot with targets at 33,902.00 & 34,171.00.
Alternative Price Action: Below 33,580.00 looks for further downside to 33,300.00 & 33,074.00.
Comment: RSI above 50 levels and Pairs above 20MA.
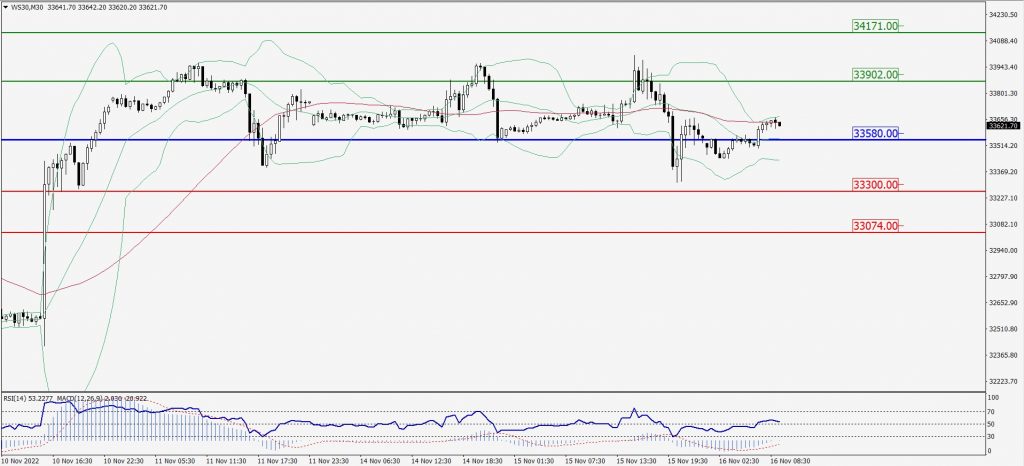
Green Lines Indicate Resistance Levels – Red Lines Indicate Support Levels
Light Blue is a Pivot Point – Black represents the price when the report was produced