Market Wrap: Stocks, Bonds, Commodities
Wall Street ended a directionless session higher on Wednesday as an on-target inflation report largely stanched the flow of Tuesday’s sell-off and investors hit the ‘pause’ button.
The Dow Jones Industrial Average rose 30.12 points to 31,135.09, the S&P 500 gain 13.32 points to 3,946.01 and the Nasdaq Composite add 86.10 points to 11,719.68.
MSCI’s index of Asia-Pacific stocks outside Japan is drop 0.13% to 616.71 levels. Australian index higher 0.21% to 6,842.90. Japanese Nikkei Index ascend 0.21% to 27,875.91.
European stocks were positive on Thursday, with the Stoxx Europe 50 Index rose 0.10% to 3,573.15, Germany’s DAX ascend 0.24% to 13,057.37, and France’s CAC add 0.02% to 6,223.22, and U.K.’s FTSE 100 surged 0.61% to 7,321.20.
Benchmark 10-year U.S. Treasury fell as demand for safe assets ascend again, today 10-year bond yields a positive 1.03% to 3.4470.
Oil prices edged upwards in early Asian trade on Thursday, as supply concerns and a looming rail stoppage in the United States, the world’s biggest crude consumer, supported markets.
Spot Brent crude oil subtract 0.79% to $93.37 per barrel. US West Texas Intermediate crude is down 0.82% to $87.78 a barrel.
The yellow metal gold is decline 0.74% to 1,696.35 dollars per ounce.
Market Wrap: Forex
The U.S. dollar pushed higher in early European trade Thursday, with buyers returning ahead of next week’s Federal Reserve meeting, while the yen struggled to hold the previous session’s gains.
Today, the U.S. dollar index measures the Greenback against a trade-weighted basket of six major currencies, which is rose 0.11% to 109.480.
The Euro US Dollar (EUR/USD) is a widely traded pair that is up 0.02% today. This left the pair trading around $0.99780.
The Japanese yen was positive against the U.S. dollar on Thursday as the stock up. Today USD/JPY is ascend 0.33% to 143.640 level.
Another commodity-related currency negative against the U.S dollar, AUD/USD slipped 0.04% to 0.67450, and NZD/USD down 0.02 to 0.60010 level.
EUR/USD Intraday: Trend on the downside
Our pivot point is at 1.00130
Preferable Price Action: Take sell positions below pivot level with targets at 0.99130 & 0.98330 in extension.
Alternative Price Action: Above pivot looks for a further upside to 1.01130 & 1.01920.
Comment: RSI below 50 levels and Pairs below its 20MA & 55MA.
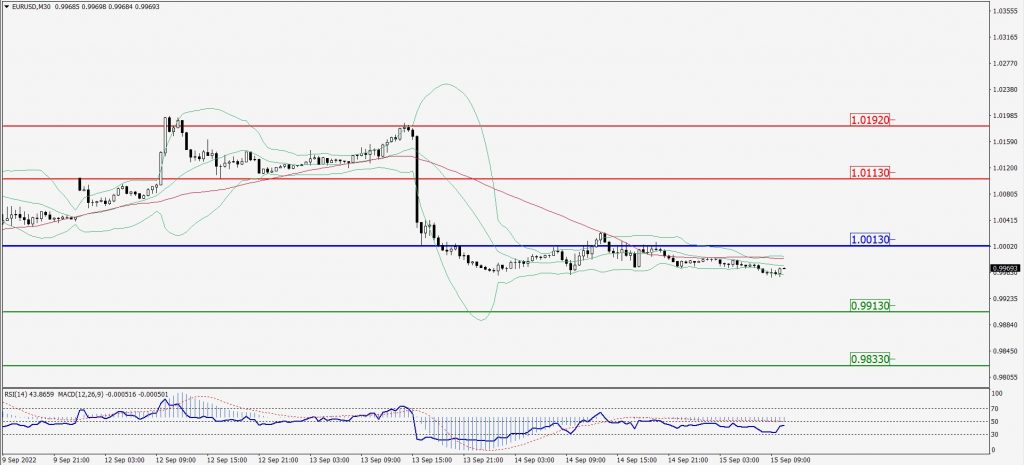
Green Lines Indicate Resistance Levels – Red Lines Indicate Support Levels
Light Blue is a Pivot Point – Black represents the price when the report was produced
GBP/USD Intraday: In a consolidation zone
Our pivot point is at 1.15020
Preferable Price Action: Buy positions above pivot with targets at 1.16010 & 1.16750 in extension.
Alternative Price Action: The price below pivot would call for further downside to 1.14190 & 1.13480.
Comment: RSI at 50 levels and Pairs above 20MA.
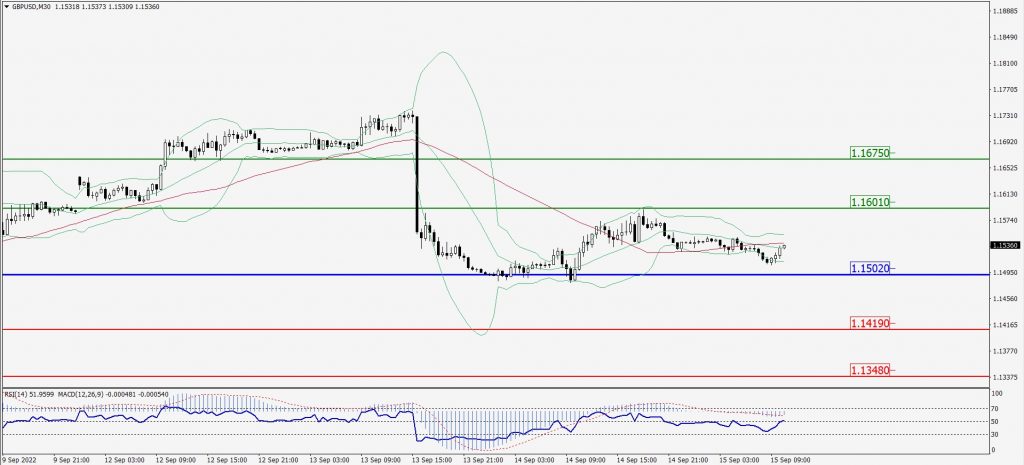
Green Lines Indicate Resistance Levels – Red Lines Indicate Support Levels
Light Blue is a Pivot Point – Black represents the price when the report was produced
USD/JPY Intraday: Trend on the upside
Our pivot point is at 143.380
Preferable Price Action: Buy position above pivot with the target at 144.220 and 144.900 in extension.
Alternative Price Action: The downside breakout of the pivot would call for 142.600 and 142.110.
Comment: MACD is positive territory and Pairs above its 20MA & 55MA.
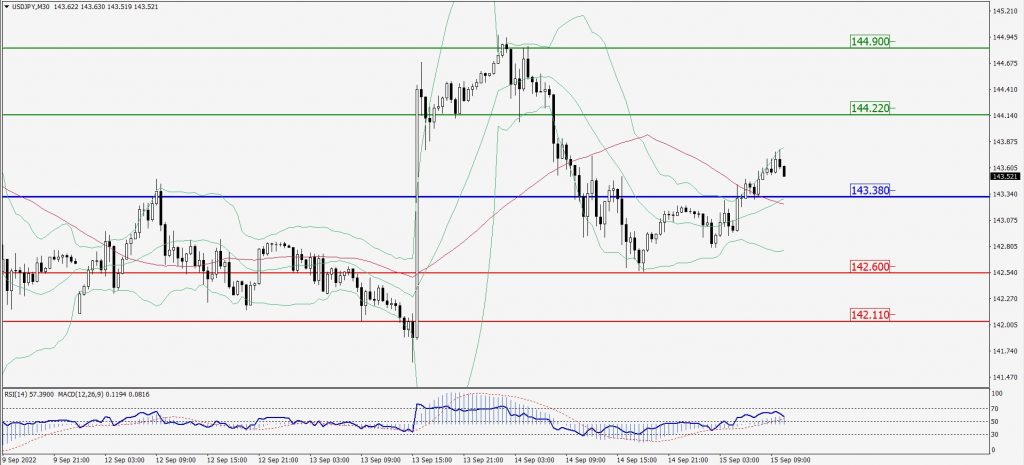
Green Lines Indicate Resistance Levels – Red Lines Indicate Support Levels
Light Blue is a Pivot Point – Black represents the price when the report was produced
AUD/USD Intraday: Support level at 0.67430
Our pivot point is at 0.67430
Preferable Price Action: Buy Positions above pivot with targets at 0.68010 & 0.68490 in extension.
Alternative Price Action: Below pivot looks for a further downside with 0.66840 & 0.66340 as targets.
Comment: RSI above 50 levels and Pairs above 55MA.
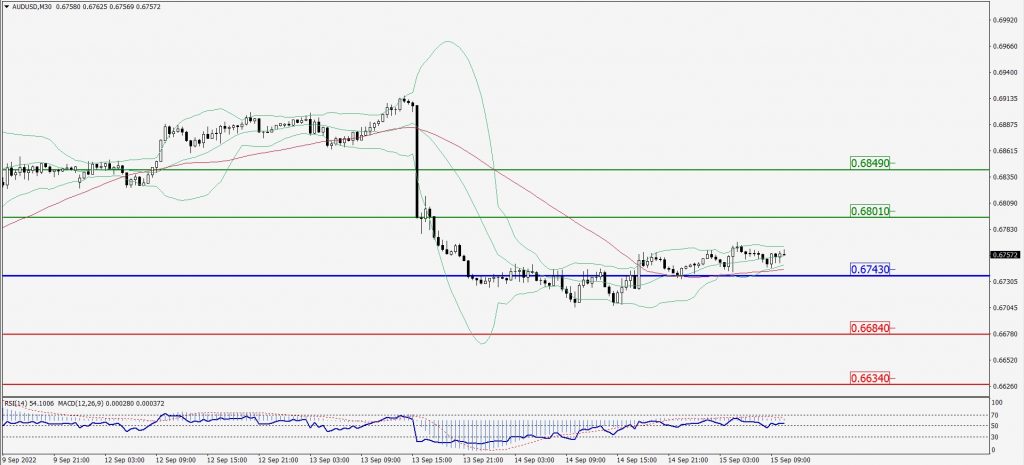
Green Lines Indicate Resistance Levels – Red Lines Indicate Support Levels
Light Blue is a Pivot Point – Black represents the price when the report was produced
CRUDEOIL Intraday: In a consolidation zone
Our pivot point is at 87.95
Preferable Price Action: Above pivots buy oil with 89.94 & 91.26 as targets.
Alternative Price Action: Sell crude below pivot with targets at 86.39 and 85.19 in extension.
Comment: MACD is in the positive territory and Pairs above 55MA.
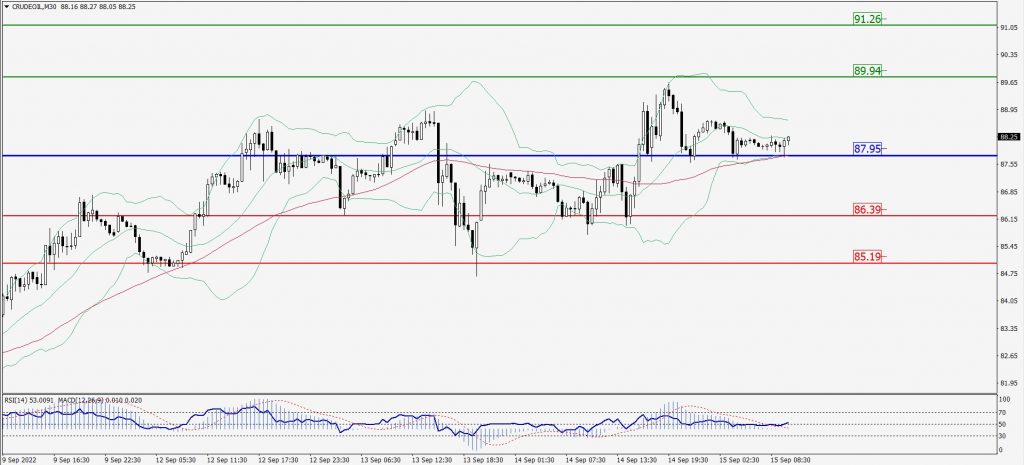
Green Lines Indicate Resistance Levels – Red Lines Indicate Support Levels
Light Blue is a Pivot Point – Black represents the price when the report was produced
XAU/USD Intraday: Trend on the downside
Our pivot point is 1696.40
Preferable Price Action: Further downside to 1678.20 and 1666.20
Alternative Price Action: If the price gives an upside breakout of a pivot, then the price extends to 1714.10 and 1727.30.
Comment: MACD is negative territory and Pairs below its 20MA & 55MA.
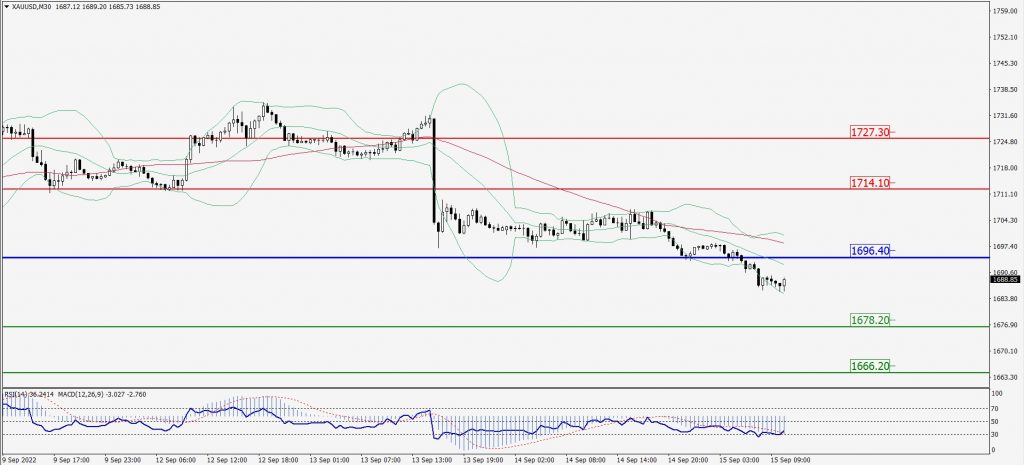
Green Lines Indicate Resistance Levels – Red Lines Indicate Support Levels
Light Blue is a Pivot Point – Black represents the price when the report was produced
Dow Jones Intraday: In a consolidation zone
Our pivot point is 31,058.00
Preferable Price Action: Take buy positions above pivot with targets at 31,565.00 & 31,916.00.
Alternative Price Action: Below 31,058.00 looks for further downside to 30,689.00 & 30,306.00.
Comment: RSI above 50 levels and Pairs above 55MA.
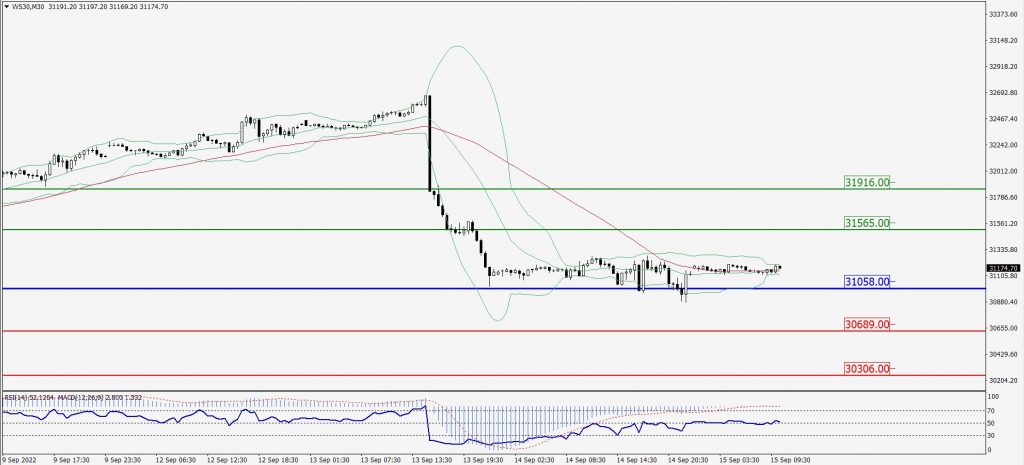
Green Lines Indicate Resistance Levels – Red Lines Indicate Support Levels
Light Blue is a Pivot Point – Black represents the price when the report was produced