Market Wrap: Stocks, Bonds, Commodities
Wall Street stocks closed higher on Friday, with market-leading growth shares kick-starting a rise for the indices as investors looked past the disappointing US economic data. Despite their advances, all three major US stock indices ended the session below last Friday’s close, ending a five-week streak of weekly gains.
The Dow Jones Industrial Average rose 179.08 points (0.50%) to 36,100.31. The S&P 500 gained 33.58 points (0.72%) at 4,682.85 and the Nasdaq Composite added 156.68 points (1.00%) at 15,860.96.
MSCI’s index of Asia-Pacific stocks outside Japan is rose 0.28% to 825.54 levels. Australian index gained 0.36% to 7,470.10. Japanese Nikkei Index higher 0.56% to 29,776.80.
European stocks were higher on Monday, with the Stoxx Europe 50 Index gaining 0.06% to 4,373.10, Germany’s DAX rose 0.07% to 16,105.68, and France’s CAC gained 0.22% to 7,107.62, and U.K.’s FTSE 100 advance 0.19% to 7,363.08.
Benchmark 10-year U.S. Treasury rose as demand for safe assets grows again, today 10-year bond yields fell 1.76% to 1.556.
Crude oil prices skidded on Monday, under pressure from expectations of higher supplies and weakening demand.
Spot Brent crude oil fell 0.88% to $81.45 per barrel. US West Texas Intermediate crude slipped 0.87% to $79.00 a barrel.
The yellow metal traded 0.50% lower to 1859.25 dollars per ounce.
Market Wrap: Forex
The dollar eased back from near an almost 16-month high versus major peers on Monday, as traders awaited fresh clues on the U.S. economy after bringing forward bets last week for a Federal Reserve interest rate hike on the back of red-hot inflation.
Today, the U.S. dollar index measures the greenback against a trade-weighted basket of six major currencies, which fell 0.13% to 95.002.
The Euro US Dollar (EUR/USD) is a widely traded pair that is rose 0.05% today. This left the pairing trading around $1.14560.
The Japanese yen fell against the U.S. dollar on Monday as the stock pushes higher. Today US/JPY is advanced 0.07% to 113.940 level.
Another commodity-related currency higher against the U.S dollar, AUD/USD rose 0.22% to 0.73500, and NZD/USD gained 0.15% to 0.70570 level.
EUR/USD Intraday: In a consolidation zone
Our pivot point is at 1.14770
Preferable Price Action: Take Short positions Below pivot level with targets at 1.14190 & 1.13840 in extension.
Alternative Price Action: Above pivot looks for a further Upside to 1.15350 & 1.15680.
Comment: Pair below its 55MA & 20MA and RSI below 50 levels.
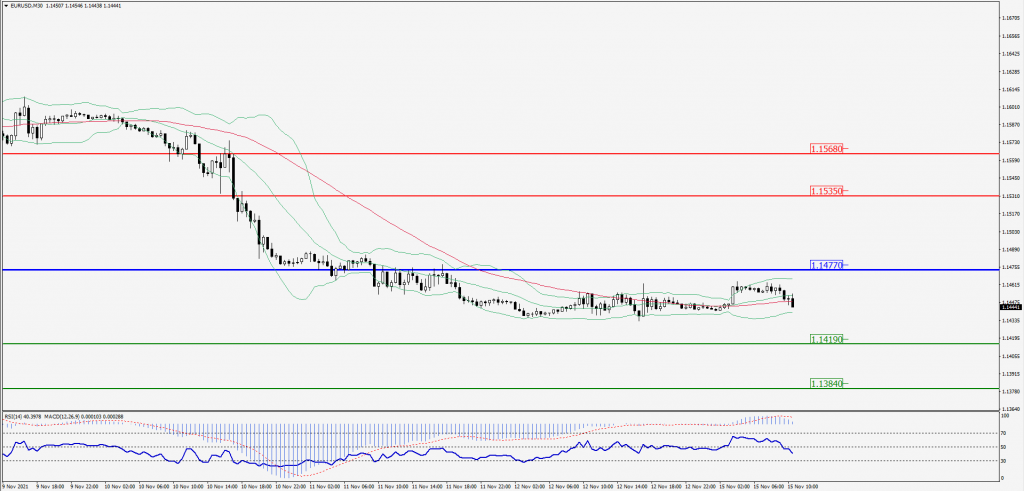
Green Lines Indicate Resistance Levels – Red Lines Indicates Support Levels
Light Blue is a Pivot Point – Black represents the price when the report was produced
GBP/USD Intraday: Break resistance level
Our pivot point is at 1.34160
Preferable Price Action: Buy positions above pivot with targets at 1.34650 & 1.34920 in extension.
Alternative Price Action: The price below pivot would call for further downside to 1.33680 & 1.33440.
Comment: Pair above its 50MA and RSI at 50 levels.
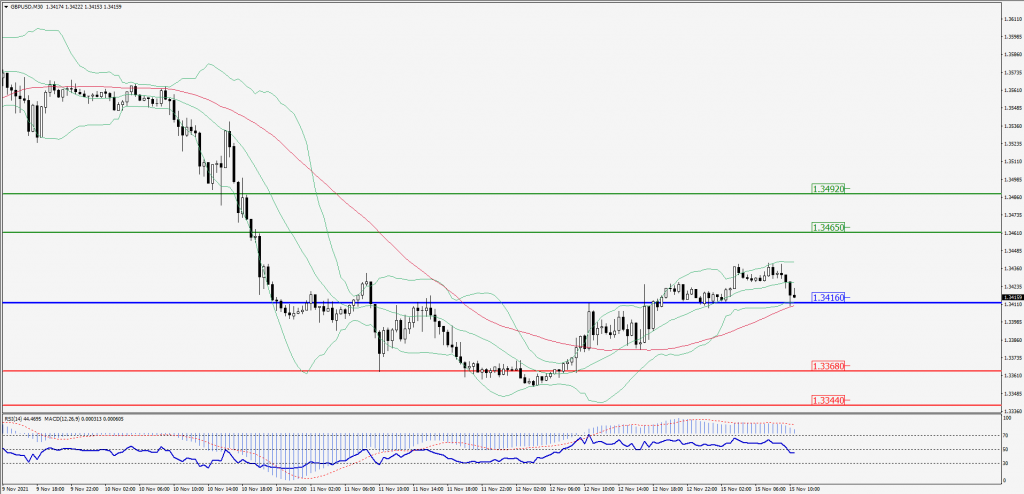
Green Lines Indicate Resistance Levels – Red Lines Indicates Support Levels
Light Blue is a Pivot Point – Black represents the price when the report was produced
USD/JPY Intraday: Resistance at 114.100
Our pivot point is at 114.100
Preferable Price Action: Sell position Below pivot with the target at 113.730 and 113.570 in extension.
Alternative Price Action: The Upside breakout of the pivot would call for 114.480 and 114.690.
Comment: Price below its 55MA & 20MA and MACD in negative territory.
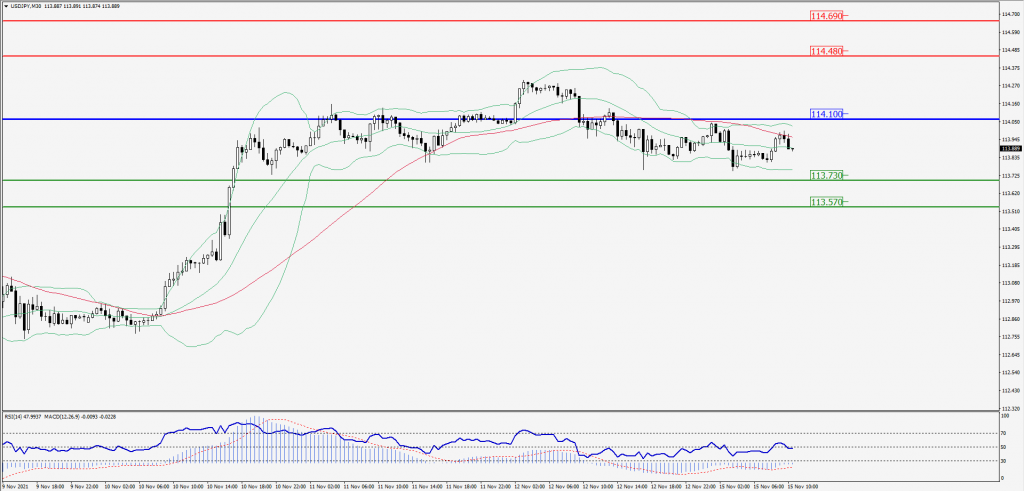
Green Lines Indicate Resistance Levels – Red Lines Indicates Support Levels
Light Blue is a Pivot Point – Black represents the price when the report was produced
AUD/USD Intraday: Trend on the upside
Our pivot point is at 0.73340
Preferable Price Action: Buy Positions above pivot with targets at 0.73690 & 0.73860 in extension.
Alternative Price Action: Below pivot looks for a further downside with 0.73000 & 0.72820 as targets.
Comment: Pair above its 55MA & 20MA and RSI above 50 levels.
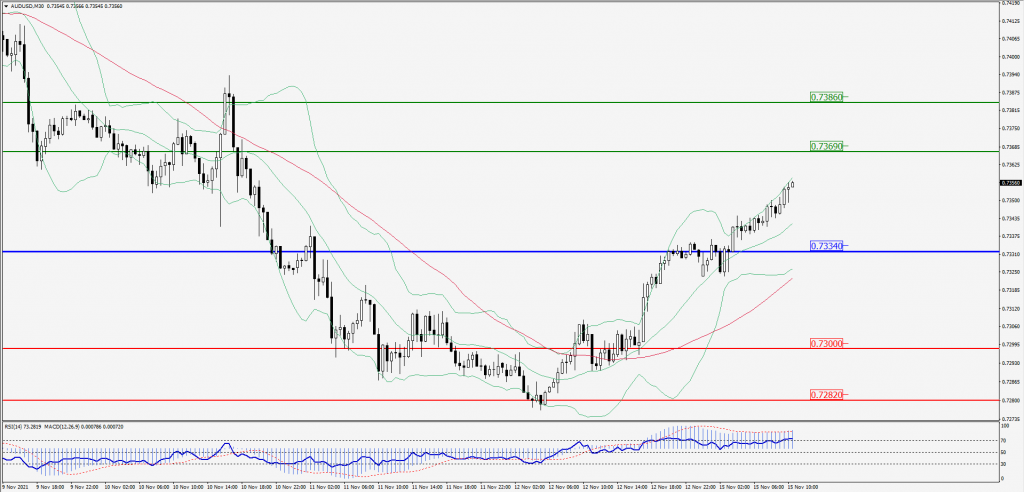
Green Lines Indicate Resistance Levels – Red Lines Indicates Support Levels
Light Blue is a Pivot Point – Black represents the price when the report was produced
CRUDEOIL Intraday: Trend on the downside
Our pivot point is at 79.70
Preferable Price Action: Below pivots Sell Oil with 78.30 & 77.50 as targets.
Alternative Price Action: Buy crude Above pivot with targets at 81.20 and 82.10 in extension.
Comment: Crude is below its 55MA & 20MA and MACD in the negative territory.
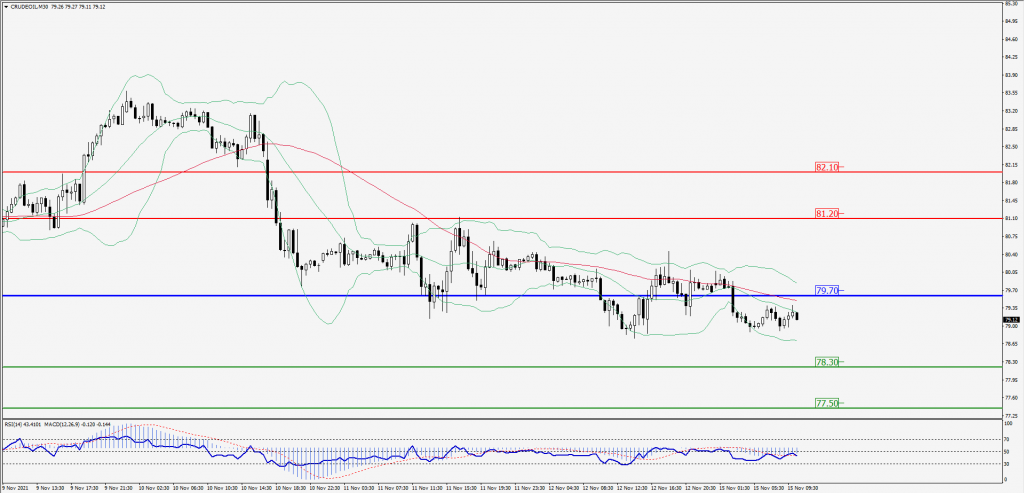
Green Lines Indicate Resistance Levels – Red Lines Indicates Support Levels
Light Blue is a Pivot Point – Black represents the price when the report was produced
XAU/USD Intraday: In a consolidation zone
Our pivot point is 1862.10
Preferable Price Action: Further downside to 1849.40 and 1842.90.
Alternative Price Action: If the price gives a upside breakout of a pivot, then the price extends to 1875.80 and 1881.20.
Comment: MACD in negative territory and price above its 20MA & 55MA.
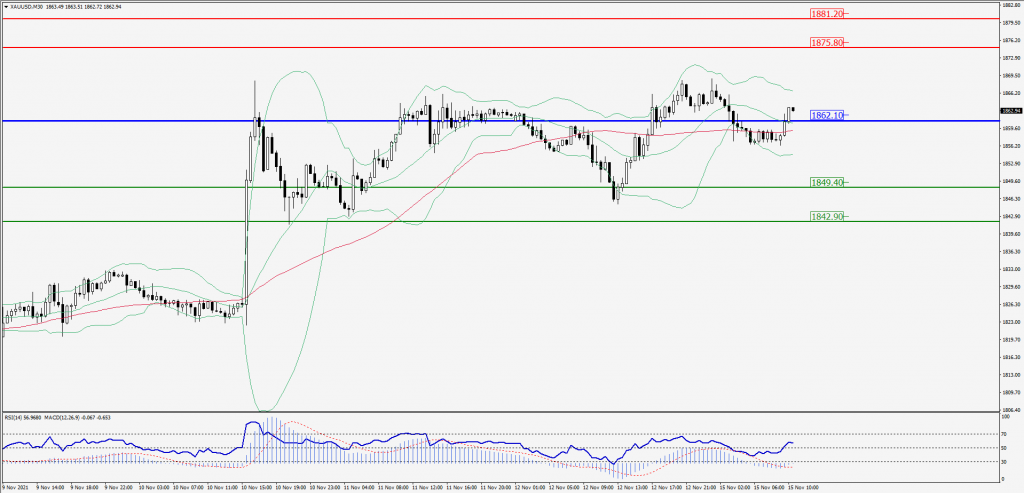
Green Lines Indicate Resistance Levels – Red Lines Indicates Support Levels
Light Blue is a Pivot Point – Black represents the price when the report was produced
Dow Jones Intraday: In a consolidation zone
Our pivot point is 35,958.00
Preferable Price Action: Take Long positions above pivot with targets at 36,198.00 & 36,311.00.
Alternative Price Action: Below 35,958.00 looks for further downside to 35,703.00 & 35,582.00.
Comment: Price above its 55MA & 20MA and RSI above 50 levels.
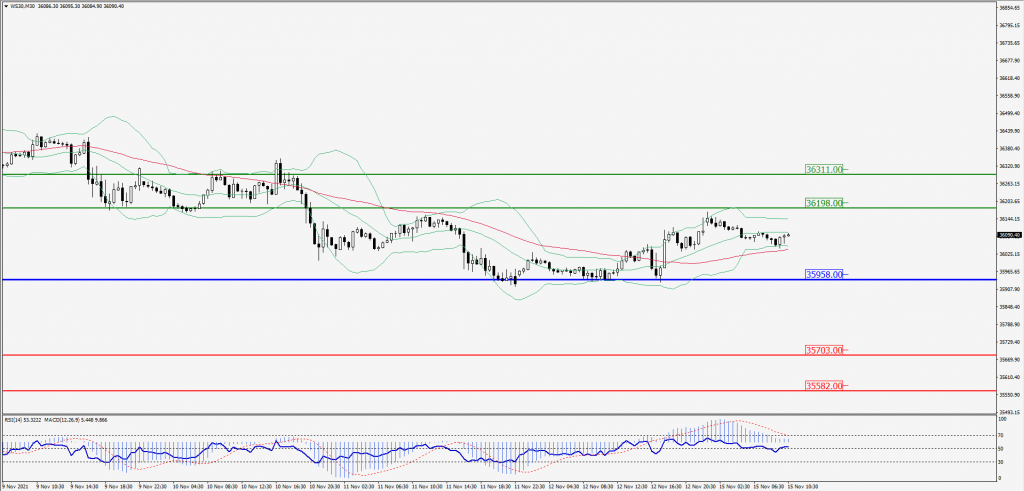
Green Lines Indicate Resistance Levels – Red Lines Indicates Support Levels
Light Blue is a Pivot Point – Black represents the price when the report was produced