Market Wrap: Stocks, Bonds, Commodities
The Dow Jones industrial Average slipped Friday as traders parsed through the first batch of fourth-quarter earnings and digested the second in a pair of closely watched inflation reports this week.
The Dow Jones Industrial Average fell 118.29 points to 37,711.04, the S&P 500 gain 0.08% to 4,783.83 and the Nasdaq Composite add 0.02 points to 14,972.76.
MSCI’s index of Asia-Pacific stocks outside Japan is decline 0.08% to 619.82 levels. The Australian index was lower by 0.03% to 7,496.30. Japanese Nikkei Index asceend 0.98% today.
European stocks were negative on Monday, with the Stoxx Europe 50 Index fell 0.45% to 4,459.65, Germany’s DAX drop 0.43% to 16,633.40, and France’s CAC decline 0.52% to 7,426.30 and U.K.’s FTSE 100 subtract 0.31% to 7,601.01.
Benchmark 10-year U.S. Treasury fell as deman for safe assets ascend again, today 10-year bond yields positive 0.56% to 3.9740.
Oil prices rose after Britain and the United States carried out military strikes against targets in Houthi-controlled areas of Yemen, as tensions in the Red Sea mount further.
Spot Brent crude oil drop 0.29% to $78.09 per barrel. US West Texas Intermediate crude is down 0.36% to $72.53 a barrel.
The yellow metal gold is advance 0.38% to 2,059.55 dollars per ounce.
Market Wrap: Forex
The U.S. dollar steadied in early European trade Friday, as investors digested mixed U.S. consumer inflation data and the potential impact on future Federal Reserve rate cuts.
Today, the U.S. dollar index measures the Greenback against a trade-weighted basket of six major currencies, which surged 0.07% to 102.225.
The Euro US Dollar (EUR/USD) is a widely traded pair that is up 0.05% today. This left the pair trading around $1.09550.
The Japanese yen was negative against the U.S. dollar on Monday. Today USD/JPY is surged 0.41% to the 145.500 level.
Another commodity-related currency negative against the U.S dollar, AUD/USD fell 0.25% to 0.66680, and NZD/USD slipped 0.66% to 0.62010 level.
EUR/USD Intraday: Trend on the upside
Our pivot point is at 1.09640
Preferable Price Action: Take buy positions above pivot level with targets at 1.09800 & 1.09910 in extension.
Alternative Price Action: Below pivot looks for a further downside to 1.09510 & 1.09430.
Comment: RSI is above 50 levels and Pairs above 20MA.
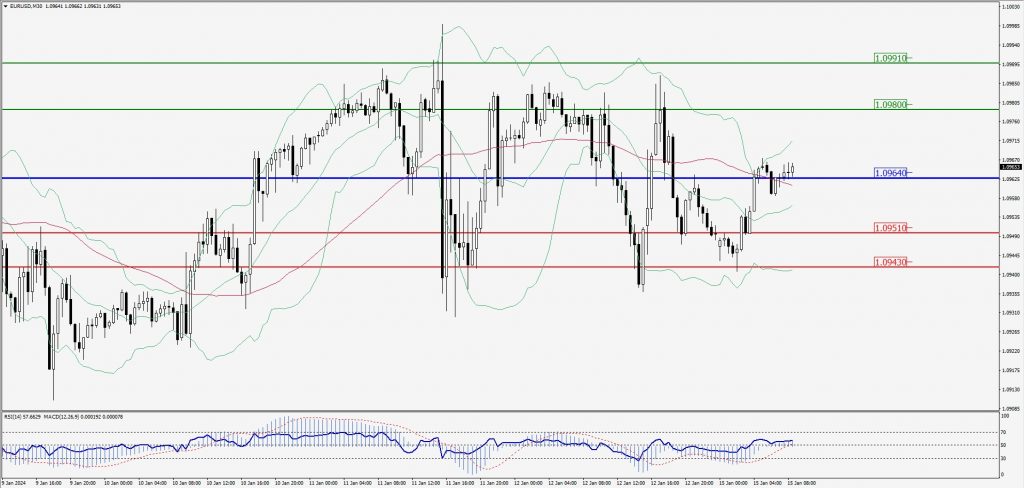
Green Lines Indicate Resistance Levels – Red Lines Indicate Support Levels
Light Blue is a Pivot Point – Black represents the price when the report was produced
GBP/USD Intraday: Support level at 1.27540
Our pivot point is at 1.27540
Preferable Price Action: Buy positions above pivot with targets at 1.27710 & 1.27820 in extension.
Alternative Price Action: The price below pivot would call for further downside to 1.27390 & 1.27300.
Comment: RSI is above 50 levels and Pairs above 20MA.
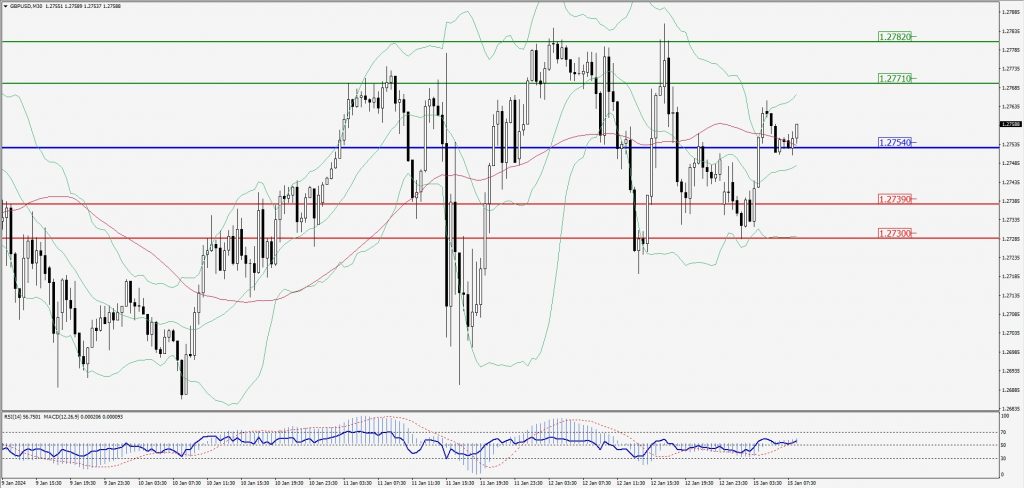
Green Lines Indicate Resistance Levels – Red Lines Indicate Support Levels
Light Blue is a Pivot Point – Black represents the price when the report was produced
USD/JPY Intraday: Trend on the upside
Our pivot point is at 145.080
Preferable Price Action: Buy position above pivot with the target at 145.590 and 145.980 in extension.
Alternative Price Action: The downside breakout of the pivot would call for 144.670 and 144.330.
Comment: MACD is above 50 level and Pairs below its 20MA & 55MA.
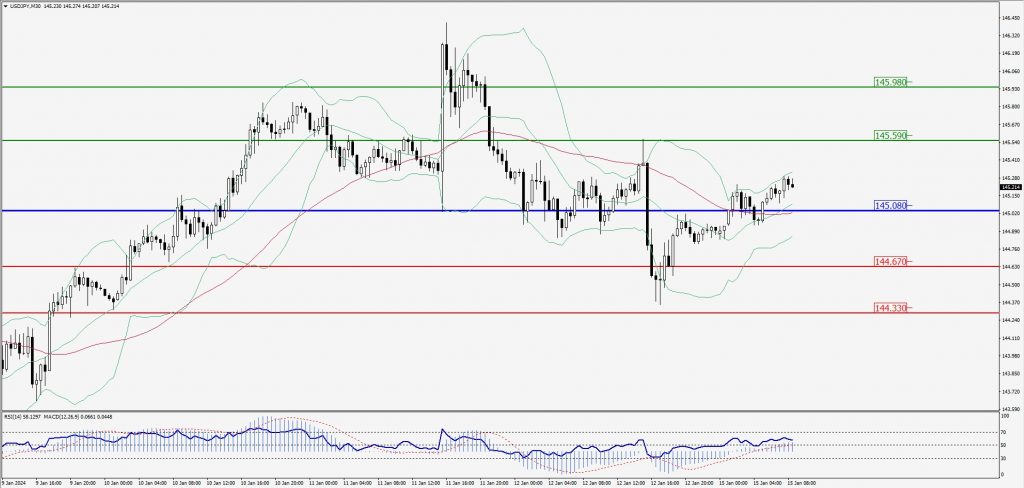
Green Lines Indicate Resistance Levels – Red Lines Indicate Support Levels
Light Blue is a Pivot Point – Black represents the price when the report was produced
AUD/USD Intraday: Trend on the downside
Our pivot point is at 0.66930
Preferable Price Action: Sell positions below pivot with targets at 0.66750 & 0.66640 in extension.
Alternative Price Action: Above pivot looks for a further upside with 0.67080 & 0.67200 as targets.
Comment: RSI is below 50 levels and Pairs below its 20MA & 55MA.
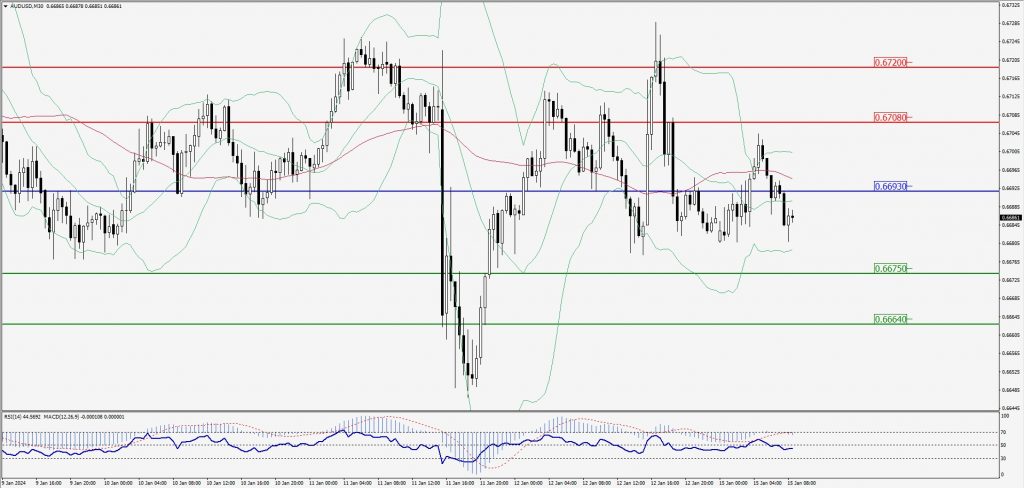
Green Lines Indicate Resistance Levels – Red Lines Indicate Support Levels
Light Blue is a Pivot Point – Black represents the price when the report was produced
CRUDEOIL Intraday: Trend on the downside
Our pivot point is at 73.04
Preferable Price Action: Below pivot sell oil with 72.24 & 71.72 as targets.
Alternative Price Action: Buy crude above pivot with targets at 73.79 and 74.31 in extension.
Comment: MACD is negative territory and Pairs below 55MA.
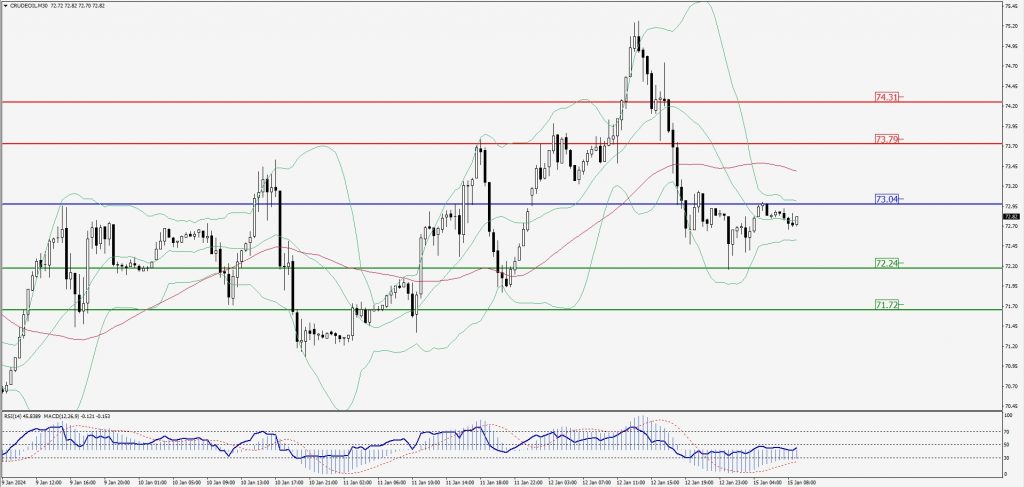
Green Lines Indicate Resistance Levels – Red Lines Indicate Support Levels
Light Blue is a Pivot Point – Black represents the price when the report was produced
XAU/USD Intraday: Trend on the upside
Our pivot point is 2052.60
Preferable Price Action: Further upside to 2061.90 and 2067.40.
Alternative Price Action: If the price gives a downside breakout of a pivot, then the price extends to 2045.40 and 2040.50.
Comment: MACD is above 50 level and Pairs above its 20MA & 55MA.
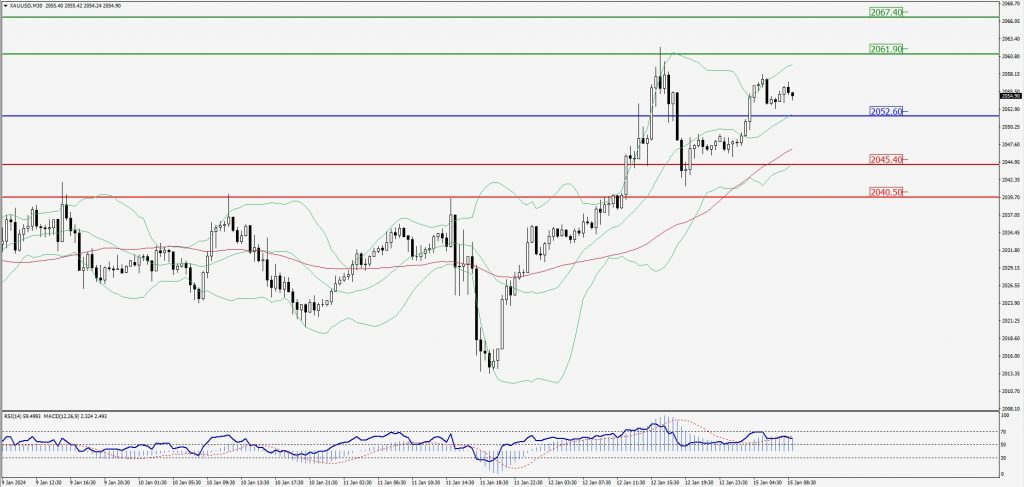
Green Lines Indicate Resistance Levels – Red Lines Indicate Support Levels
Light Blue is a Pivot Point – Black represents the price when the report was produced
Dow Jones Intraday: Trend on the upside
Our pivot point is 37,596.90
Preferable Price Action: Take buy positions above the pivot with targets at 37,671.90 & 37,737.50.
Alternative Price Action: Below 37,596.90 looks for further upside to 37,779.30 & 37,830.70.
Comment: RSI is above 50 levels and Pairs above 20MA.
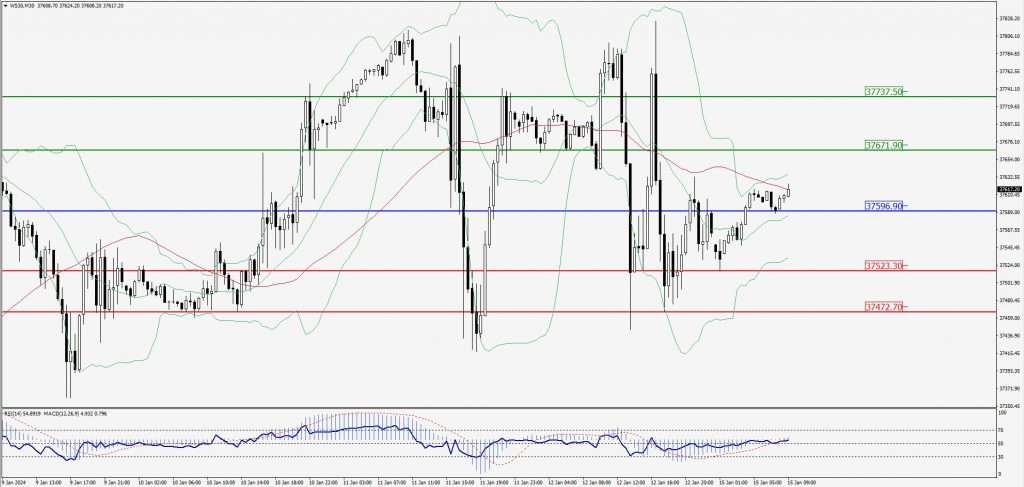
Green Lines Indicate Resistance Levels – Red Lines Indicate Support Levels
Light Blue is a Pivot Point – Black represents the price when the report was produced