Market Wrap: Stocks, Bonds, Commodities
US stocks closed at yet another fresh highs of the year on Thursday, with the dovish Federal Reserve signals pushing the S&P 500 closer to the all-time high.
The Dow Jones Industrial Average rose 512.30 points to 37,090.24, the S&P 500 gain 1.37% to 4,707.09 and the Nasdaq Composite add 200.57 points to 14,733.96.
MSCI’s index of Asia-Pacific stocks outside Japan is advance 1.52% to 619.11 levels. The Australian index was higher by 1.62% to 7,377.90. Japanese Nikkei Index drop 0.80% today.
European stocks were positive on Friday, with the Stoxx Europe 50 Index fell 0.14% to 4,530.35, Germany’s DAX drop 0.15% to 16,766.05, and France’s CAC decline 0.16% to 7,531.22 and U.K.’s FTSE 100 add 0.08% to 7,548.44.
Benchmark 10-year U.S. Treasury fell as deman for safe assets ascend again, today 10-year bond yields negative 1.98% to 3.9540.
Oil prices rose in Asian trade on Thursday, extending previous gains, on a bigger-than-expected weekly withdrawal from U.S. crude storage and hopeful demand expectations after the U.S. Federal Reserve sent signals on lower borrowing costs in 2024.
Spot Brent crude oil ascend 0.66% to $74.75 per barrel. US West Texas Intermediate crude is up 0.53% to $69.84 a barrel.
The yellow metal gold is advance 2.51% to 2,047.30 dollars per ounce.
Market Wrap: Forex
The U.S. dollar edged higher in early trade Wednesday, boosted by sticky inflation ahead of the latest Fed meeting, while sterling is hit by weak growth numbers.
Today, the U.S. dollar index measures the Greenback against a trade-weighted basket of six major currencies, which slipped 0.16% to 102.315.
The Euro US Dollar (EUR/USD) is a widely traded pair that is up 0.17% today. This left the pair trading around $1.08920.
The Japanese yen was negative against the U.S. dollar on Friday. Today USD/JPY is slipped 0.70% to the 141.880 level.
Another commodity-related currency positive against the U.S dollar, AUD/USD rose 0.03% to 0.67050, and NZD/USD surged 0.78% to 0.62210 level.
EUR/USD Intraday: Major trend on the upside
Preferable Price Action: Take buy positions above pivot level with targets at 1.09300 & 1.09540 in extension.
Alternative Price Action: Below pivot looks for a further downside to 1.08560 & 1.08330.
Comment: RSI is above 50 levels and Pairs above its 20MA & 55MA.
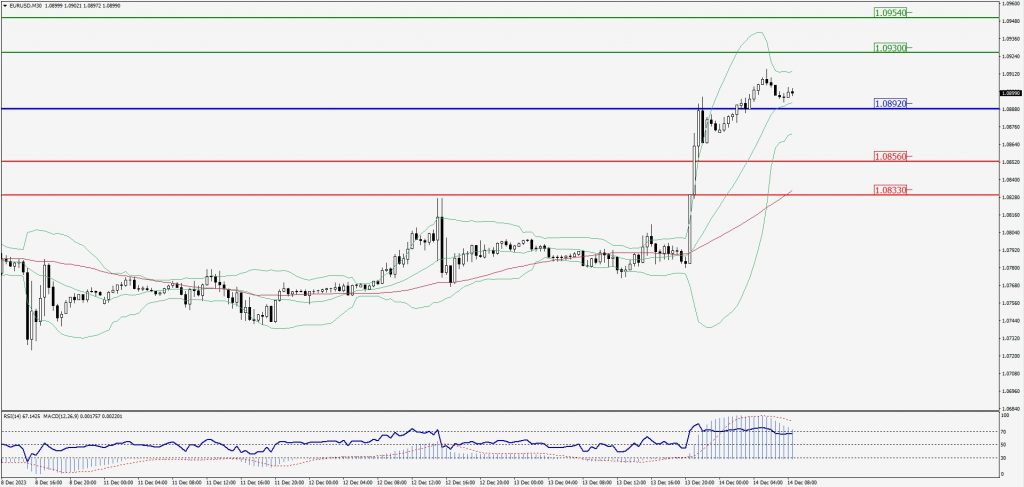
Green Lines Indicate Resistance Levels – Red Lines Indicate Support Levels
Light Blue is a Pivot Point – Black represents the price when the report was produced
GBP/USD Intraday: Major trend on the downside
Our pivot point is at 1.25370
Preferable Price Action: Sell positions below pivot with targets at 1.25120 & 1.25000 in extension.
Alternative Price Action: The price above pivot would call for further upside to 1.25560 & 1.25710.
Comment: RSI is below 50 levels and Pairs below its 20MA & 55MA.
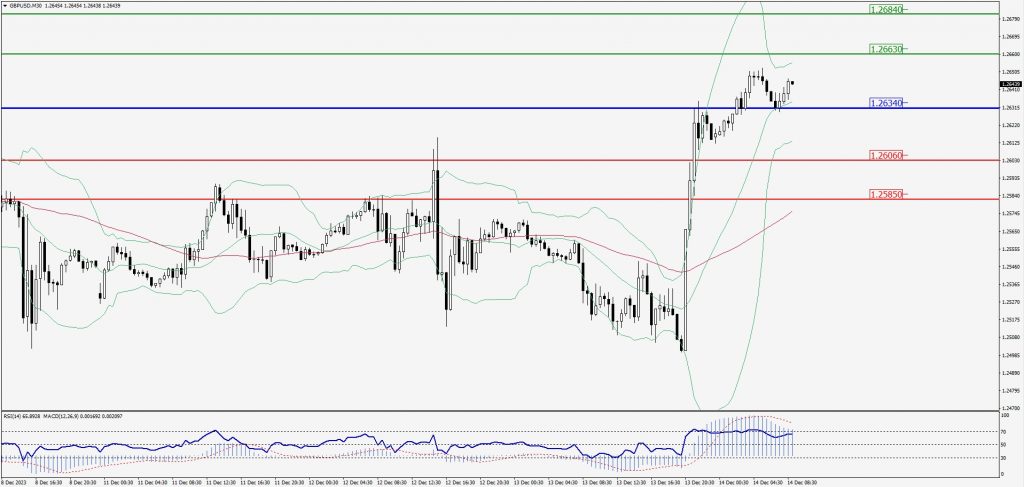
Green Lines Indicate Resistance Levels – Red Lines Indicate Support Levels
Light Blue is a Pivot Point – Black represents the price when the report was produced
USD/JPY Intraday: Resistance level at 141.900
Our pivot point is at 141.900
Preferable Price Action: Sell position below pivot with the target at 140.870 and 140.290 in extension.
Alternative Price Action: The upside breakout of the pivot would call for 142.800 and 143.410.
Comment: MACD is below 50 level and Pairs below its 20MA & 55MA.
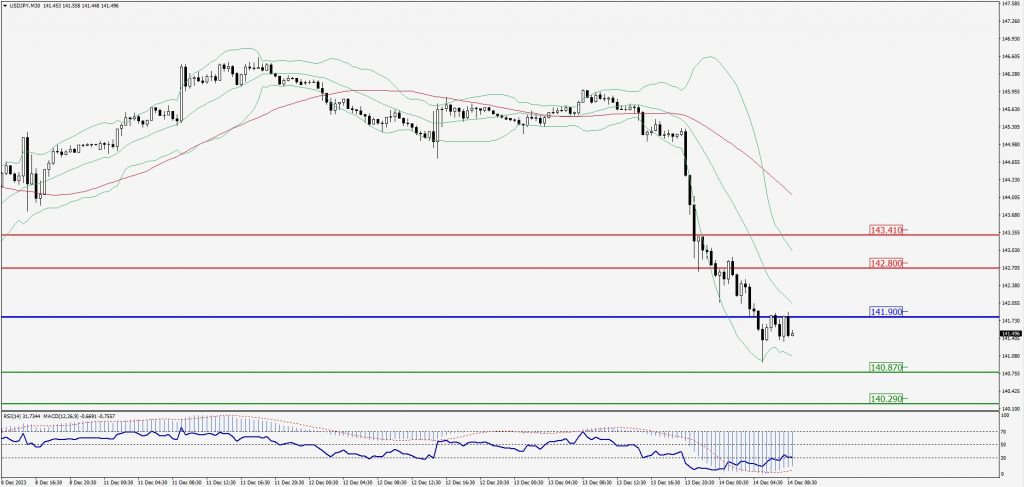
Green Lines Indicate Resistance Levels – Red Lines Indicate Support Levels
Light Blue is a Pivot Point – Black represents the price when the report was produced
AUD/USD Intraday: Major trend on the upside
Our pivot point is at 0.67090
Preferable Price Action: Buy positions above pivot with targets at 0.67420 & 0.67650 in extension.
Alternative Price Action: Below pivot looks for a further downside with 0.66780 & 0.66560 as targets.
Comment: RSI is above 50 levels and Pairs above its 20MA & 55MA.
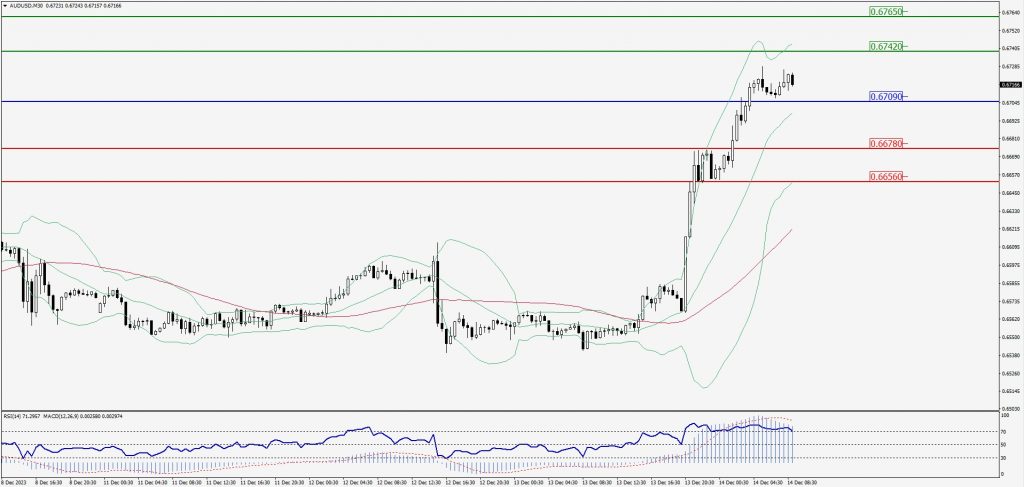
Green Lines Indicate Resistance Levels – Red Lines Indicate Support Levels
Light Blue is a Pivot Point – Black represents the price when the report was produced
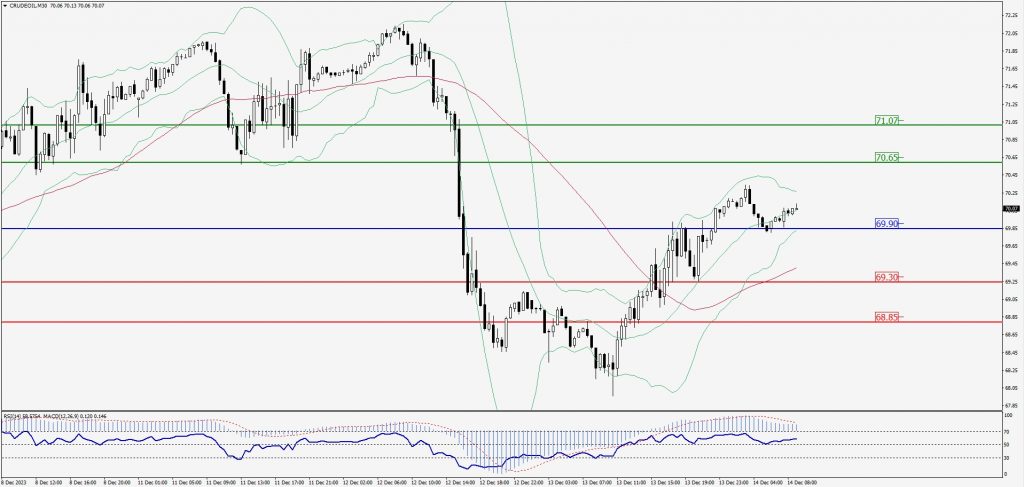
CRUDEOIL Intraday: Support level at 69.90
Our pivot point is at 69.90
Preferable Price Action: Above pivot buy oil with 70.65 & 71.07 as targets.
Alternative Price Action: Sell crude below pivot with targets at 69.30 and 68.85 in extension.
Comment: MACD is positive territory and Pairs above 55MA.
Green Lines Indicate Resistance Levels – Red Lines Indicate Support Levels
Light Blue is a Pivot Point – Black represents the price when the report was produced
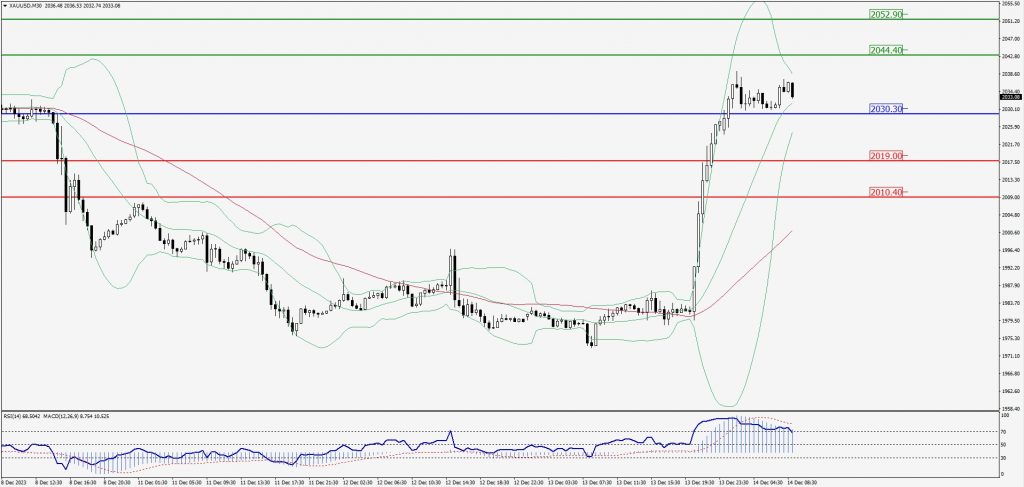
XAU/USD Intraday: Trend on the upside
Our pivot point is 2030.30
Preferable Price Action: Further upside to 2044.40 and 2052.90.
Alternative Price Action: If the price gives a downside breakout of a pivot, then the price extends to 2019.00 and 2010.40.
Comment: MACD is above 50 level and Pairs above its 20MA & 55MA.
Green Lines Indicate Resistance Levels – Red Lines Indicate Support Levels
Light Blue is a Pivot Point – Black represents the price when the report was produced
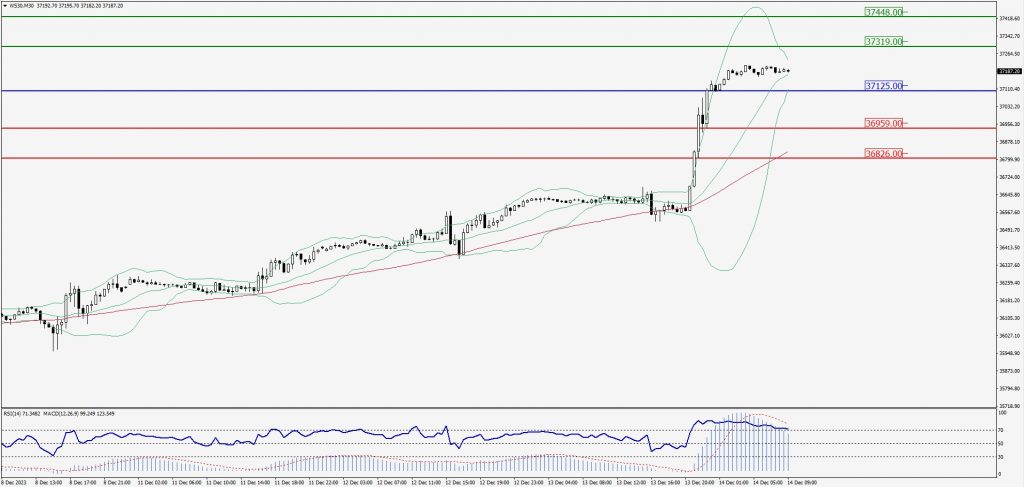
Dow Jones Intraday: Major trend on the upside
Our pivot point is 37,125.00
Preferable Price Action: Take buy positions above the pivot with targets at 37,319.00 & 37,448.00.
Alternative Price Action: Below 37,125.00 looks for further downside to 36,959.00 & 36,826.00.
Comment: RSI is above 50 levels and Pairs above its 20MA & 55MA.
Green Lines Indicate Resistance Levels – Red Lines Indicate Support Levels
Light Blue is a Pivot Point – Black represents the price when the report was produced